Tachometer Infographic Presentation Template
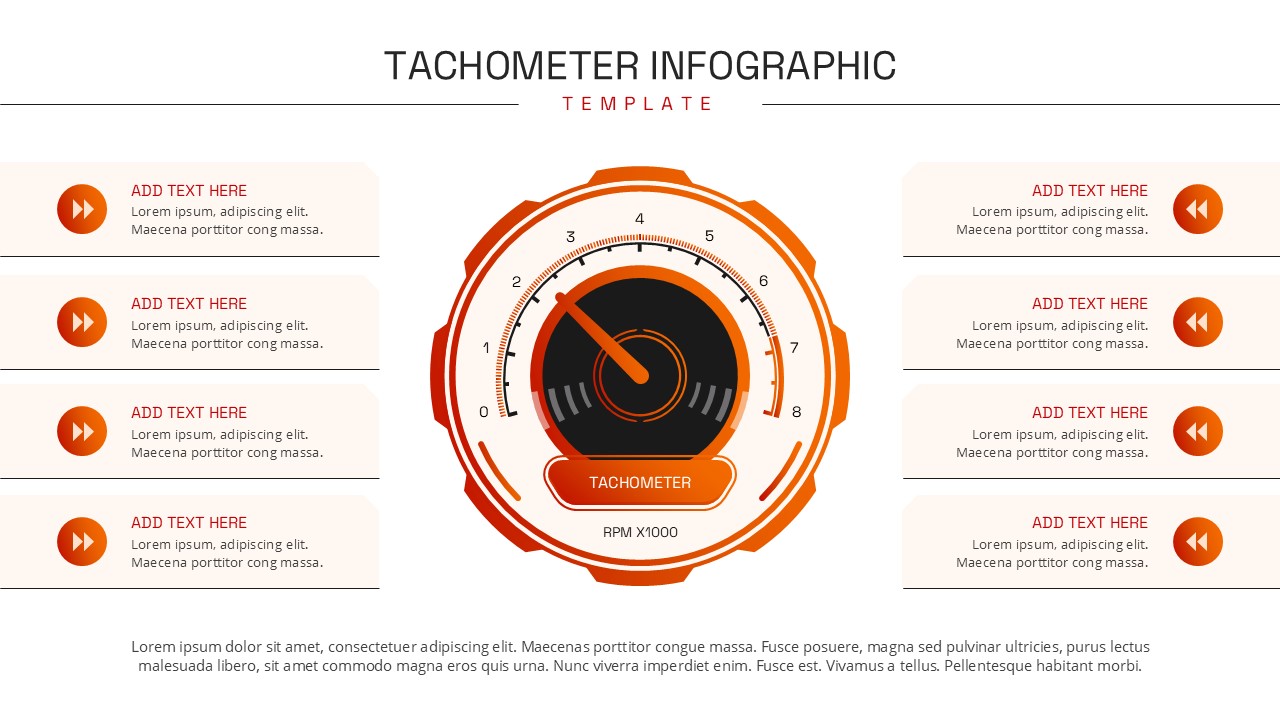
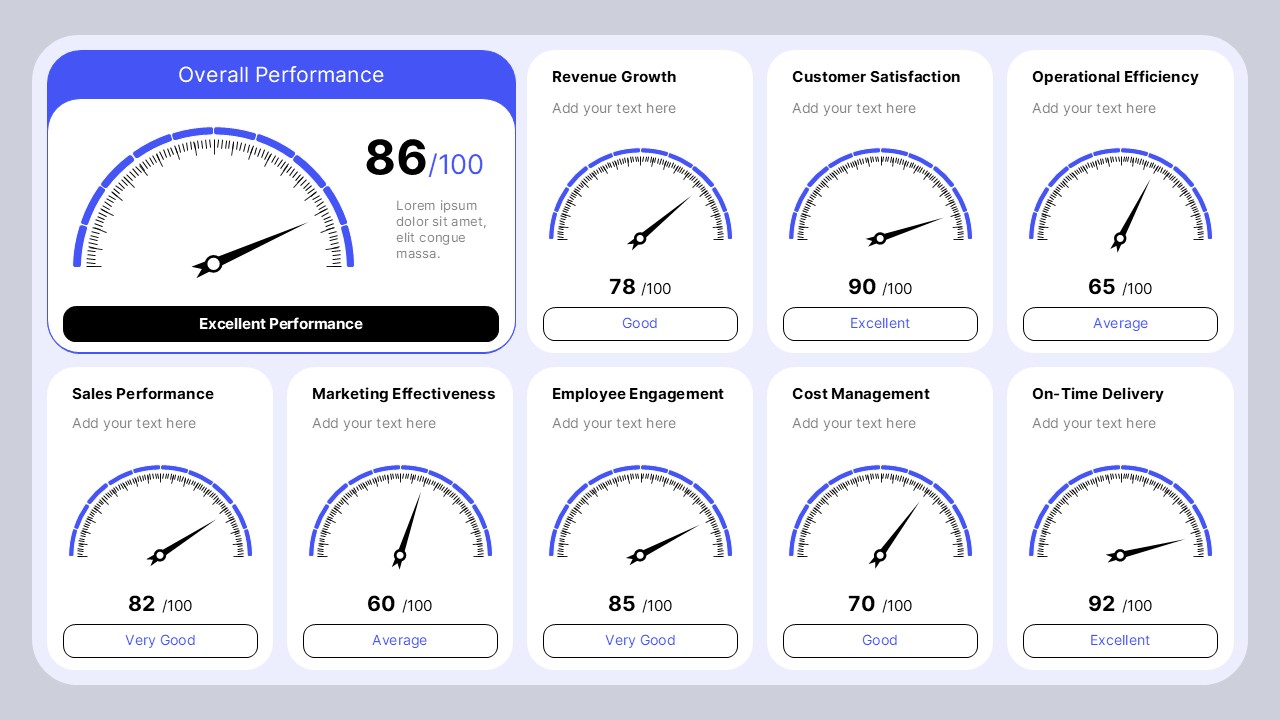
The Tachometer Infographic Template for PowerPoint and Google Slides helps you present performance data, business metrics, and progress indicators in a clear, engaging format. Inspired by a vehicle speedometer, this infographic uses a central tachometer graphic to represent performance levels, targets, and measurable results. Its bold orange and red accents create a striking visual effect against a clean white background. The balanced layout also provides eight text sections around the central graphic, making it easy to organize supporting information. You can use it to highlight key performance indicators, compare business results, monitor project progress, or summarize operational efficiency.
The central gauge acts as the main visual focus, while the surrounding sections give you space to explain important findings. Each text area can represent a goal, metric, milestone, challenge, or recommendation. This structure helps audiences connect performance results with practical insights. The clean design supports presentations where clarity and quick understanding matter most.
You can replace the placeholder text with your own headings, descriptions, figures, and data points. With PowerPoint and Google Slides compatibility, the template is easy to customize for different industries and presentation needs. Use it in business reviews, project updates, performance reports, training sessions, and strategic planning meetings. The tachometer visual is especially useful when you need to communicate progress toward a target or show whether a result is below, meeting, or exceeding expectations. Add clear labels and accurate values to make your message more meaningful.
Key Features and Slide Details
- Central Tachometer Graphic: Highlight performance levels, targets, and progress measurements.
- Eight Supporting Text Sections: Organize goals, results, recommendations, and key findings.
- Performance Reporting: Present KPIs, sales figures, productivity data, or project metrics.
- Modern Visual Design: Use orange and red accents to draw attention to important information.
- Editable Layout: Customize headings, descriptions, colors, and values in PowerPoint and Google Slides.
- Flexible Applications: Adapt the infographic for business reviews, education, marketing, and operational reporting.
Customize the text sections to match your objectives and use the central gauge to reinforce your main message. For the clearest results, keep each heading short and use concise descriptions with accurate data. This approach makes your presentation easier to read and helps audiences understand performance at a glance.
See more

Aspect Ratio
16:9Item ID
SKT04723


FAQs
You May Also Like These Presentation Templates


- Free
- Free


- Free
- Free

- Free
- Free

- Free