Speedometer KPI Dashboard PowerPoint Template
Speedometer KPI Dashboard PowerPoint and Google Slides Template for Performance Tracking
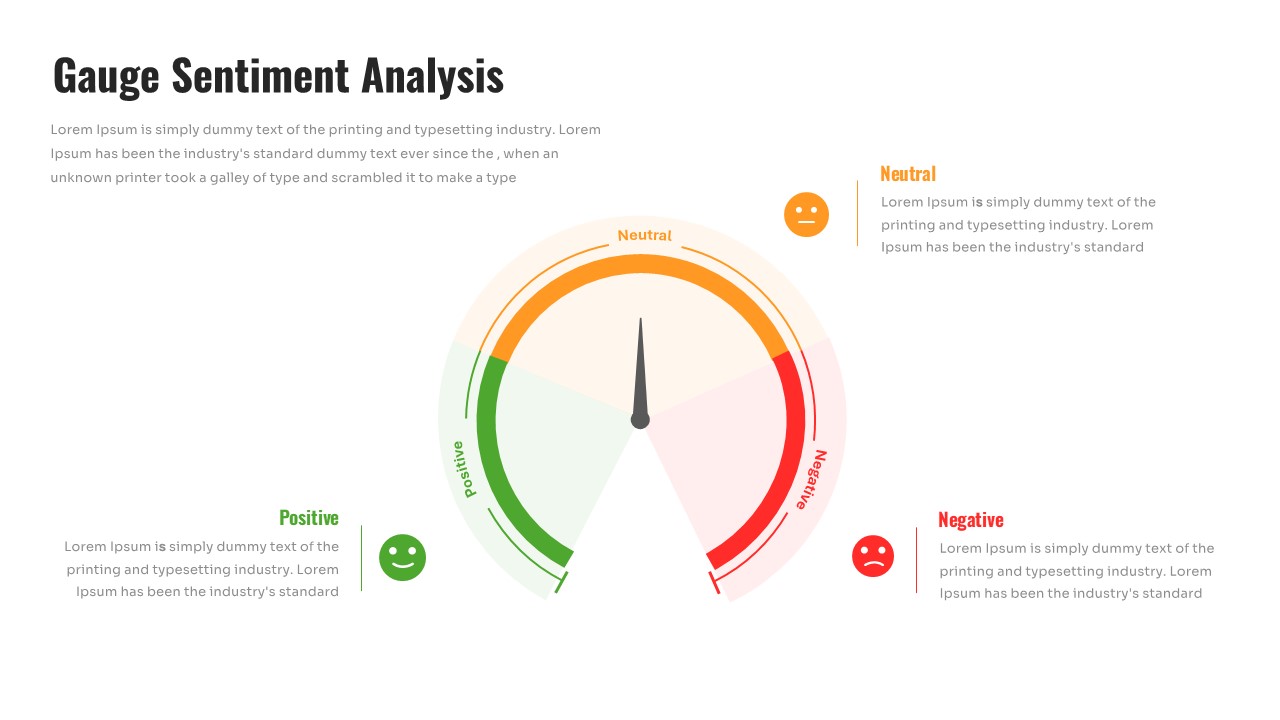
Monitor, present, and communicate business performance with confidence using this Speedometer KPI Dashboard PowerPoint and Google Slides Template. Designed with modern gauge-style indicators, this professional dashboard helps visualize key performance metrics in a clear and engaging format. Whether you’re presenting executive summaries, departmental performance, or operational reports, this template transforms complex data into easy-to-understand visual insights.
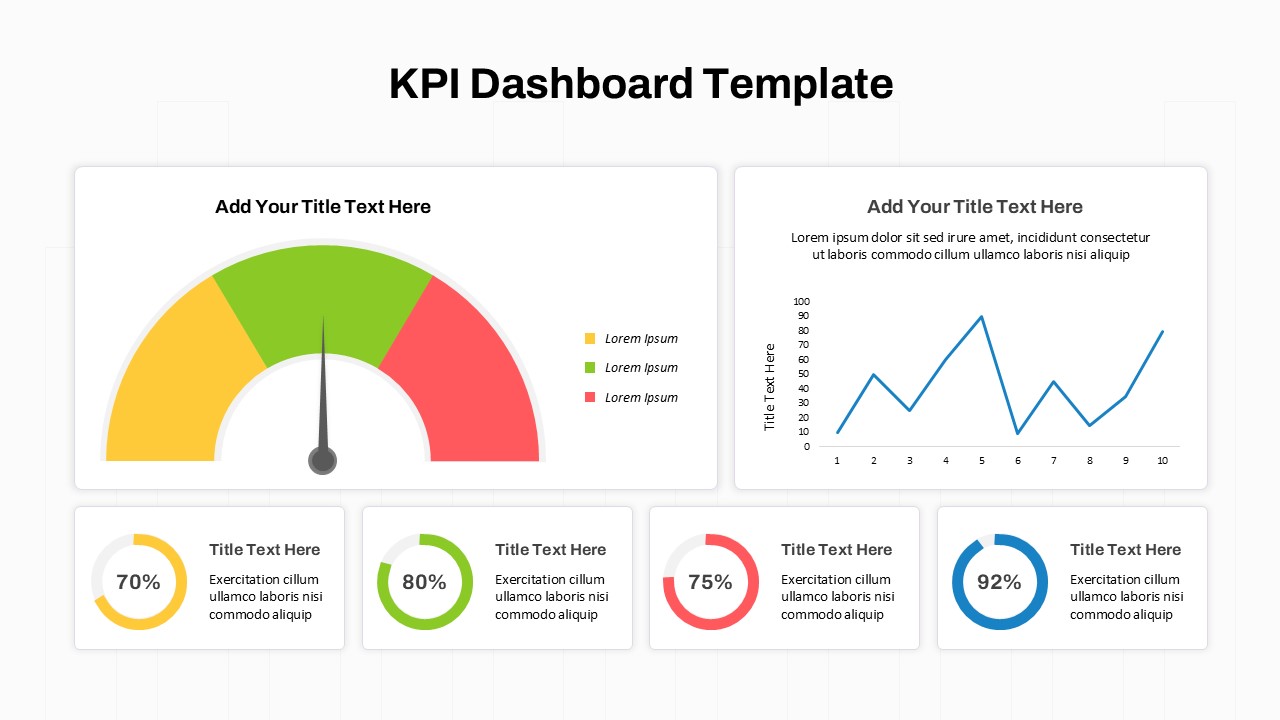
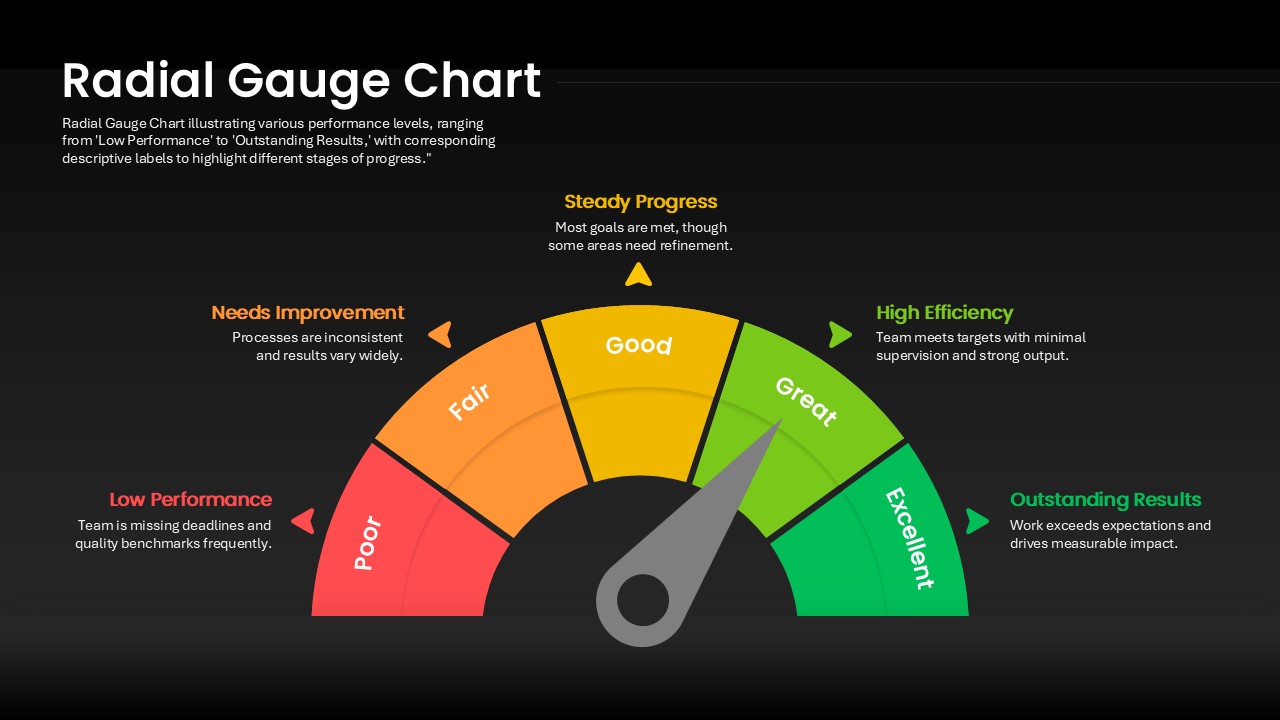
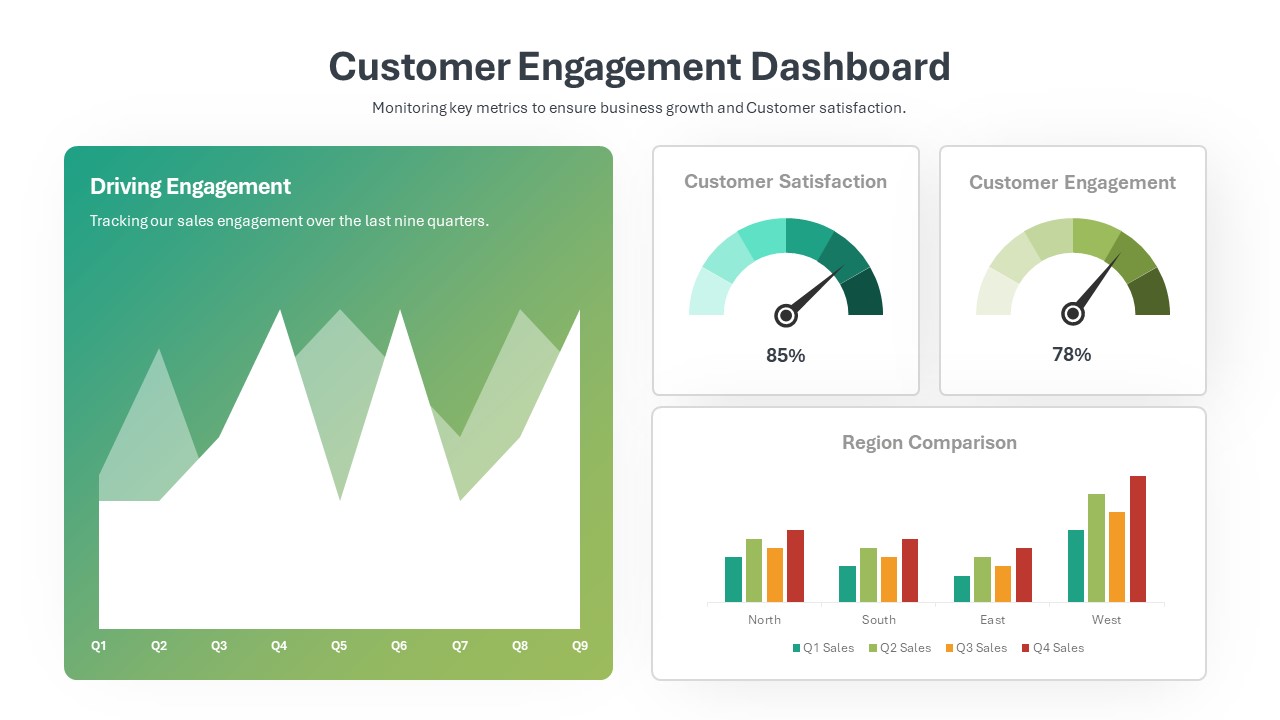
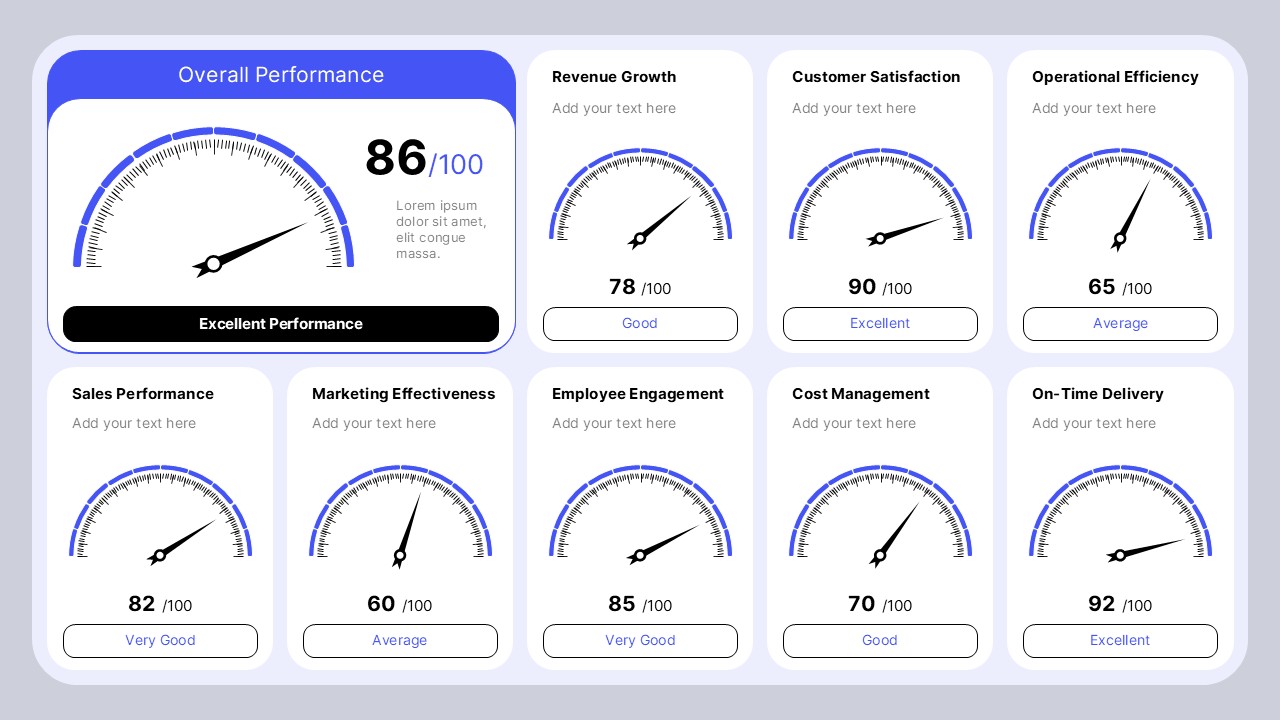
The template features a prominent Overall Performance dashboard alongside multiple individual KPI cards, allowing presenters to highlight both organizational performance and specific business metrics on a single slide. Each speedometer-style gauge displays a score out of 100, making it ideal for tracking measurable objectives, benchmarking results, and comparing performance across different business functions.
The sample layout includes metrics such as Revenue Growth, Customer Satisfaction, Operational Efficiency, Sales Performance, Marketing Effectiveness, Employee Engagement, Cost Management, and On-Time Delivery. Every section is fully editable, enabling users to replace the sample content with their own KPIs, performance scores, titles, descriptions, and rating labels such as Excellent, Very Good, Good, or Average.
Its clean layout, rounded card design, and balanced use of whitespace create a polished and executive-friendly appearance suitable for board meetings, quarterly business reviews, strategy presentations, and management reporting. The dashboard is also highly adaptable for industries including finance, healthcare, manufacturing, retail, logistics, education, consulting, and technology.
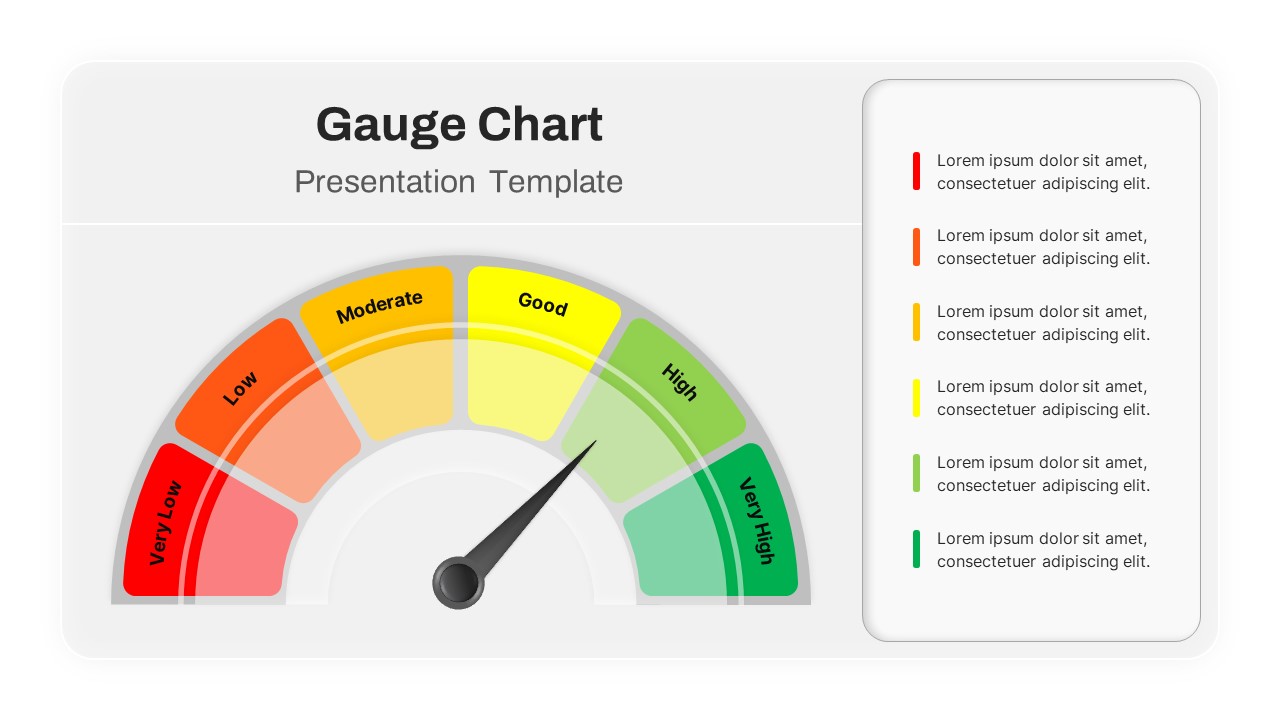
Compatible with both Microsoft PowerPoint and Google Slides, this template is easy to customize without requiring advanced design skills. Users can modify colors, text, values, and performance indicators to align with corporate branding or reporting requirements. The visual speedometer format makes it easier for stakeholders to quickly identify strengths, weaknesses, and areas requiring attention.
See more

Aspect Ratio
16:9Item ID
SKT04707


Features of this template
Other User Cases of the Template
Executive KPI reporting, Business performance dashboard, Balanced scorecard presentation, Department performance review, Quarterly business review, Sales performance tracking, Marketing analytics report, Customer satisfaction dashboard, Employee performance evaluation, Operational efficiency report, Project health dashboard, Manufacturing KPI monitoring, Financial performance presentation, Service quality assessment, Logistics performance tracking, HR performance metrics, Strategic planning meetings, Performance benchmarking, Business analytics presentation, Management reporting dashboard
FAQs
You May Also Like These Presentation Templates

- Free
- Free
- Free

- Free

- Free
- Free
- Free