Profit & Loss Dashboard Infographic PowerPoint Template
The Profit & Loss Dashboard Infographic Template is a modern and professional presentation solution designed to help businesses visualize financial performance with clarity and impact. Featuring a sleek dark-themed layout, this template transforms complex financial data into easy-to-understand visuals, making it ideal for executive reporting, financial reviews, business planning, and stakeholder presentations.
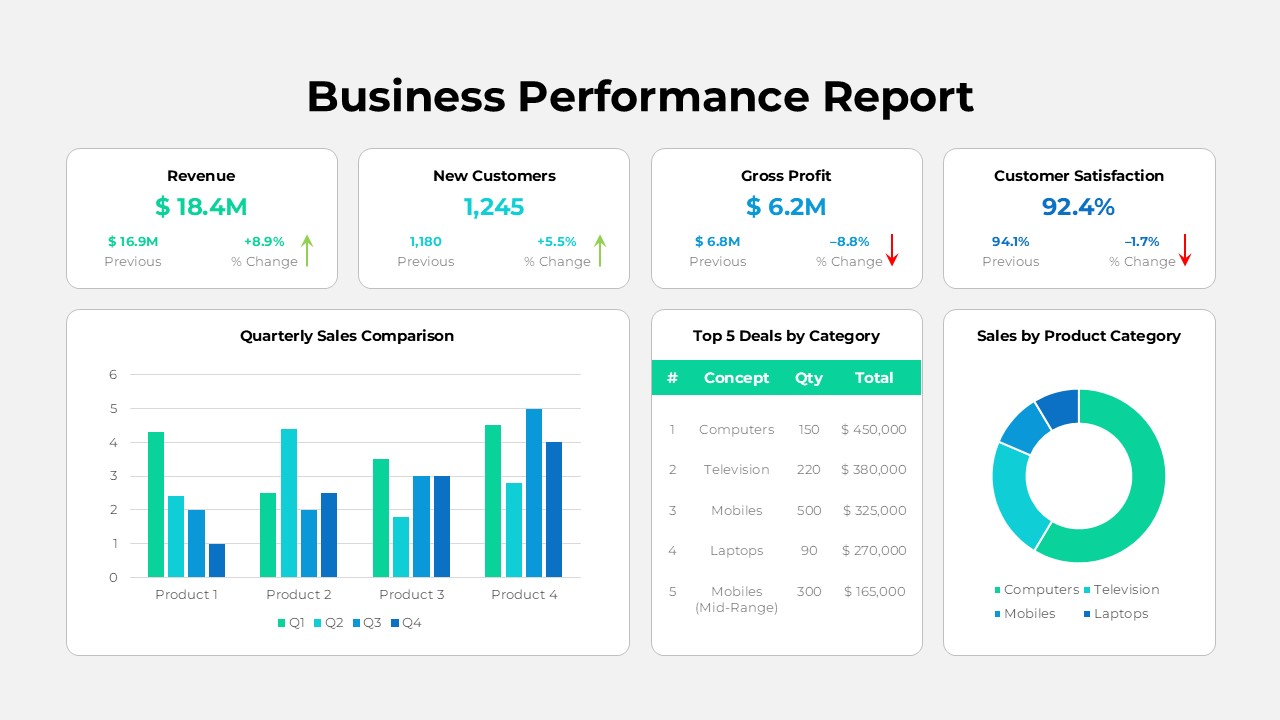
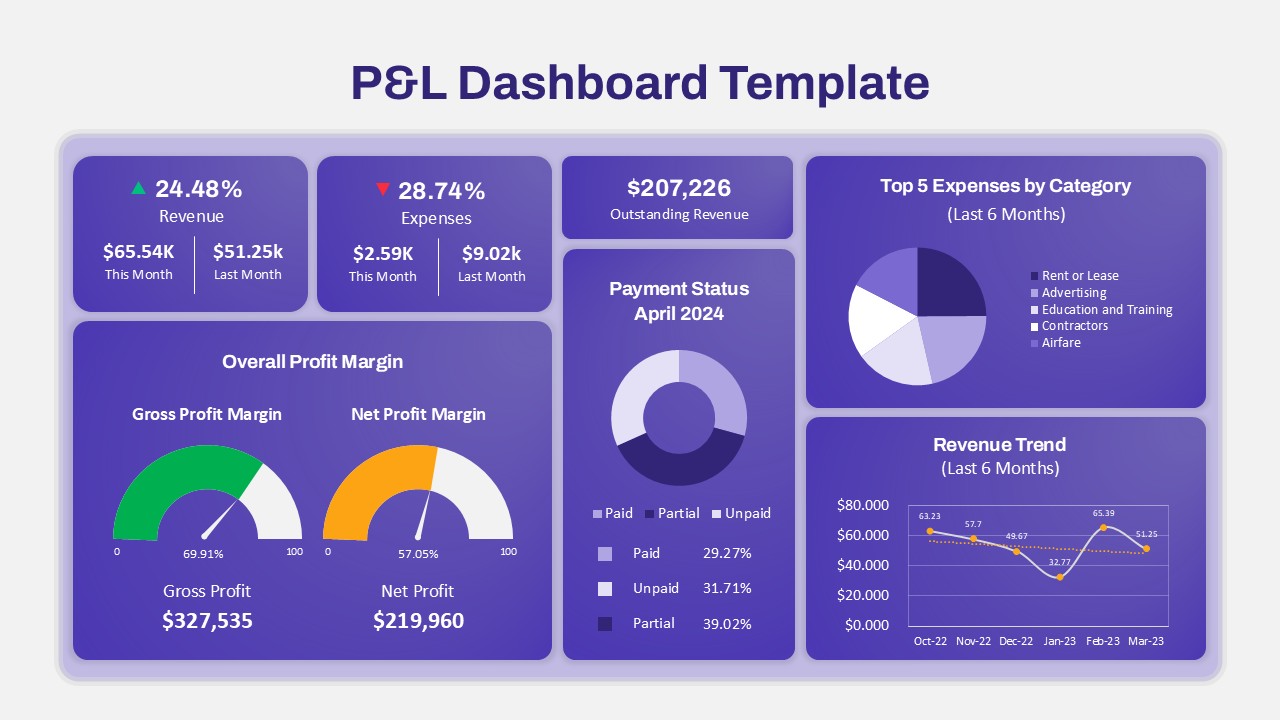
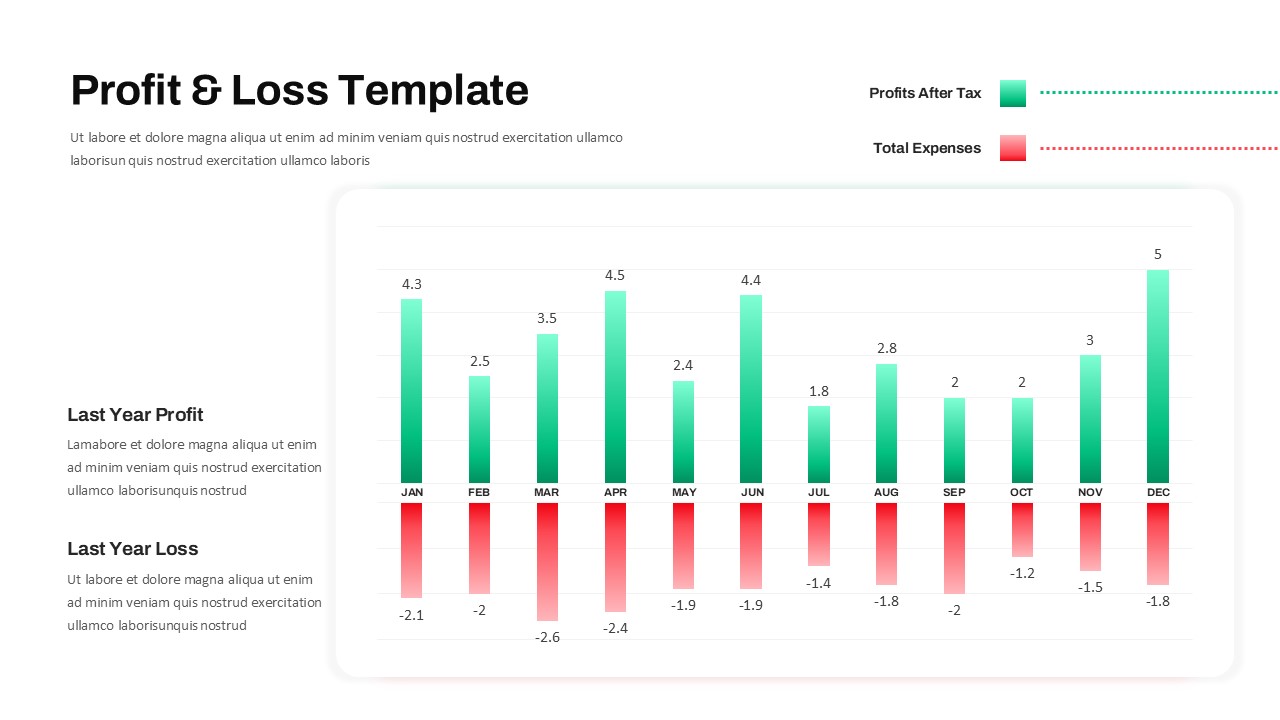
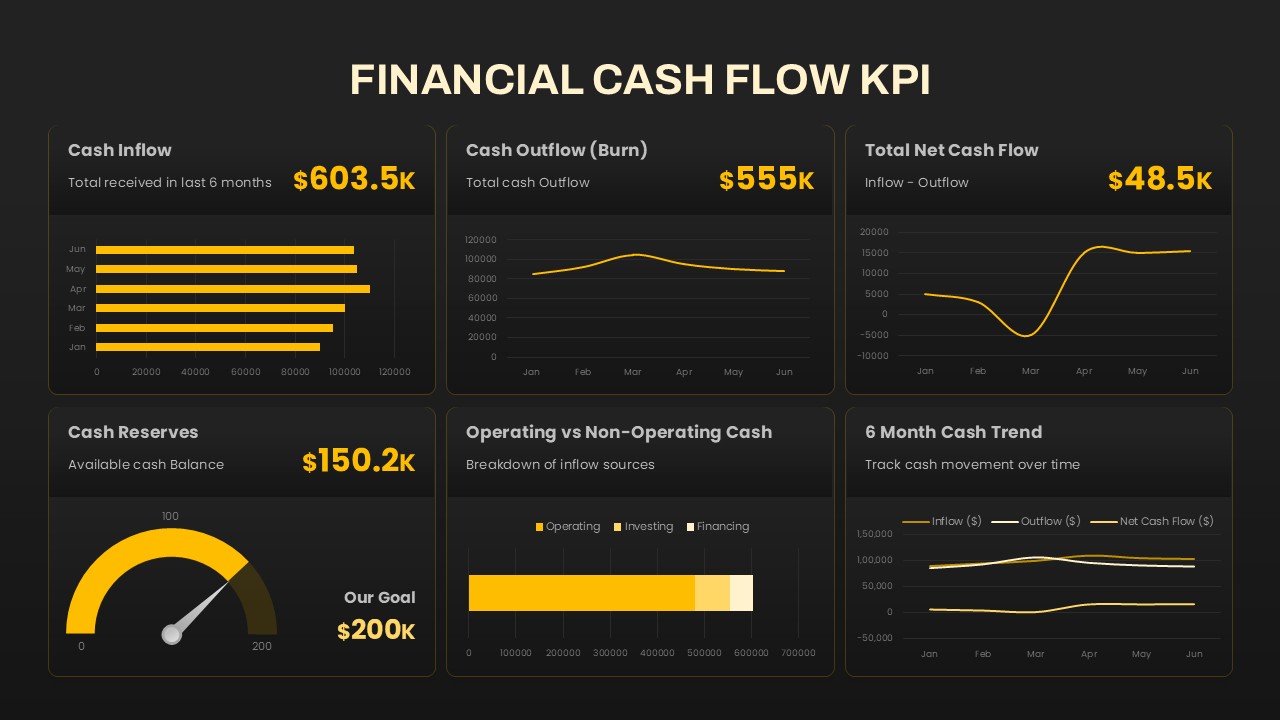
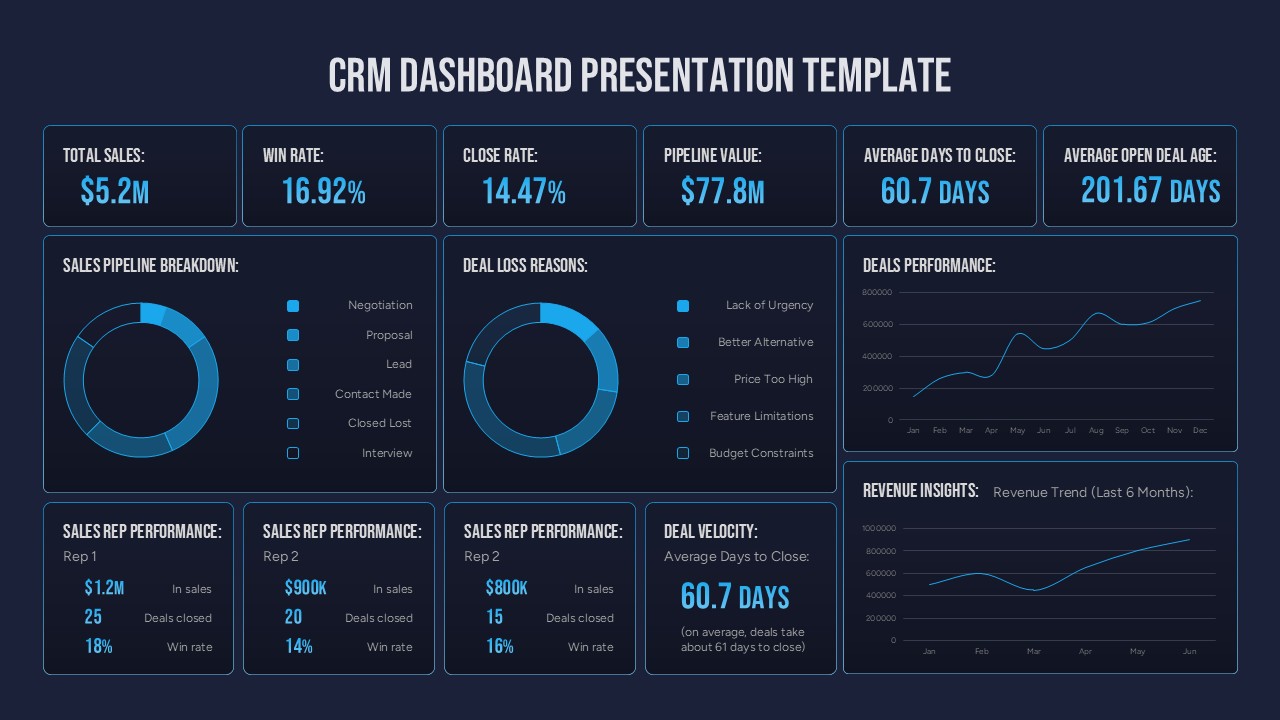
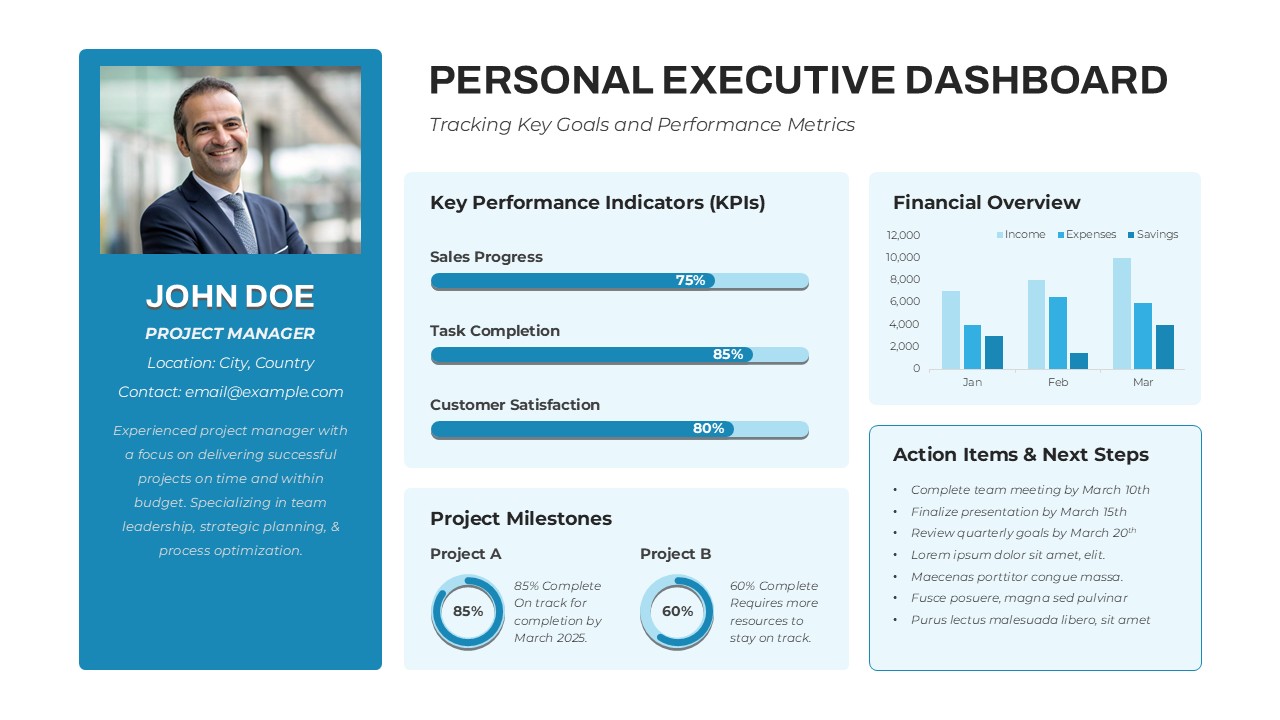
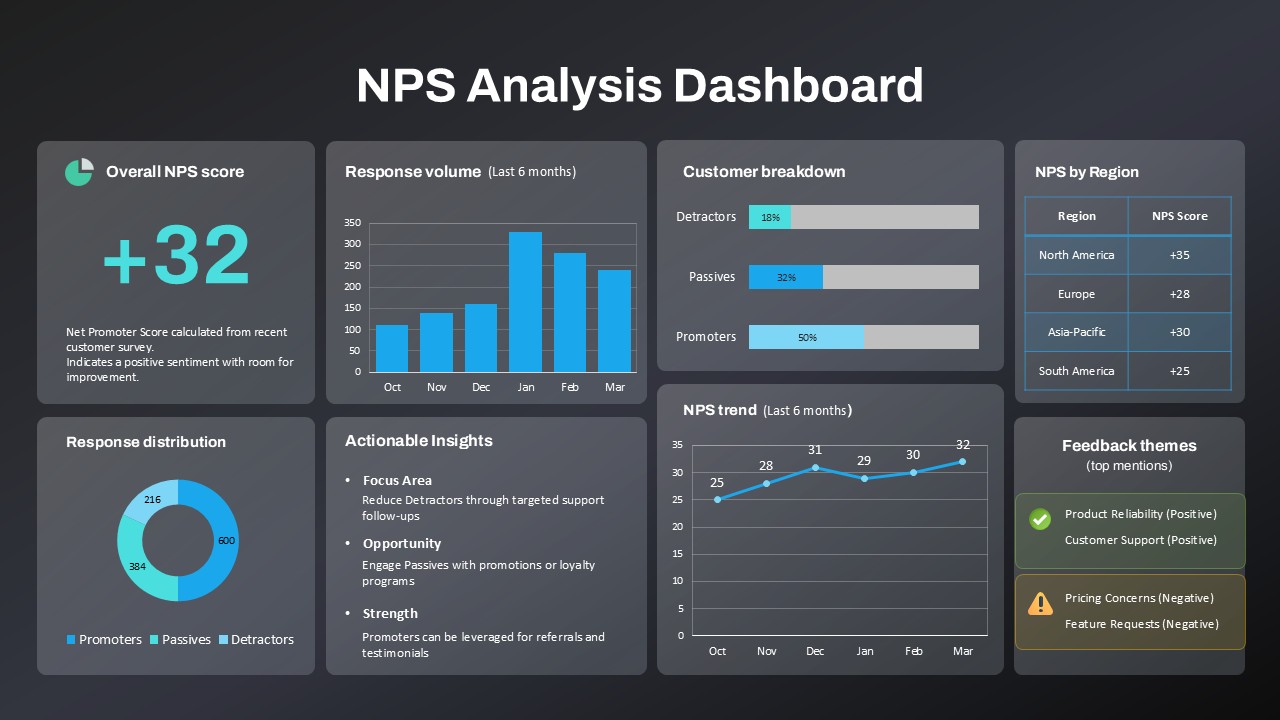
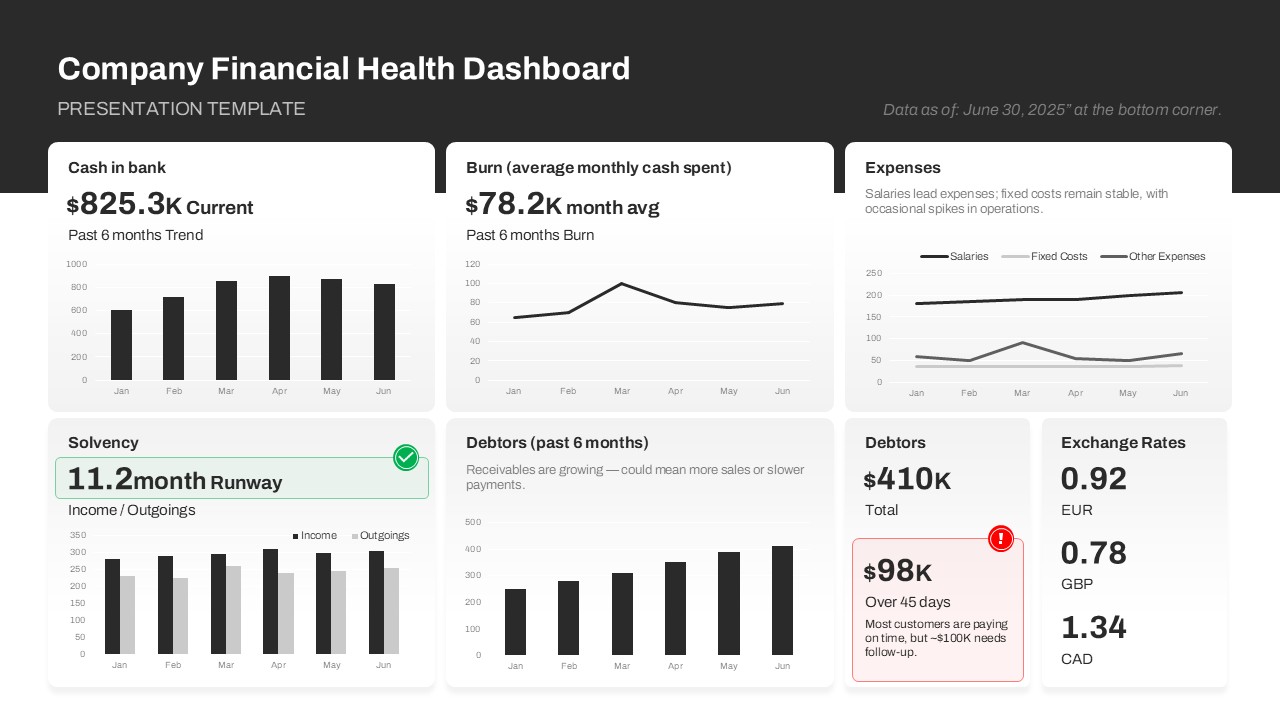
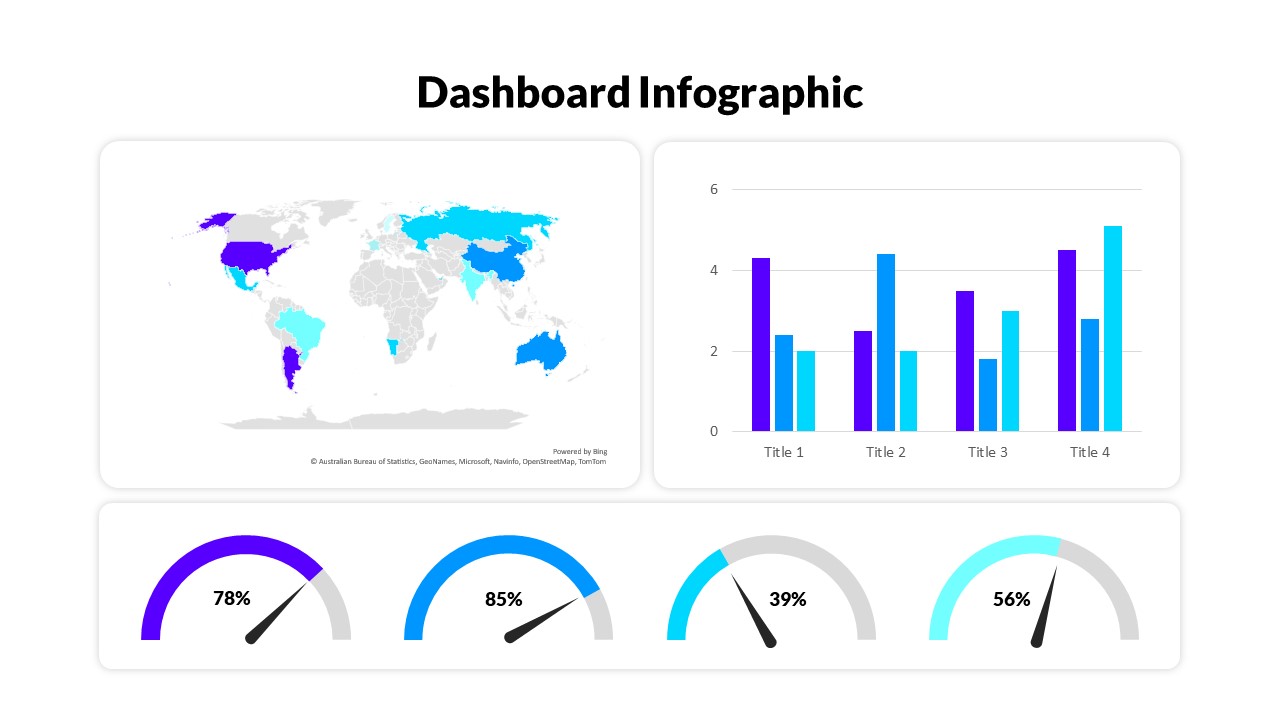
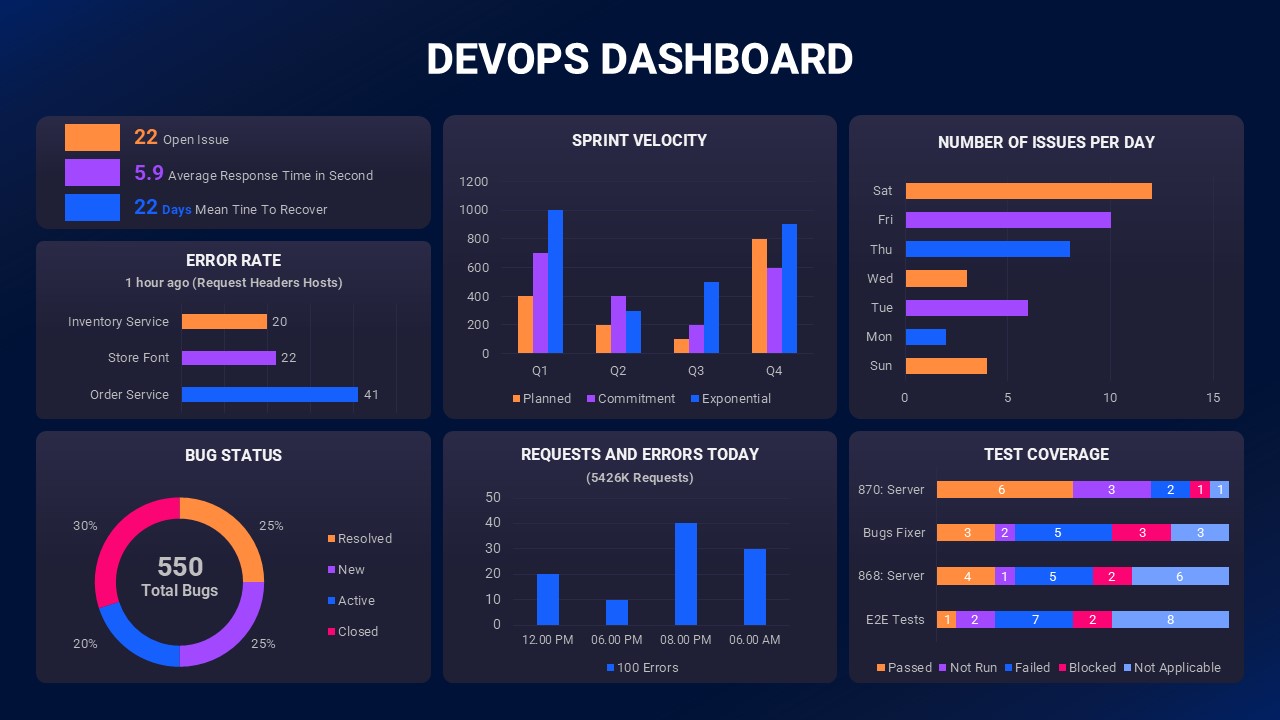
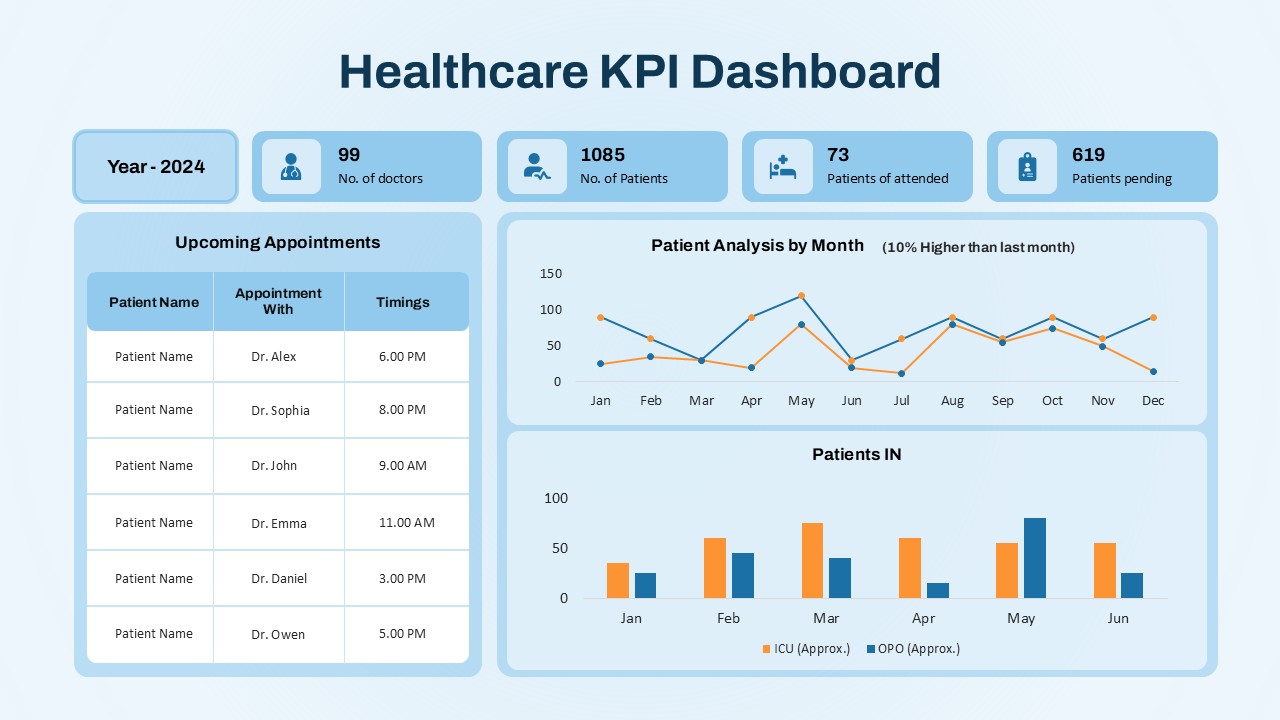
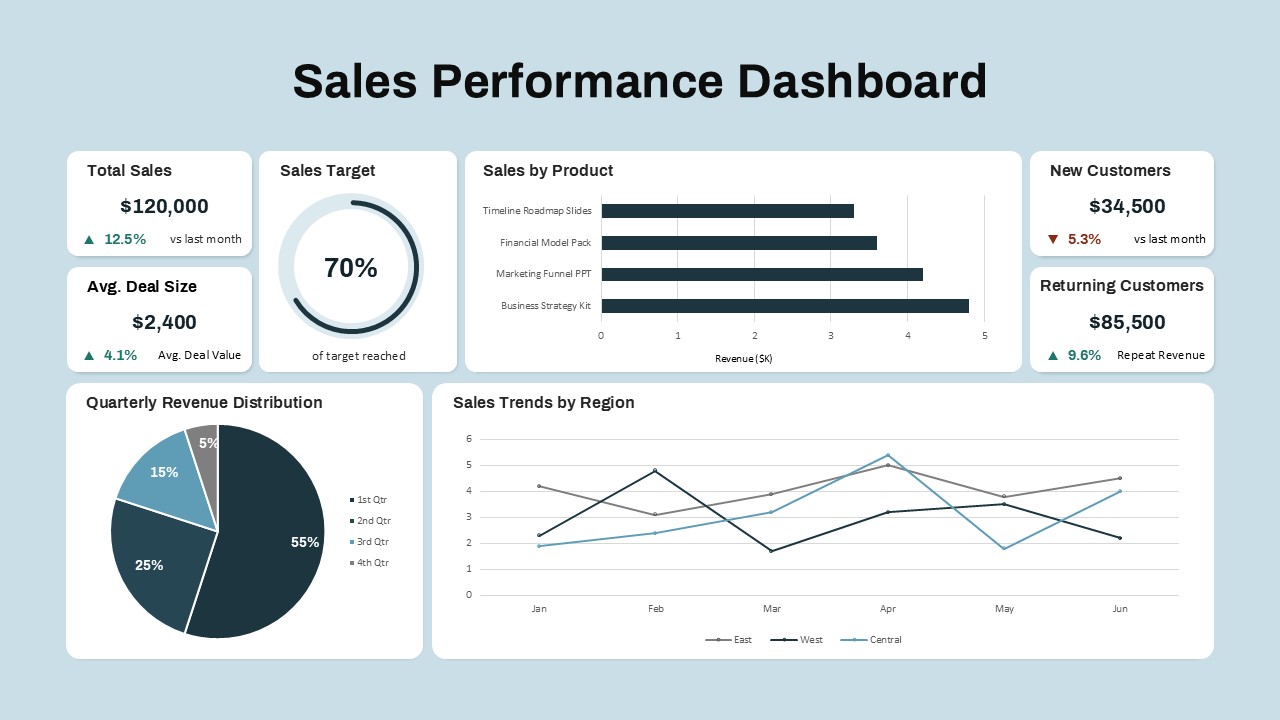
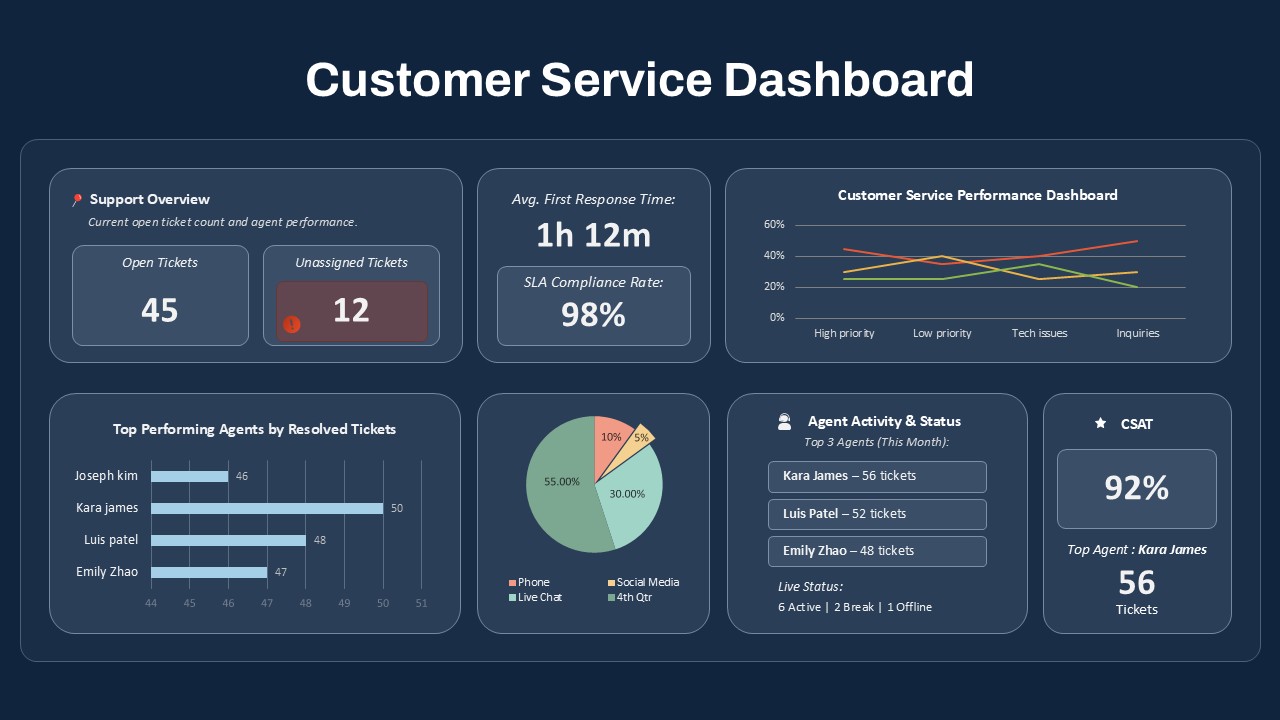
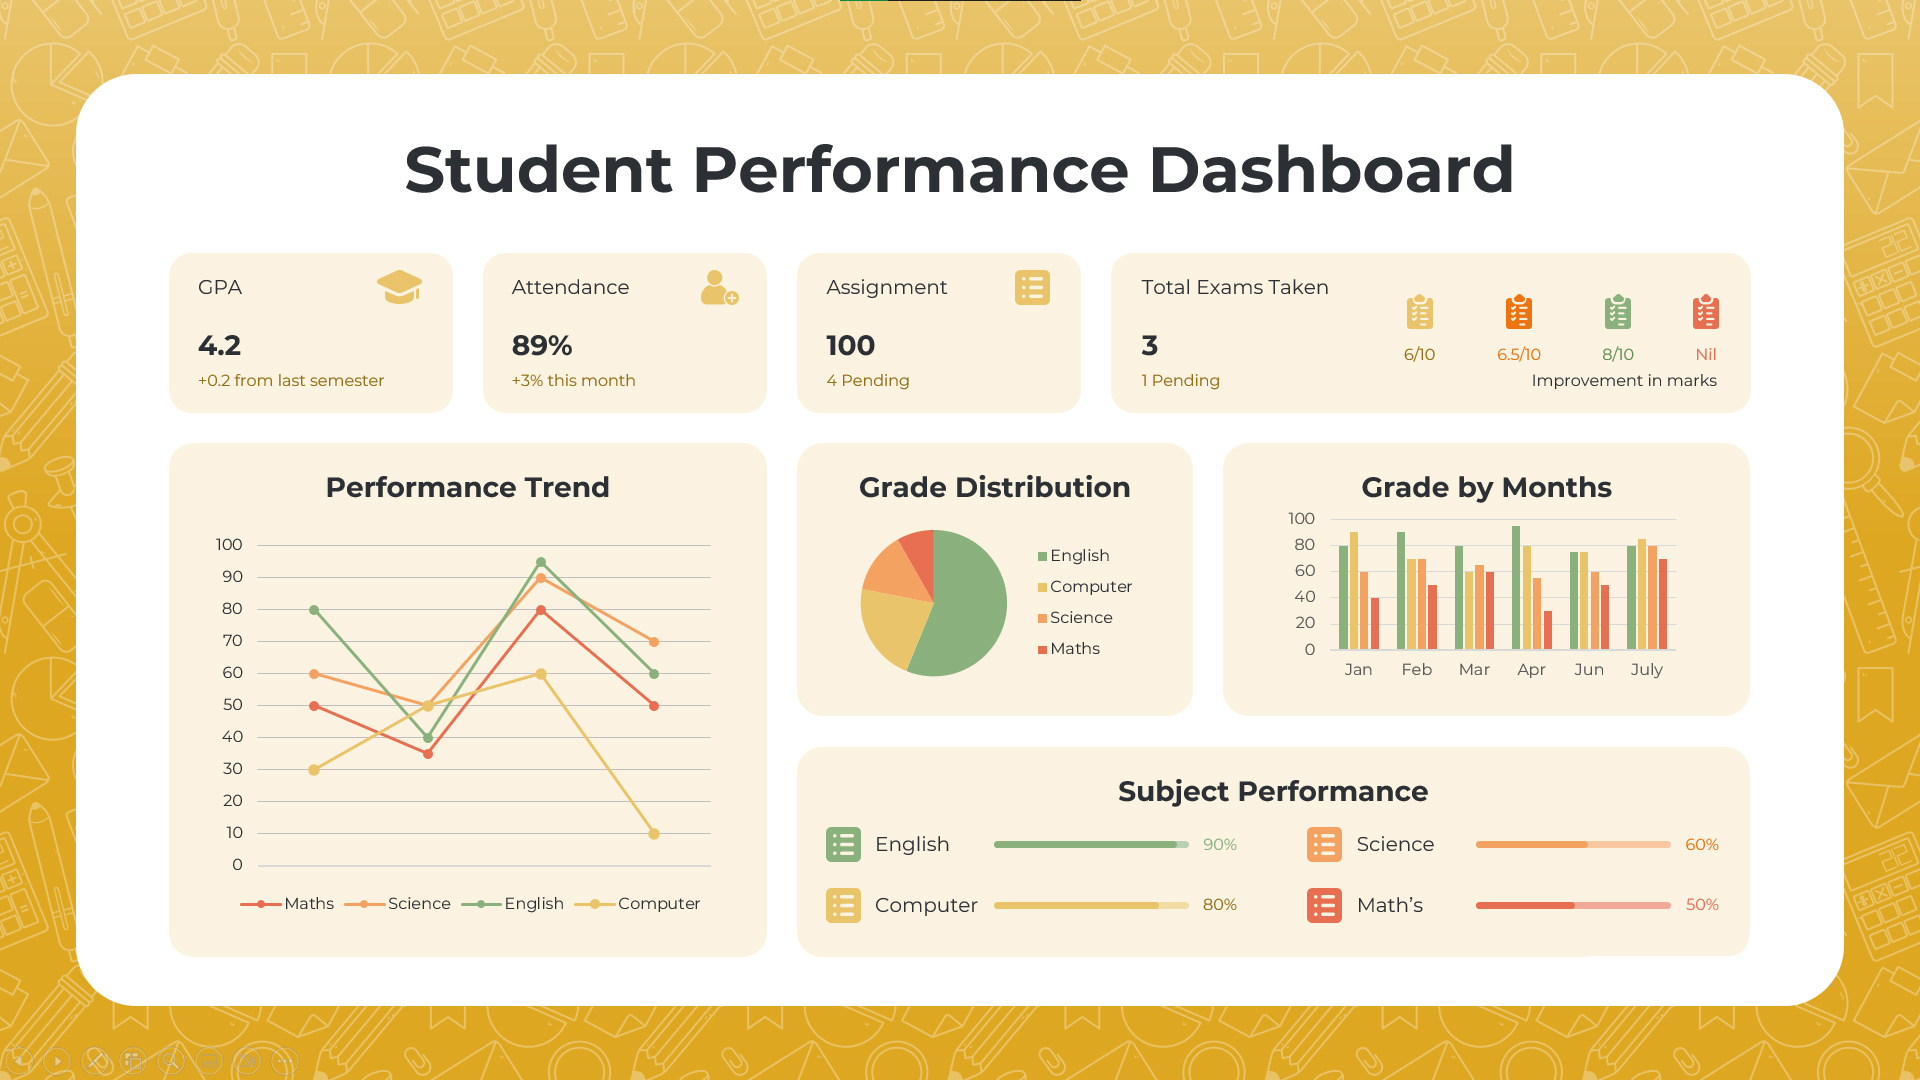
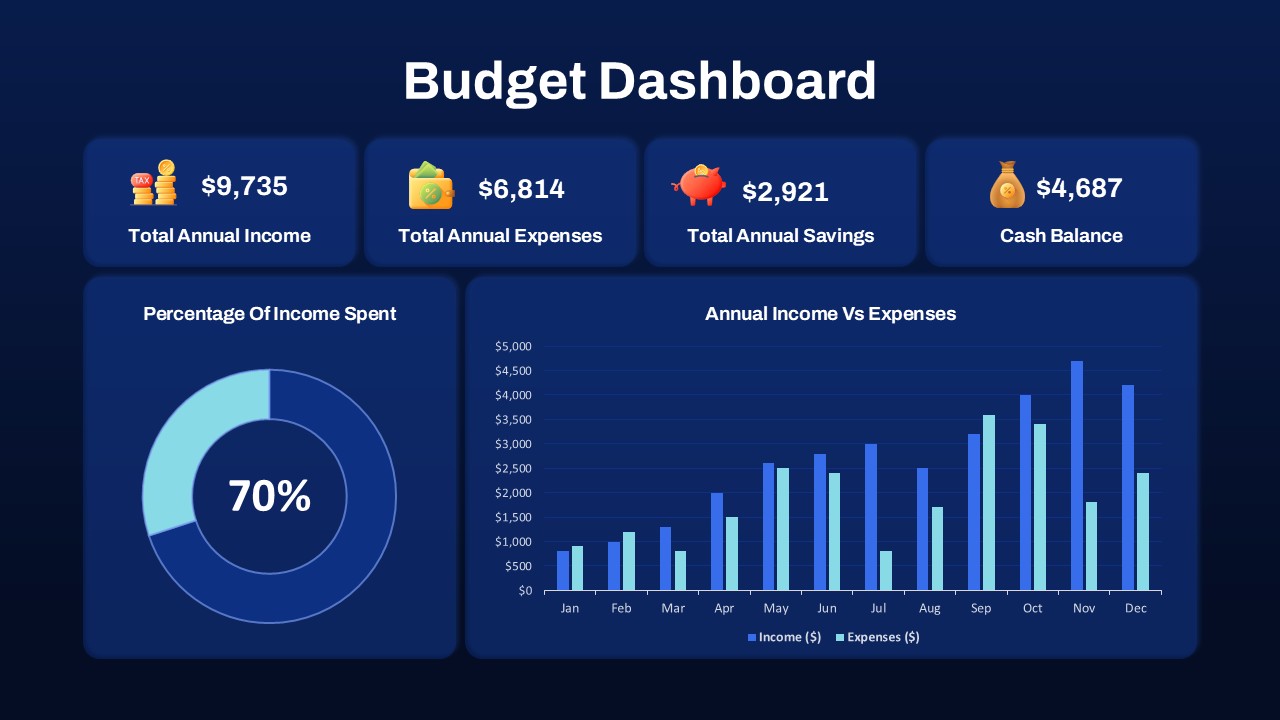
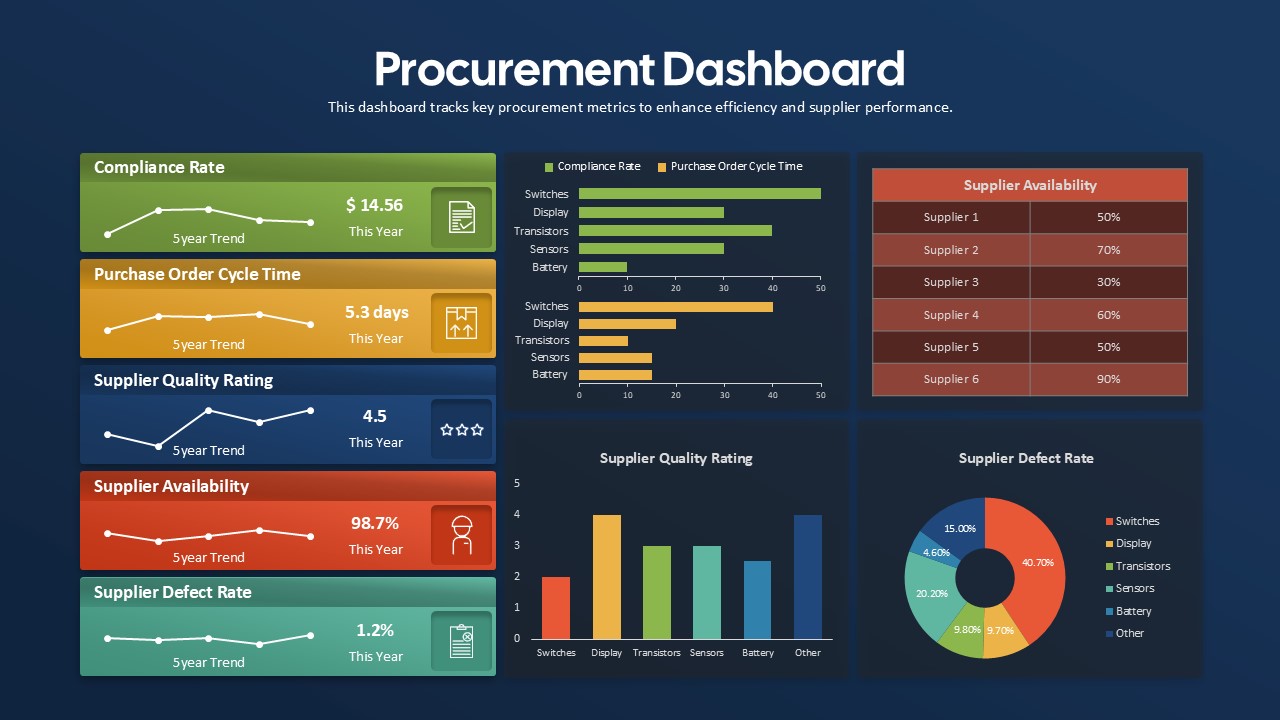
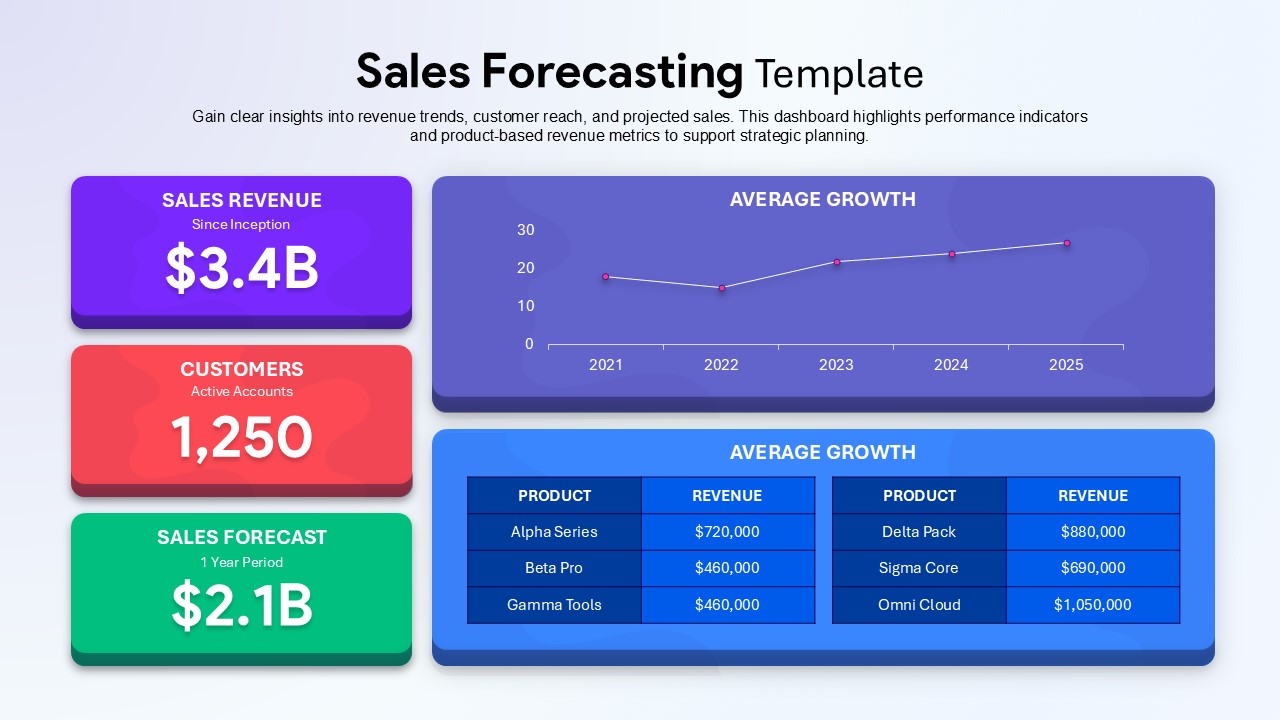
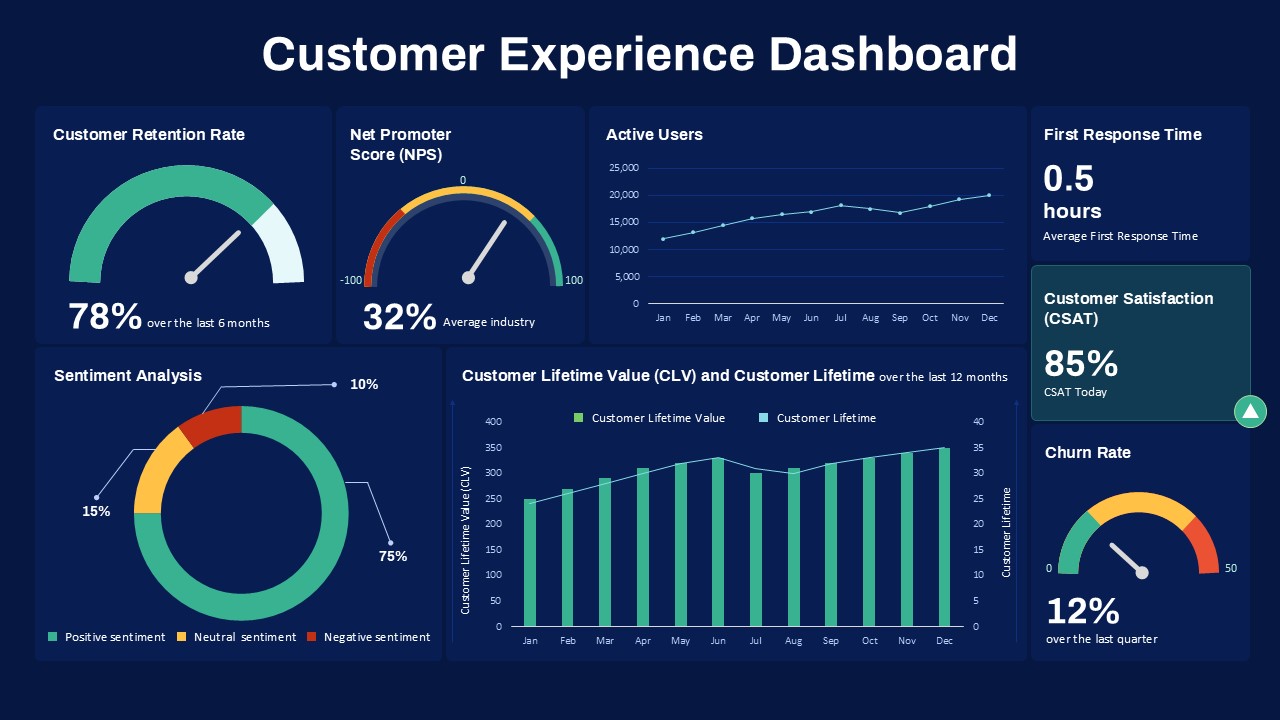
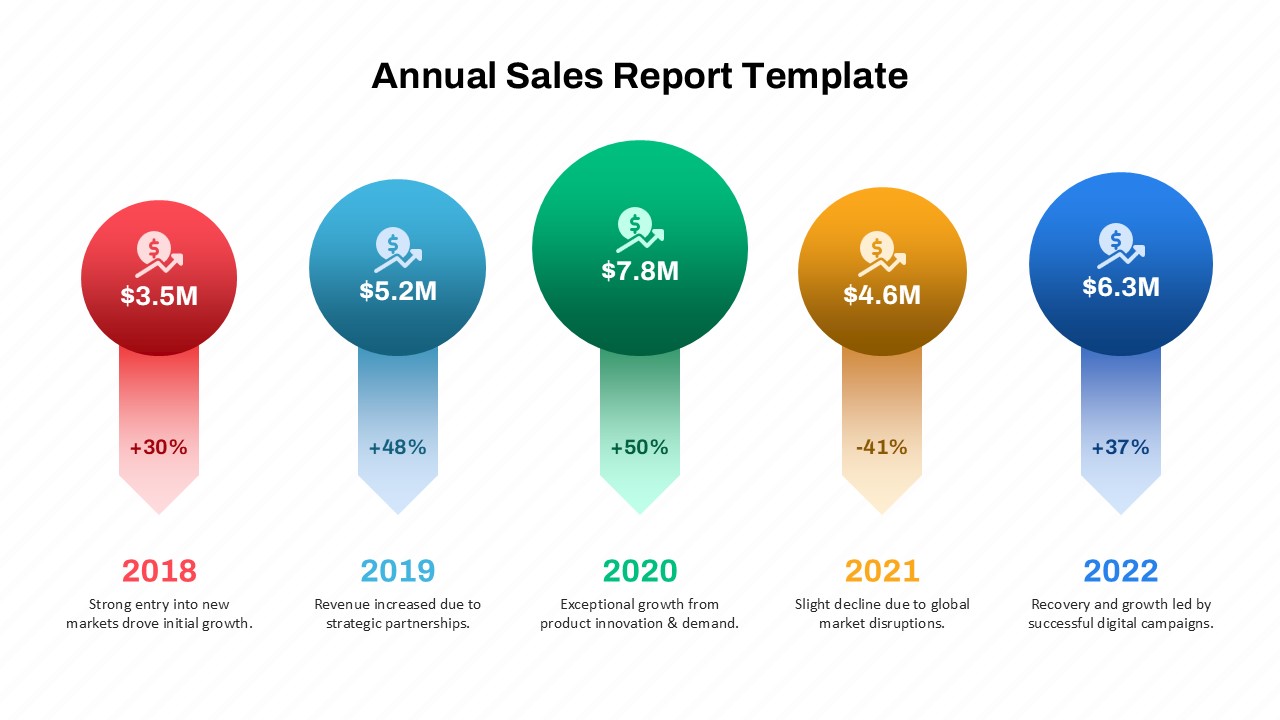
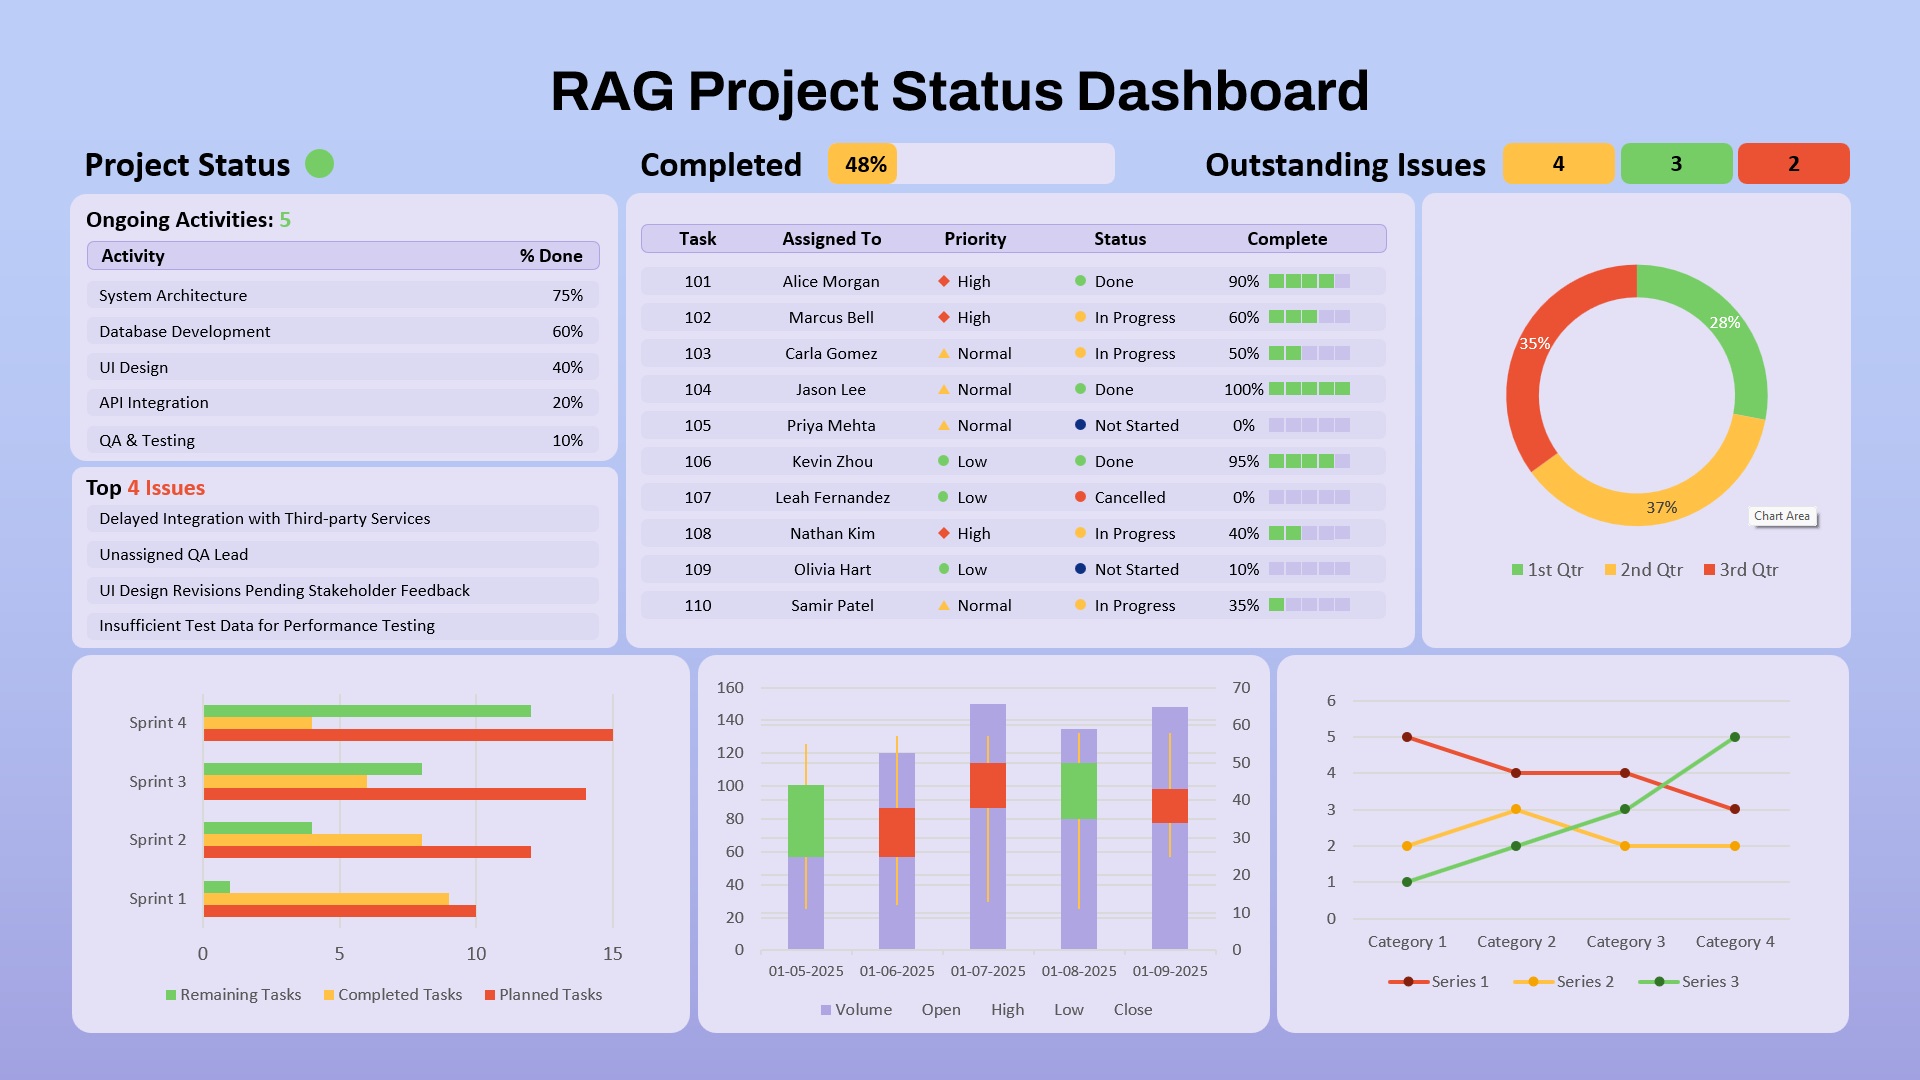
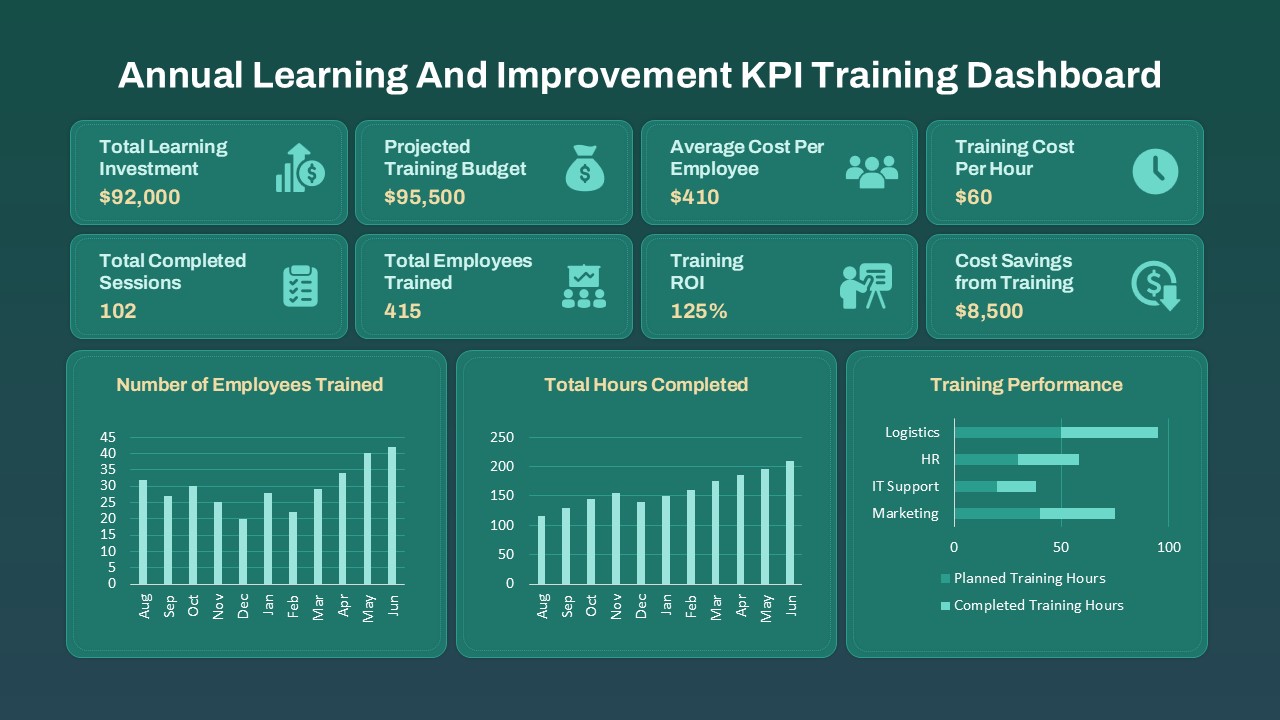
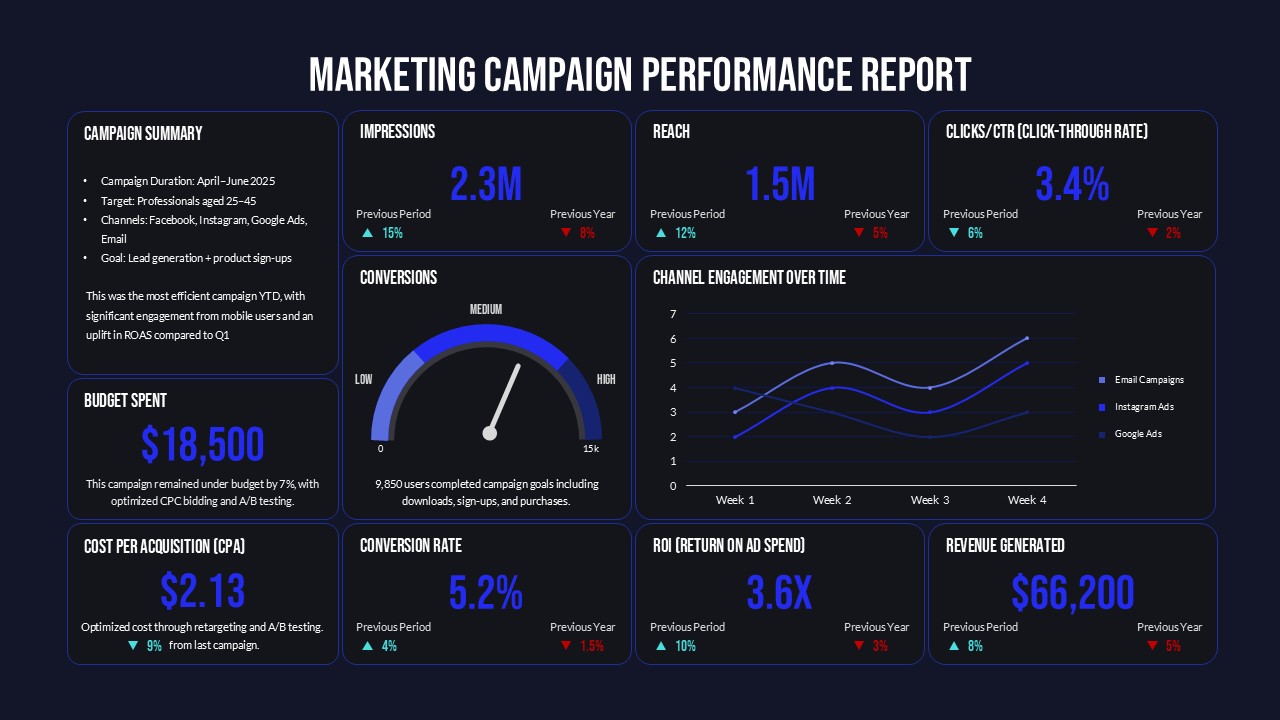
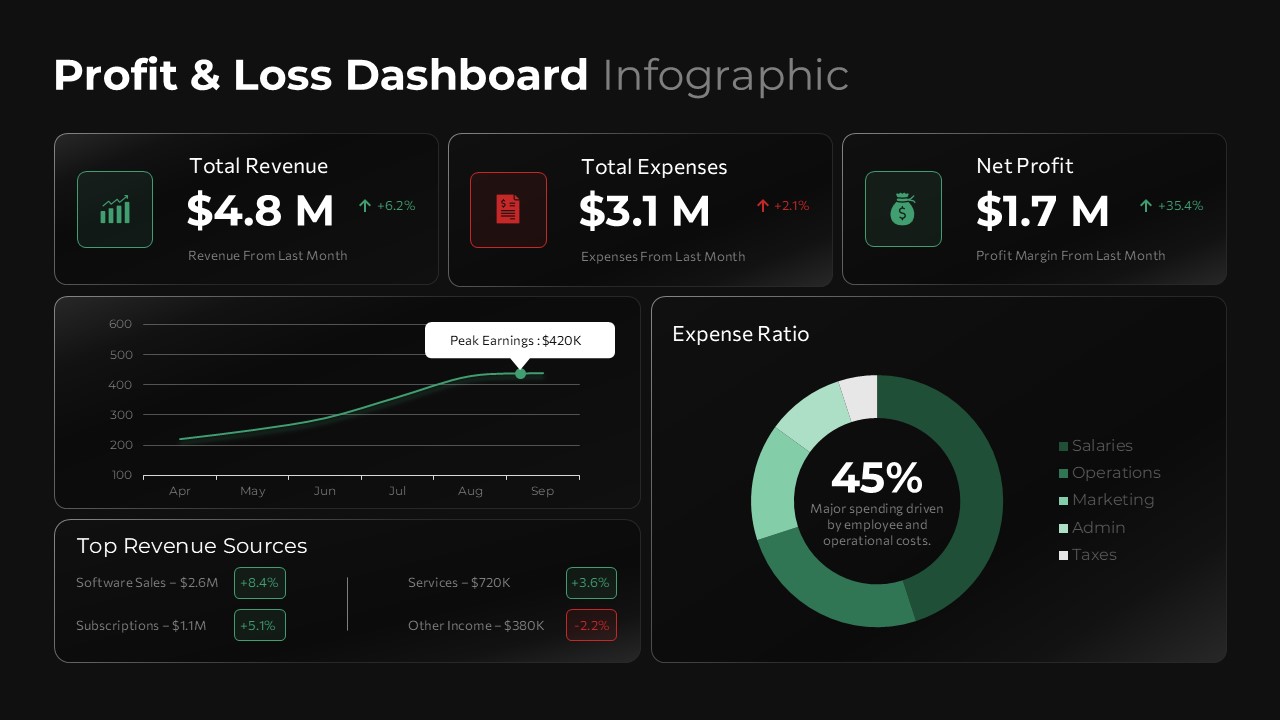
The dashboard highlights essential financial metrics such as Total Revenue, Total Expenses, and Net Profit, allowing presenters to showcase key performance indicators at a glance. Large data cards with percentage change indicators help emphasize growth trends, cost variations, and profitability improvements, making financial storytelling more engaging and actionable.
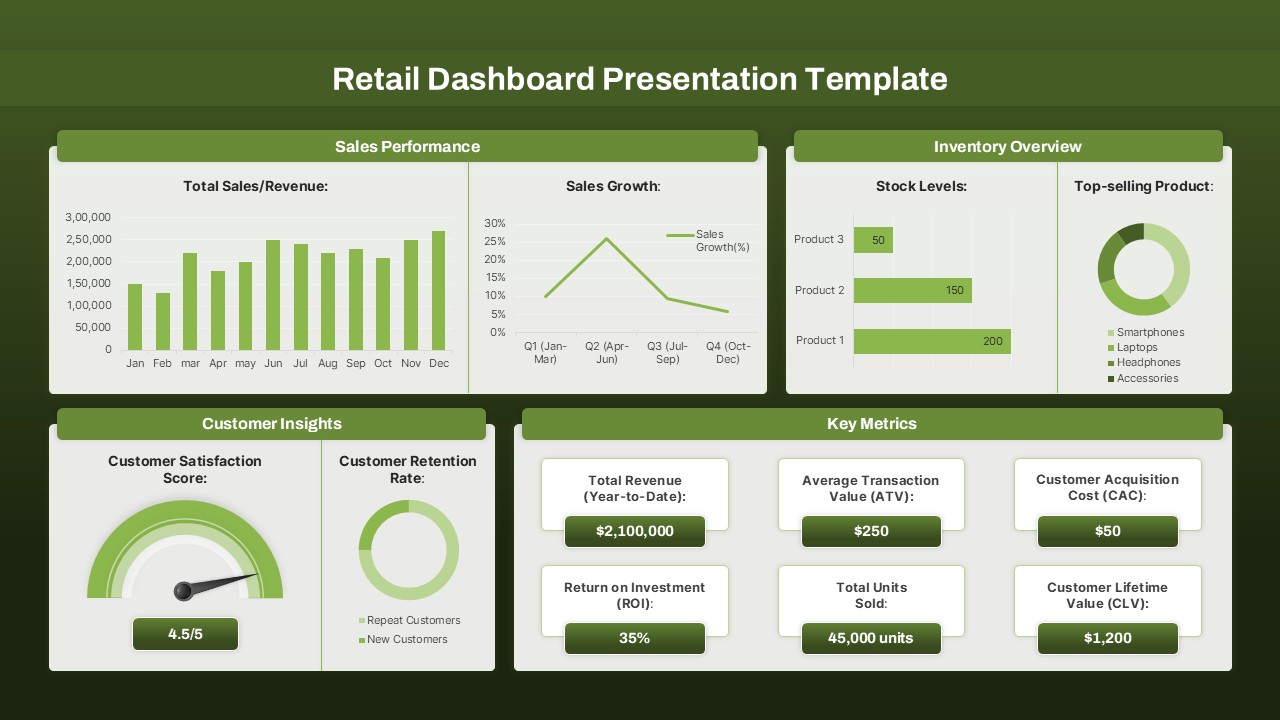
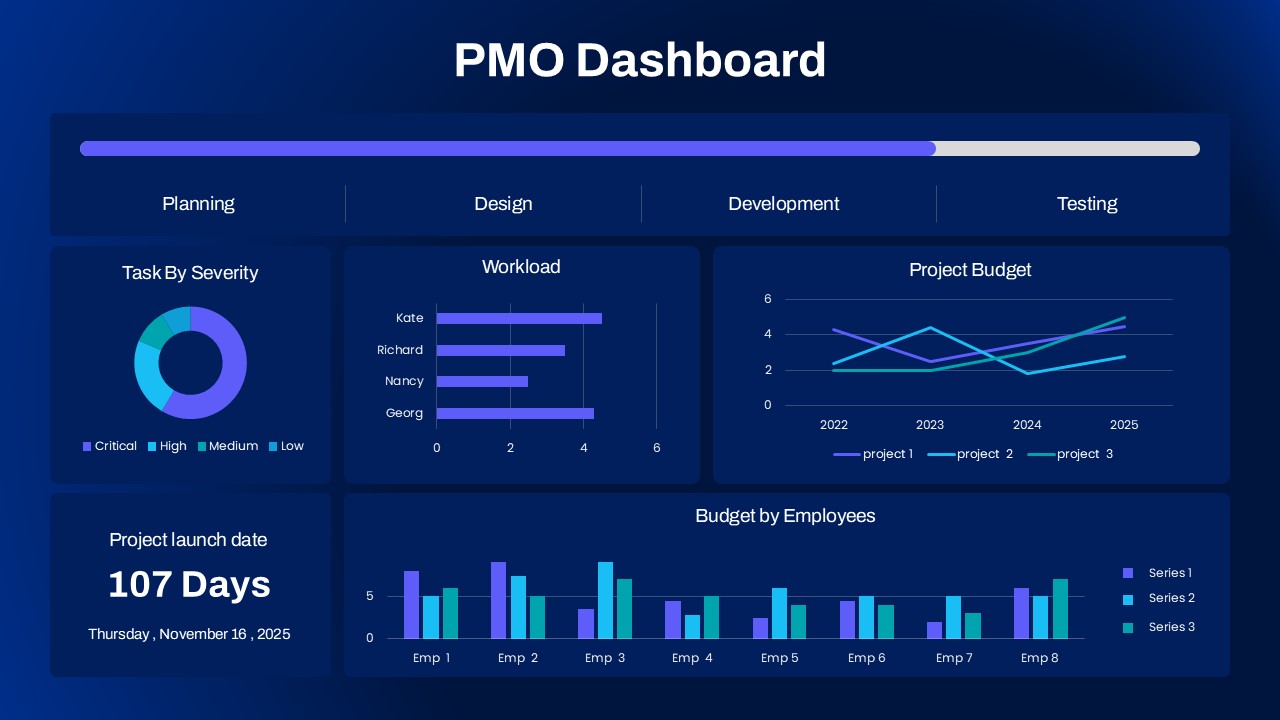
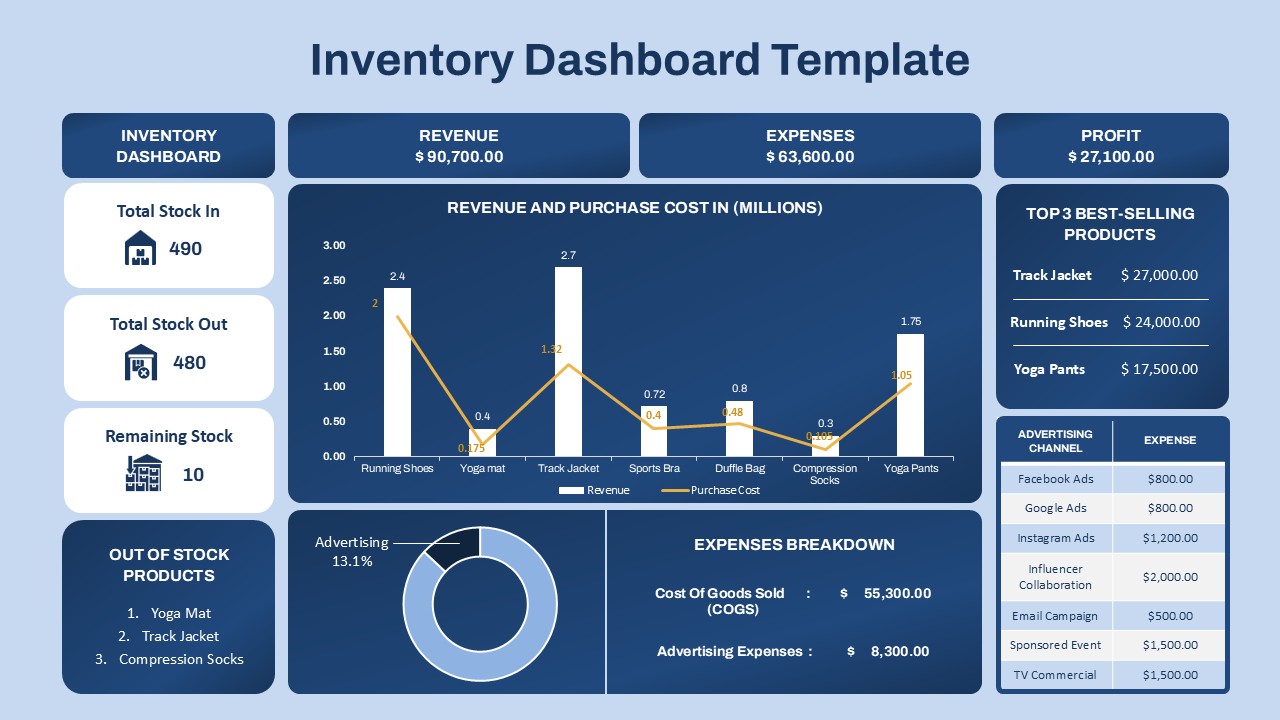
A dynamic revenue trend chart provides a clear view of performance over time, enabling users to demonstrate revenue growth, seasonal trends, or business milestones. The template also includes a visually appealing expense ratio donut chart, making it easy to break down operational costs across categories such as salaries, operations, marketing, administration, and taxes. These visual elements help audiences quickly understand financial distribution and spending priorities.
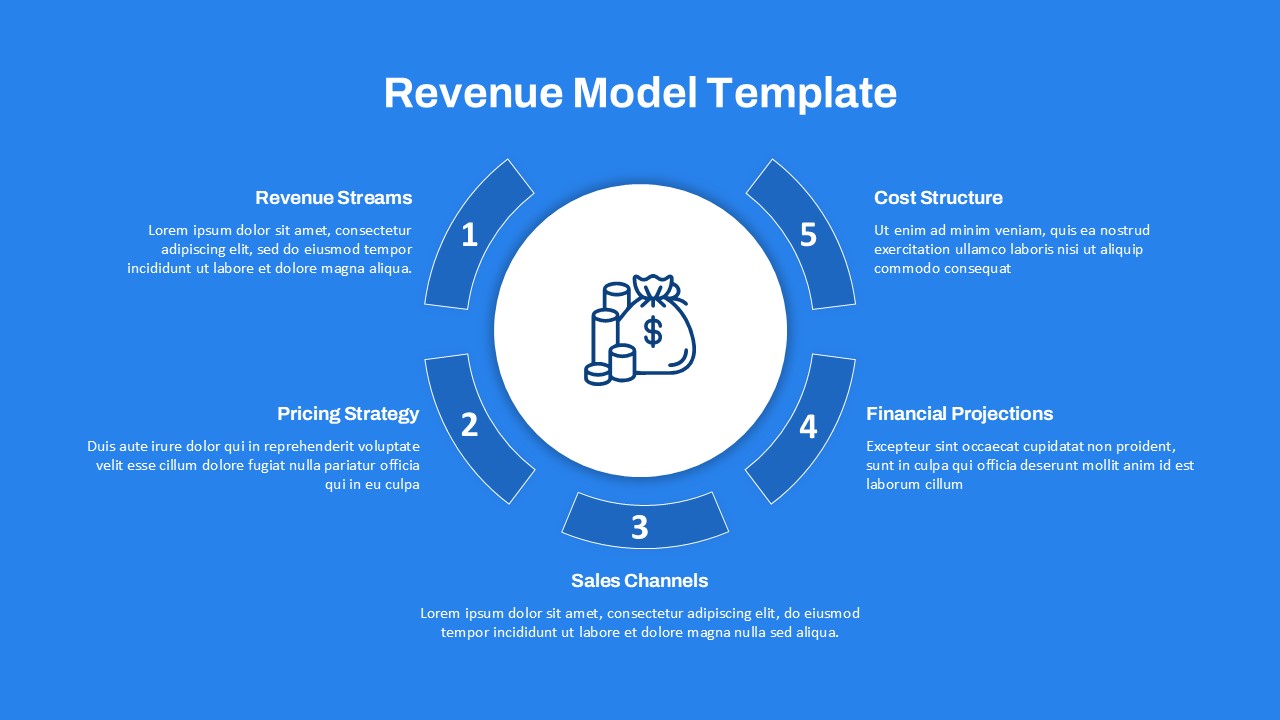
Additionally, the Top Revenue Sources section allows organizations to highlight their most profitable products, services, subscriptions, or business segments. This feature is particularly useful for identifying growth opportunities and presenting revenue diversification strategies to management teams, investors, or clients.
Designed for both PowerPoint and Google Slides, the template is fully editable, allowing users to customize charts, figures, colors, labels, and categories to match their specific reporting requirements. Whether you are presenting monthly financial results, quarterly business reviews, annual reports, startup performance metrics, or corporate financial summaries, this dashboard provides a polished and data-driven framework that enhances communication and decision-making.
With its clean design, professional analytics layout, and focus on financial insights, the Profit & Loss Dashboard Infographic Template helps organizations present financial data with confidence, accuracy, and visual appeal.
See more

Aspect Ratio
16:9Item ID
SKT04550
Features of this template
Other User Cases of the Template
Financial Performance Reports, Monthly Business Reviews, Quarterly Earnings Presentations, Annual Financial Reports, Executive Dashboards, CFO Presentations, Budget Analysis Reports, Expense Tracking Dashboards, Startup Investor Updates, Revenue Growth Analysis, Management Reporting, Business Intelligence Presentations, KPI Tracking Reports, Corporate Strategy Meetings, Operational Performance Reviews, Sales Revenue Analysis, Financial Planning Presentations, Board Meeting Reports, Cost Management Analysis, Business Performance Monitoring
FAQs
You May Also Like These Presentation Templates


- Free

- Free
- Free

- Free
- Free

- Free
- Free