Customizable Bubble Chart PowerPoint and Google Slides Template
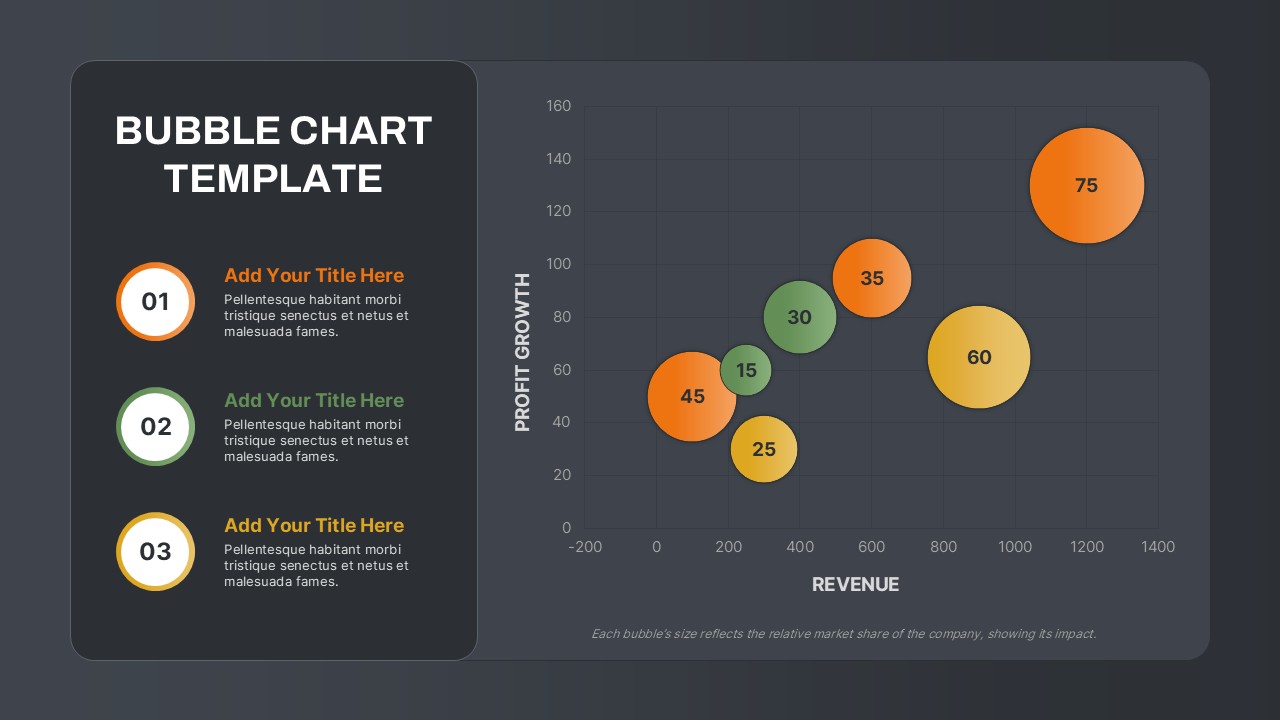
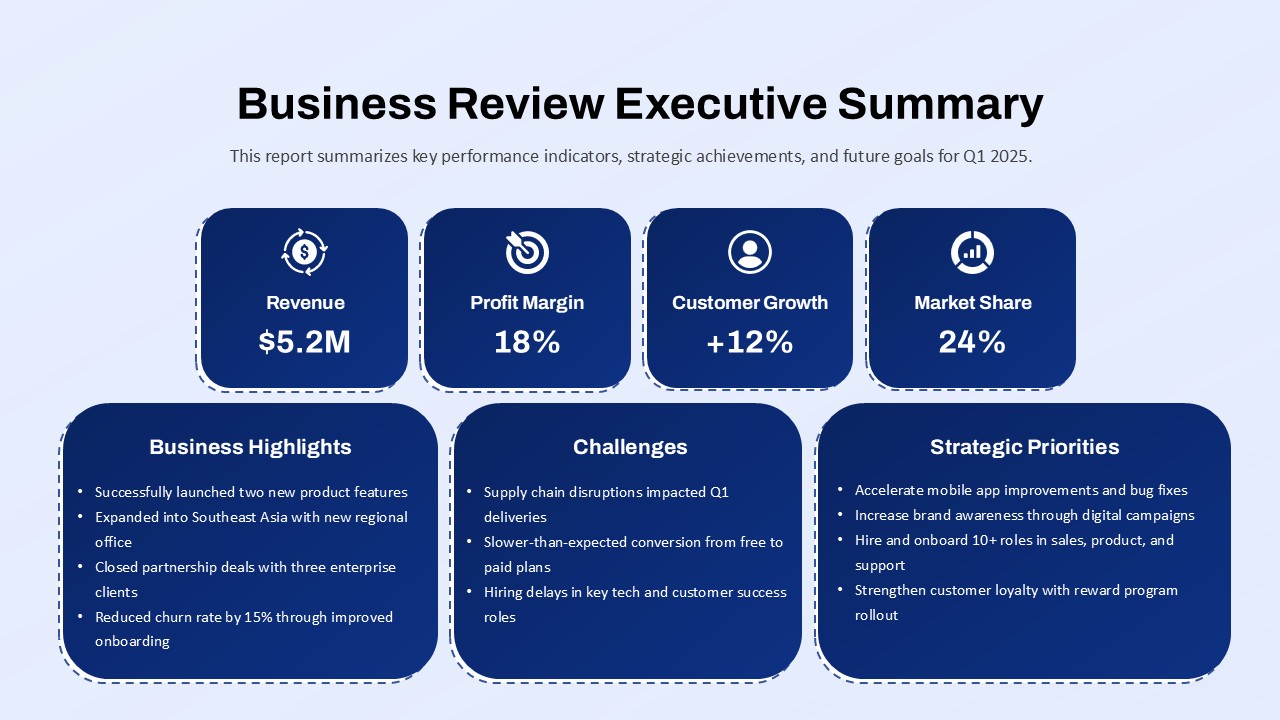
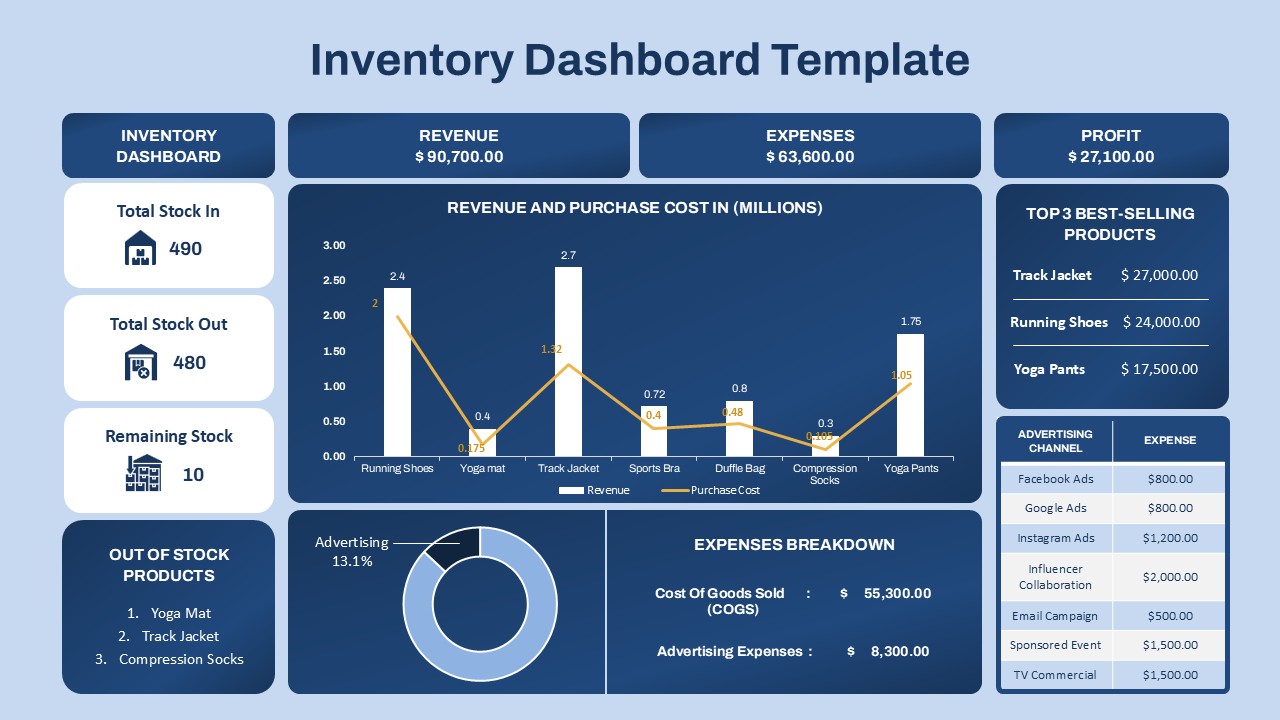
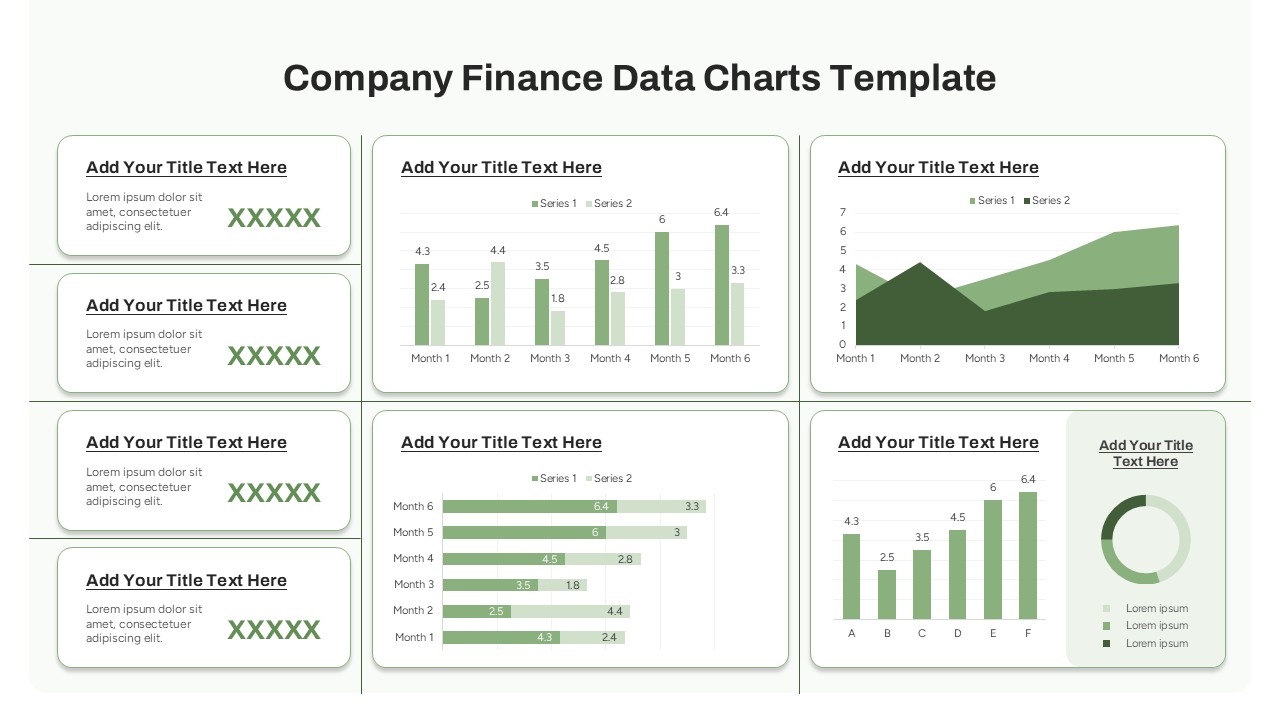
The Bubble Chart PowerPoint Template is designed to visually represent complex data sets in an engaging and easy-to-understand format. Ideal for business professionals, analysts, and teams looking to showcase key metrics and relationships between variables, this template allows for an intuitive presentation of data points that involve three dimensions: revenue, profit growth, and market share.
Key Features:
- Interactive Data Visualization:
The template’s bubble chart allows you to display data in a dynamic manner. Each bubble’s size and position correlate to specific variables, such as revenue, profit growth, and market share, making it easy to compare multiple data points. - Customizable Data Labels:
You can personalize the chart’s labels to reflect key data points relevant to your audience. This flexibility ensures that your presentation accurately represents the metrics that matter most. - Clear Metric Comparison:
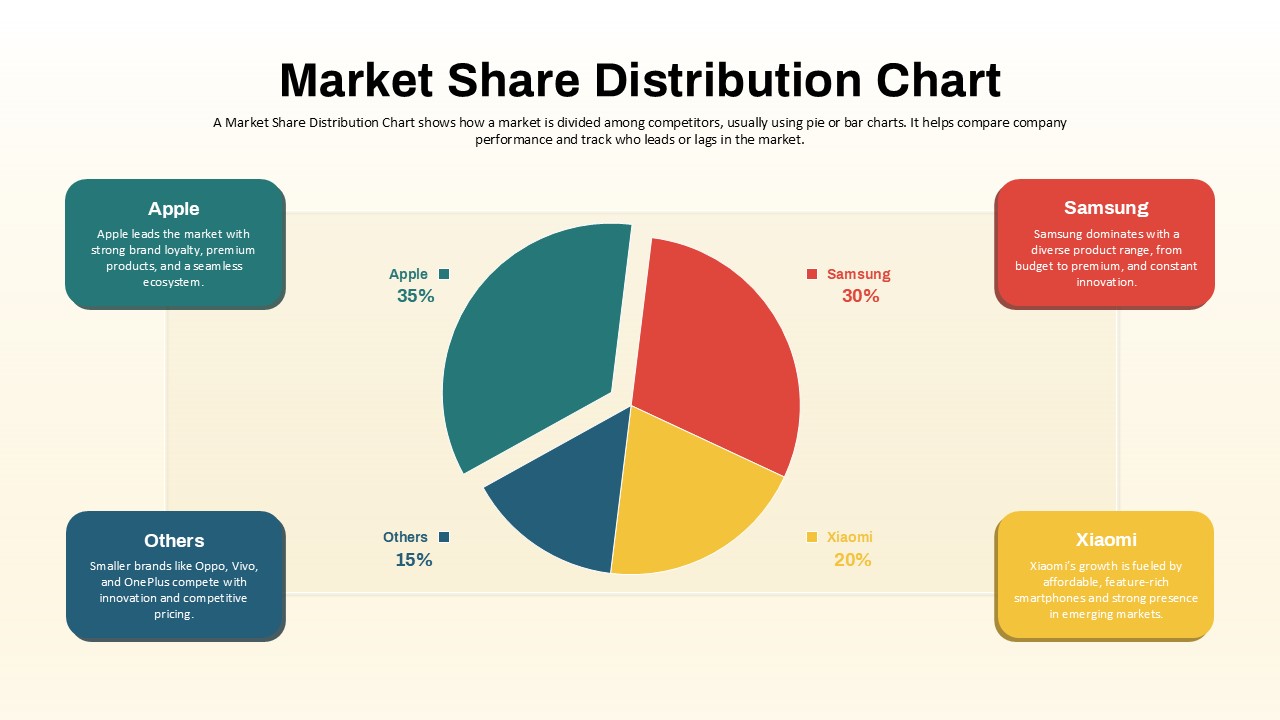
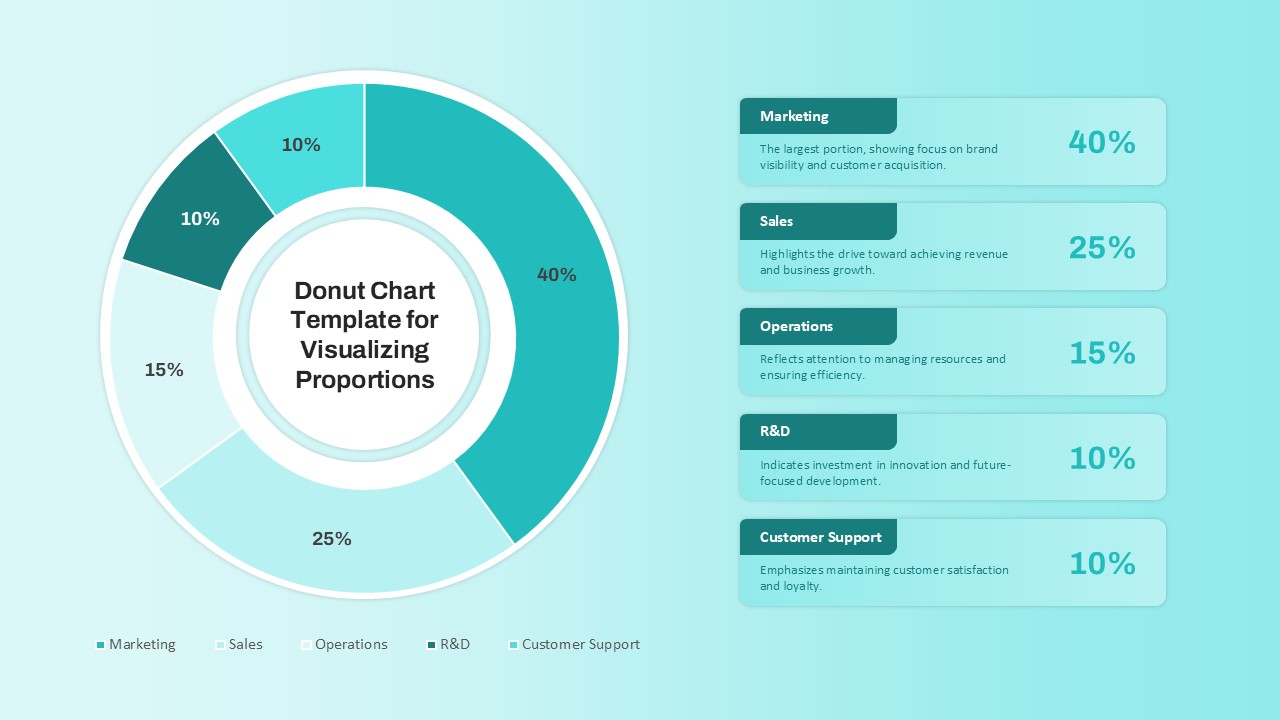
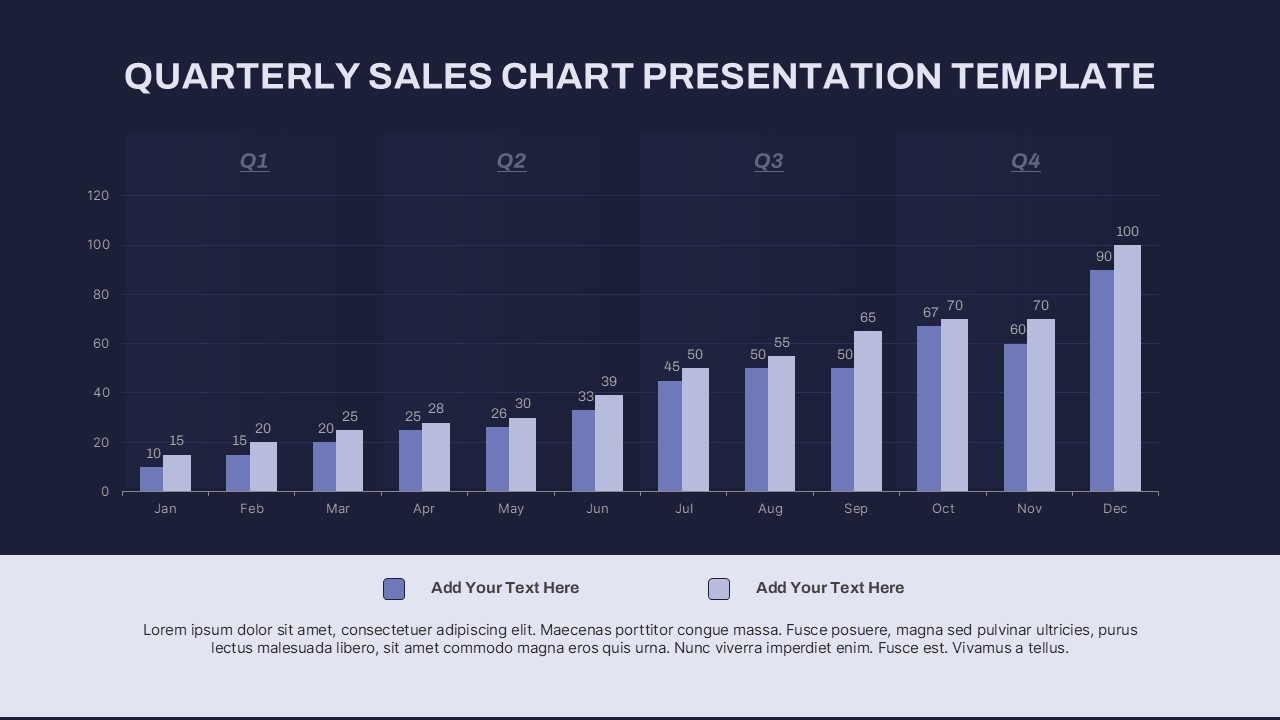
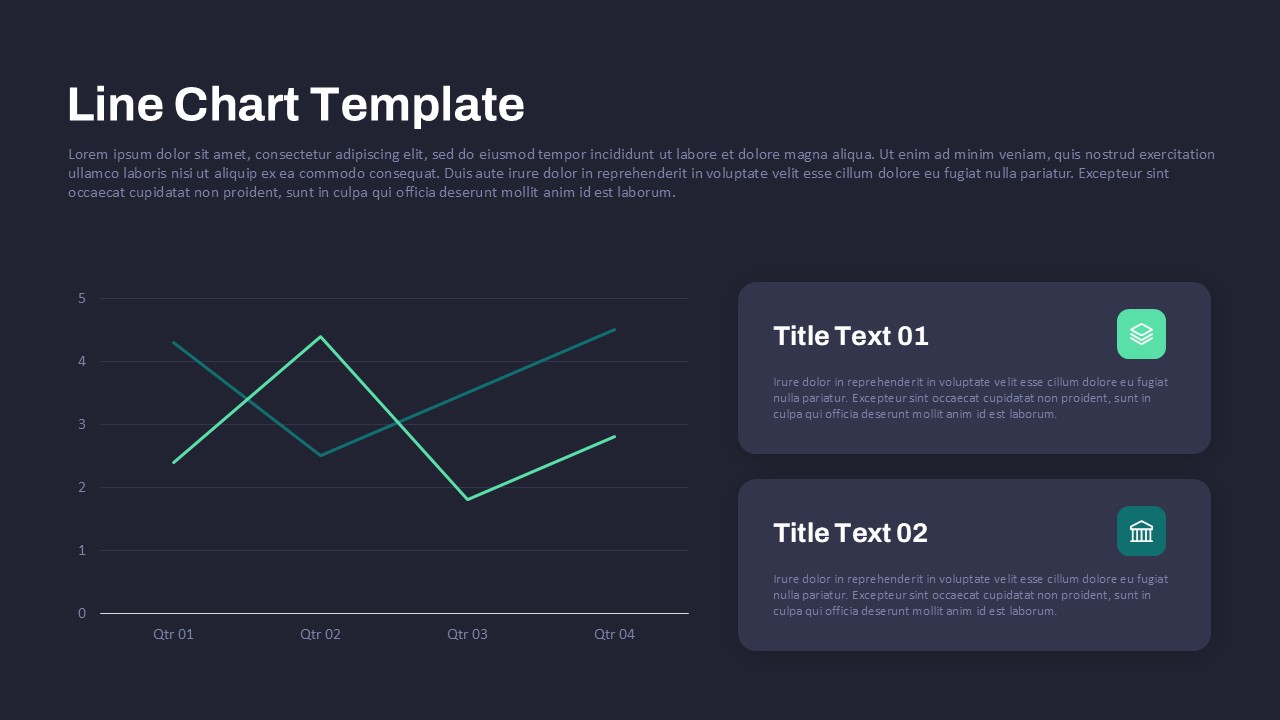
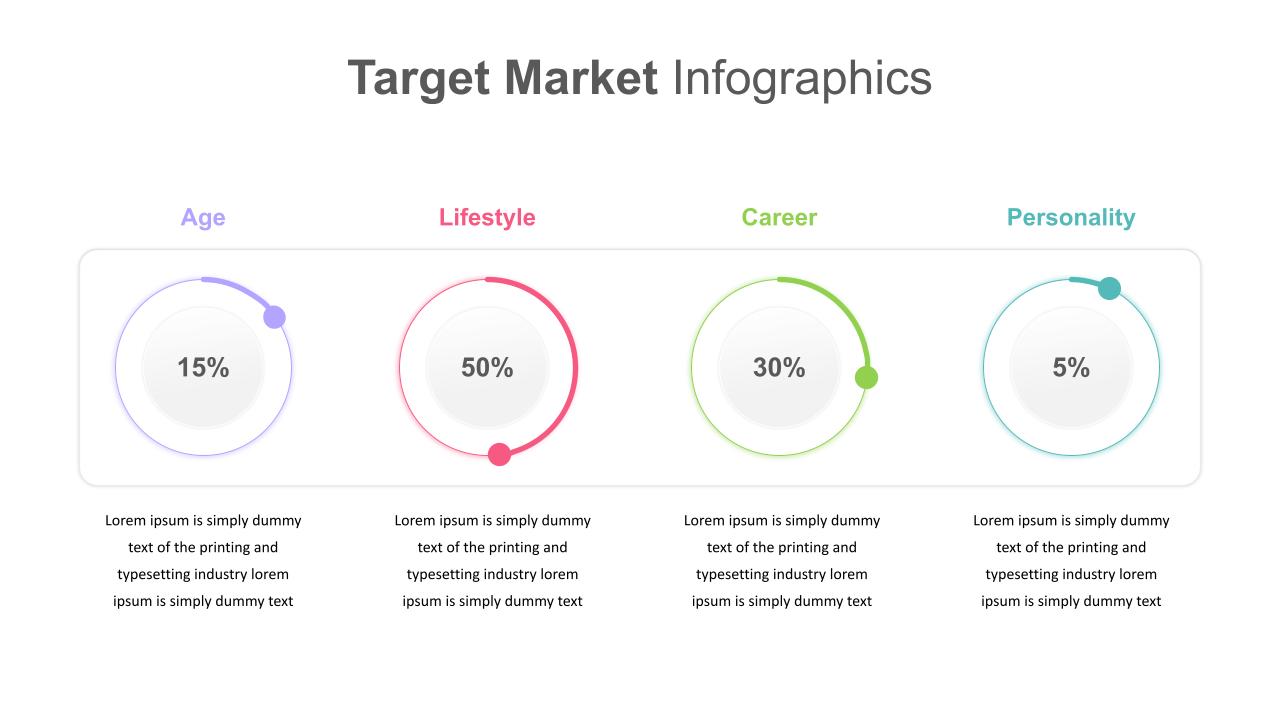
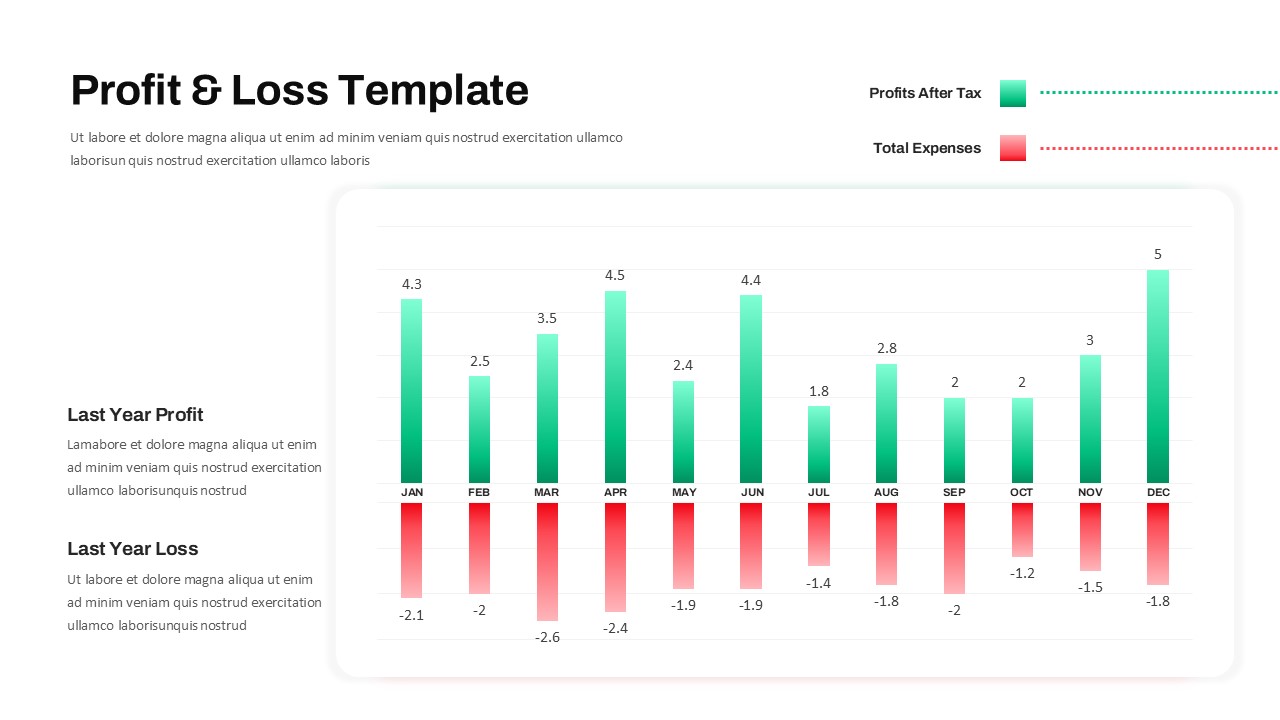
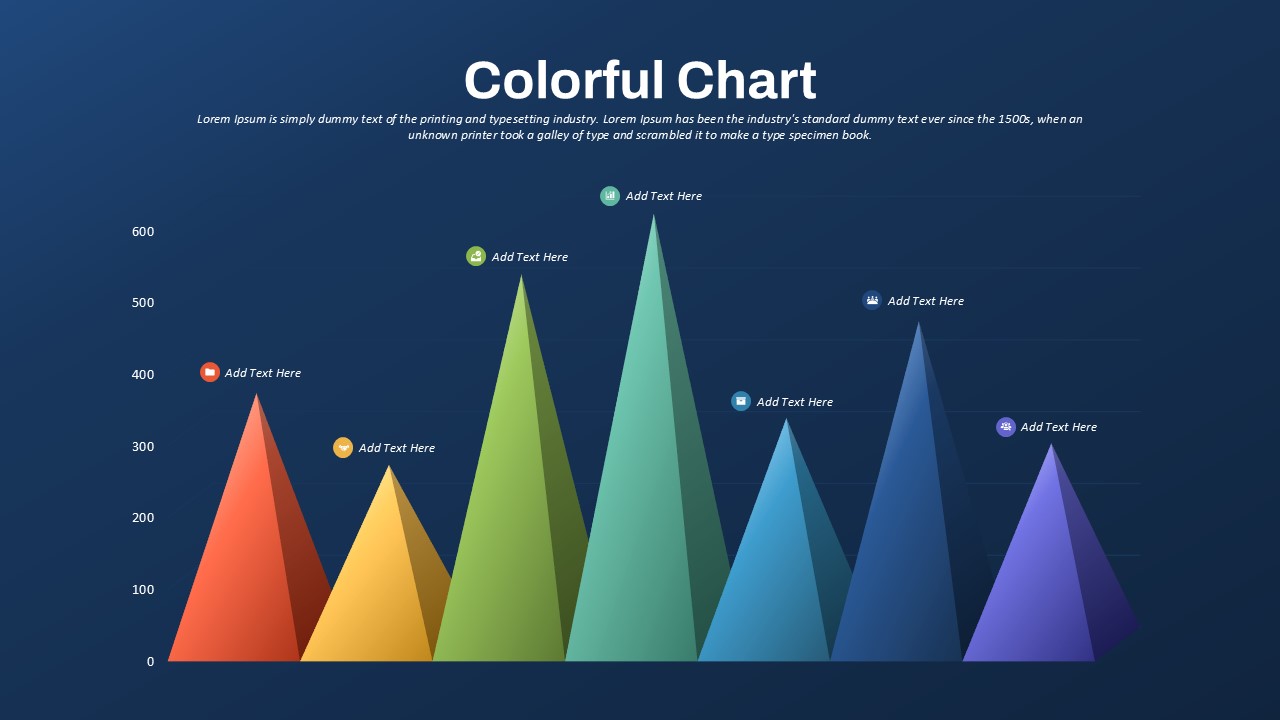
The chart is designed to make comparisons between data sets effortless, with each bubble representing a unique combination of revenue and profit growth. This allows for an at-a-glance understanding of the relationships between business variables. - Visually Appealing Design:
With a modern, dark-themed background and bright, colorful bubbles, this template adds visual appeal to your data presentation, helping capture your audience’s attention and making your insights memorable. - Additional Data Insights:
The template includes a footnote explaining that the size of each bubble reflects the market share, adding depth to the data and offering insight into the impact each data point has.
Why Choose This Template?
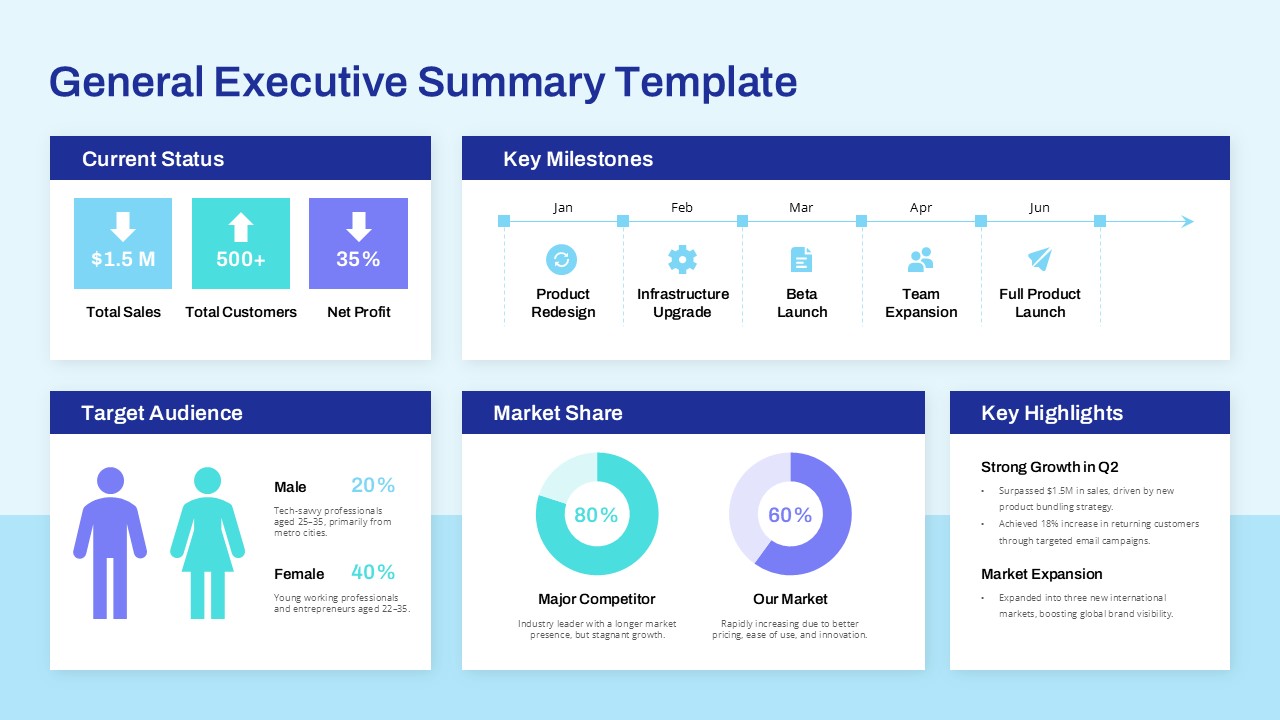
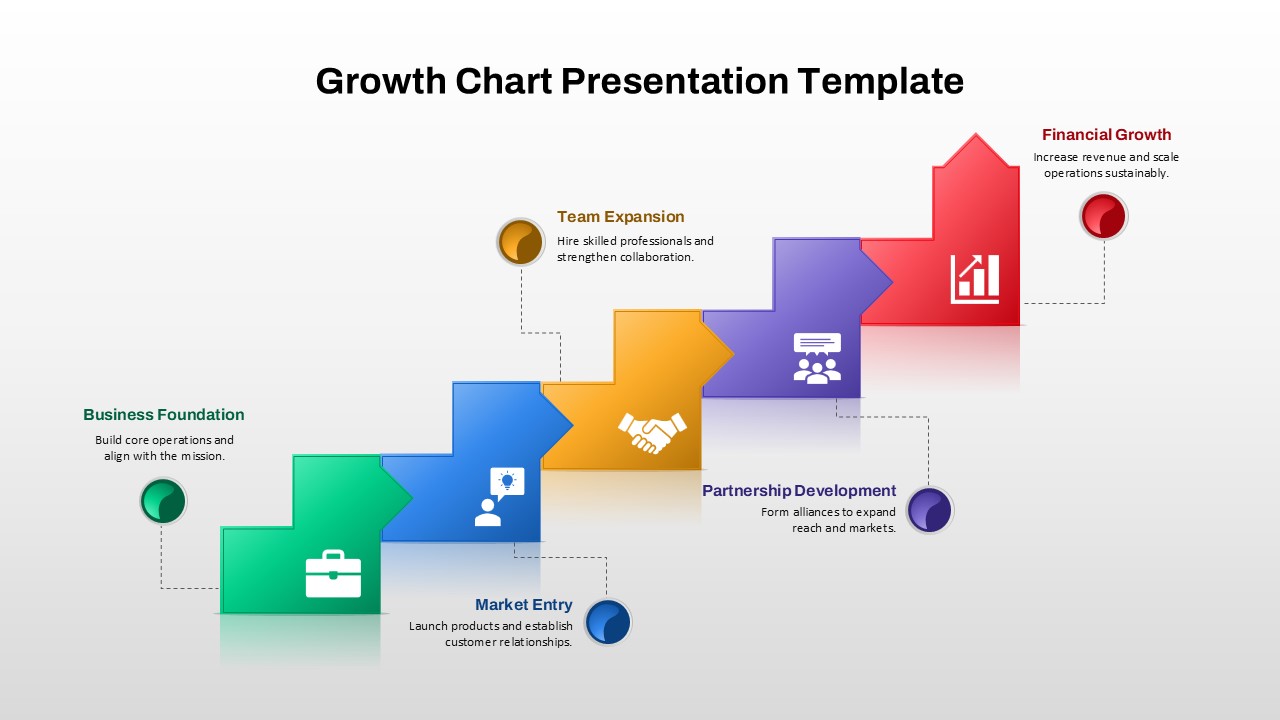
This bubble chart template is perfect for presenting business performance, financial data, and growth trends in a clear and compelling way. Its visually dynamic nature helps break down complex information into digestible insights, making it ideal for decision-making meetings, boardroom discussions, and data-driven presentations.
See more

Aspect Ratio
16:9Item ID
SKT03958
Features of this template
FAQs
You May Also Like These Presentation Templates


- Free
- Free
- Free


- Free
- Free
- Free
- Free