3D Cone Chart Infographic Template
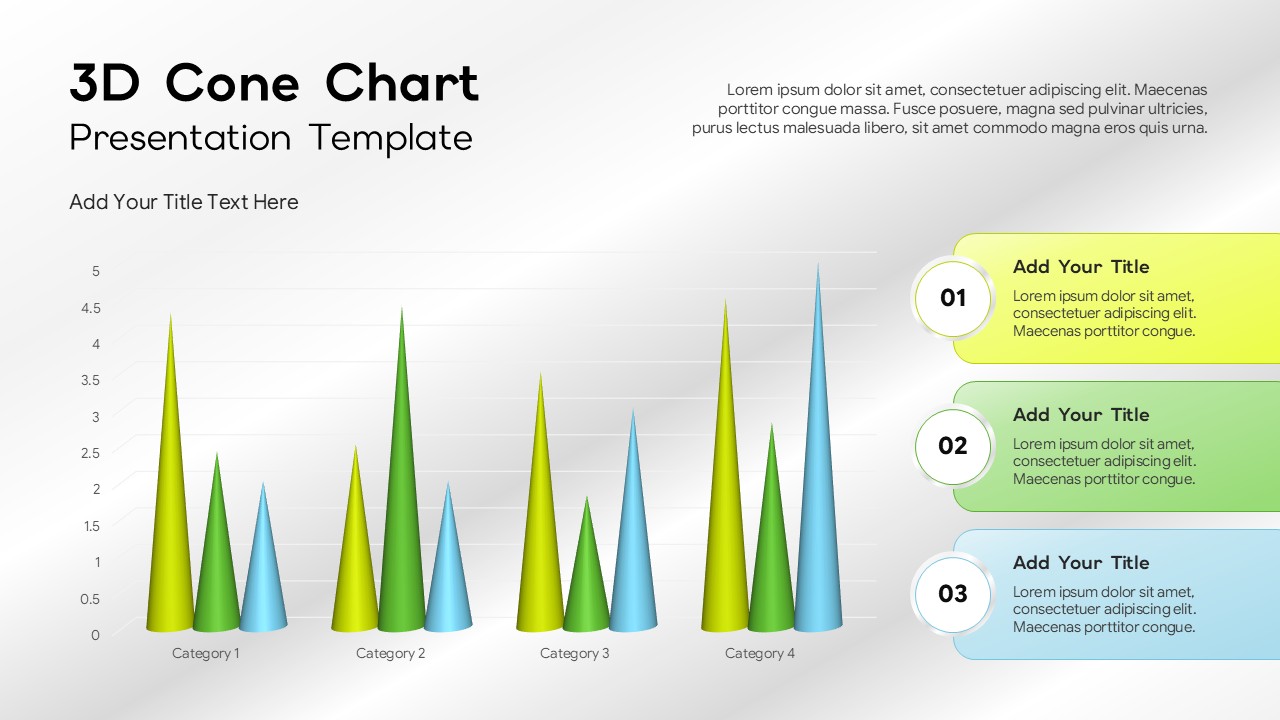
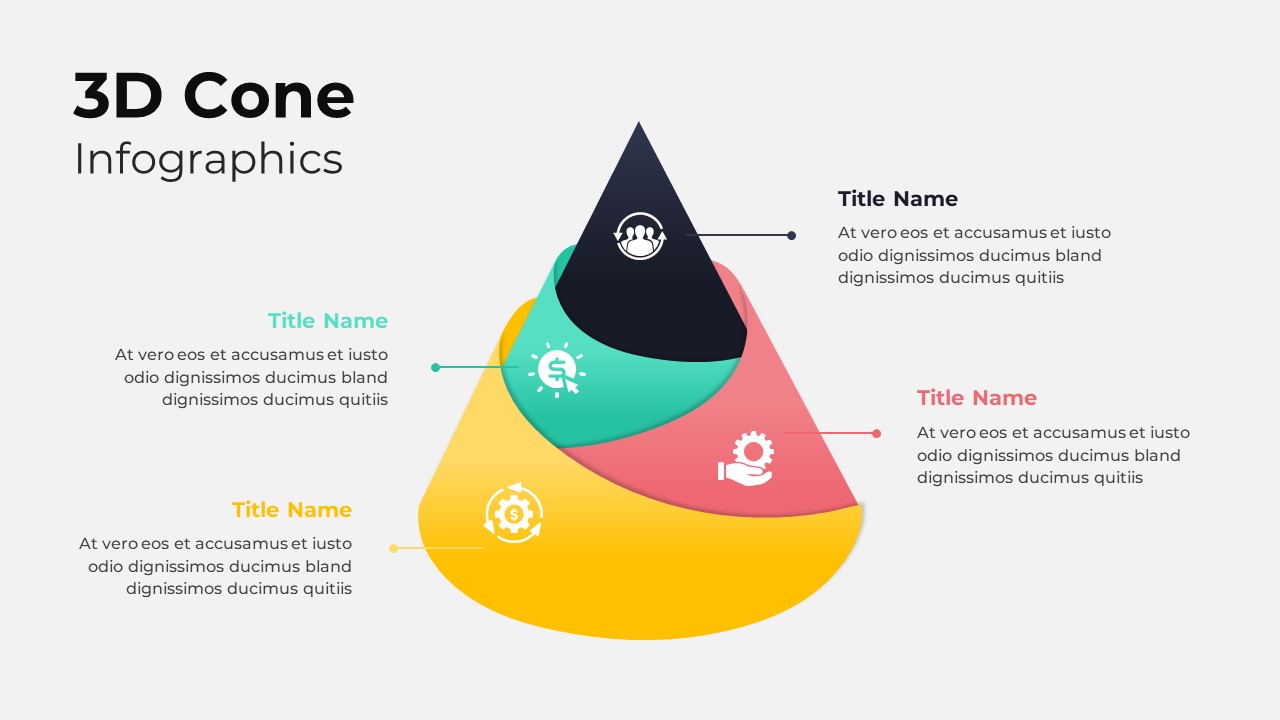
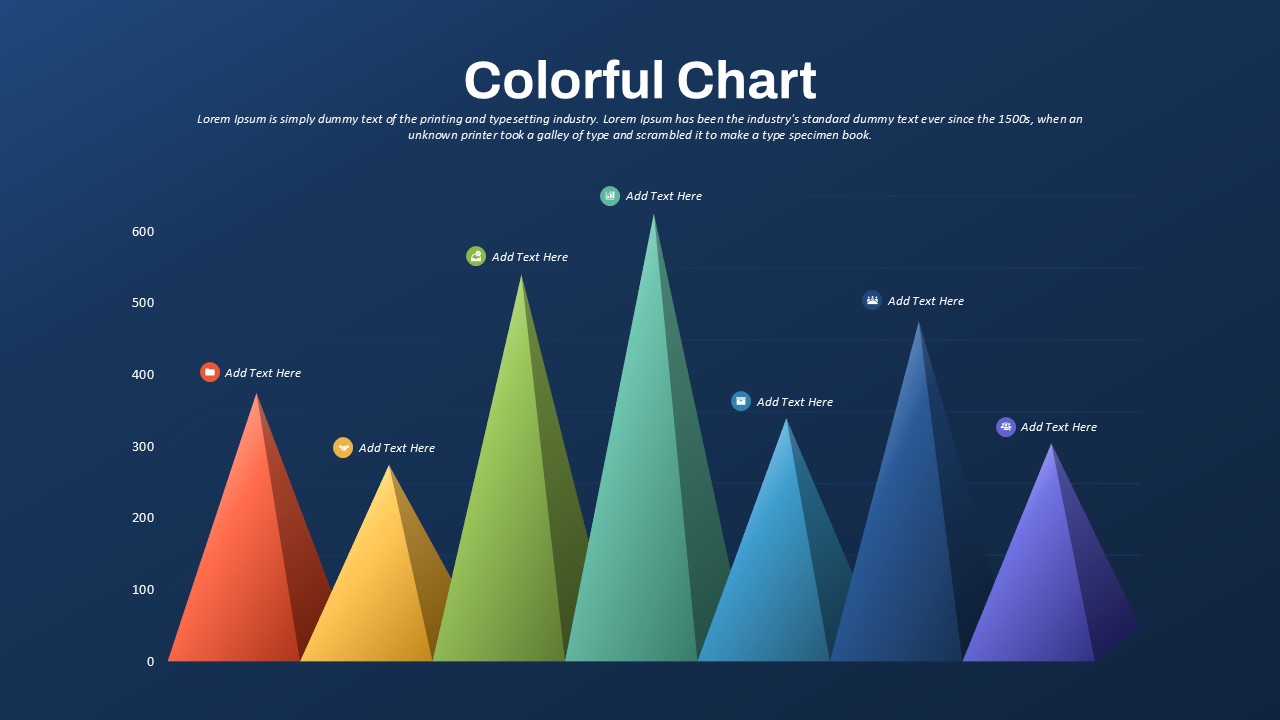
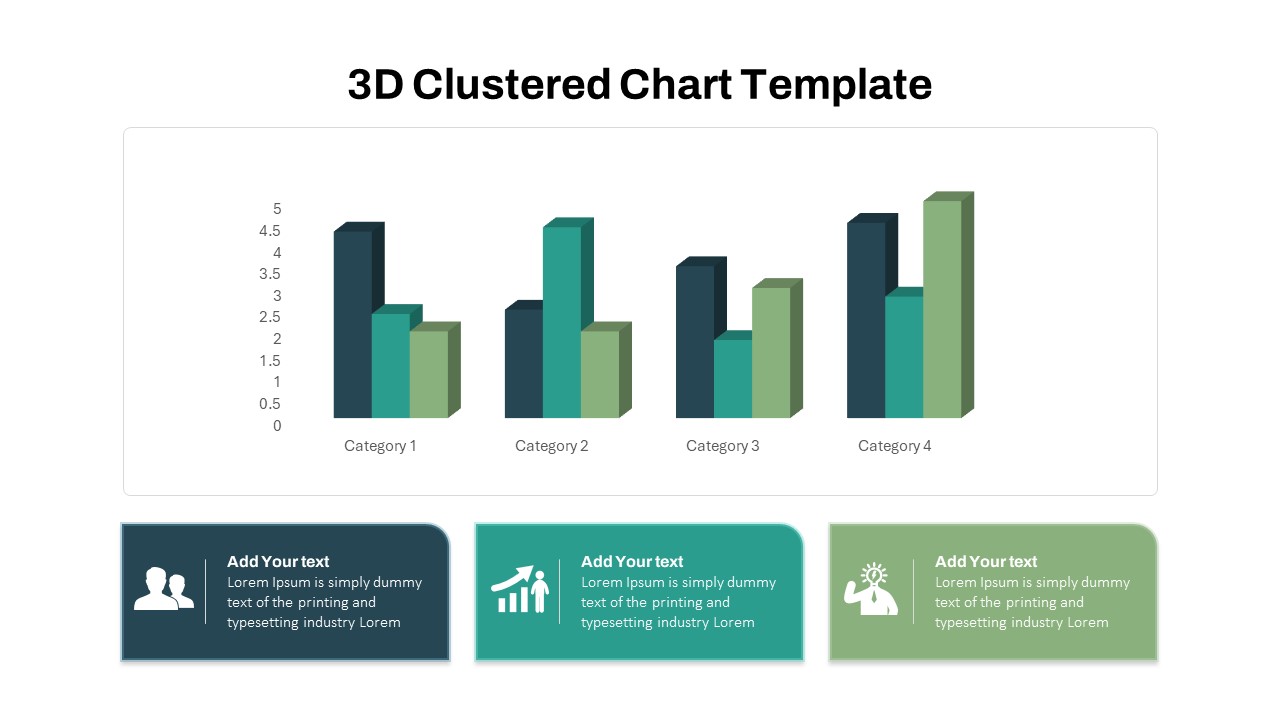
The 3D Cone Chart Template helps you present numerical data, compare categories, and communicate trends through a visually engaging three-dimensional chart. Featuring cone-shaped columns in different heights, this infographic makes it easier to highlight differences between datasets and explain business performance. It is suitable for reports, analytical presentations, sales reviews, and data-driven discussions.
The chart displays four categories, each containing three coloured cones representing different data series. The vertical axis provides numerical reference points, while the horizontal axis identifies individual categories. This structure allows audiences to compare values quickly and recognize variations across multiple groups. Three supporting information panels on the right provide space for key findings, explanations, or recommendations.
- 3D cone chart design: Display numerical values using cone-shaped columns with varying heights.
- Multi-category comparison: Present three data series across four categories for side-by-side analysis.
- Numerical axis and gridlines: Help audiences interpret values and compare differences between data points.
- Supporting information panels: Highlight three important findings, observations, or business insights.
- Editable presentation elements: Customise chart labels, values, headings, colours, and descriptions in PowerPoint and Google Slides.
The 3D Cone Chart Template provides a practical way to turn numerical information into a structured visual story. Replace the sample categories and placeholder text with your own data to communicate meaningful findings. Use the chart to support comparisons, explain performance differences, and help stakeholders understand the information behind your decisions.
See more

Aspect Ratio
16:9Item ID
SKT04925


FAQs
You May Also Like These Presentation Templates


- Free
- Free


- Free
- Free
- Free

- Free
- Free