Business Performance Report Dashboard Analytics Presentation Template for PowerPoint & Google Slides
Corporate Performance Metrics Dashboard Report Template for PowerPoint & Google Slides
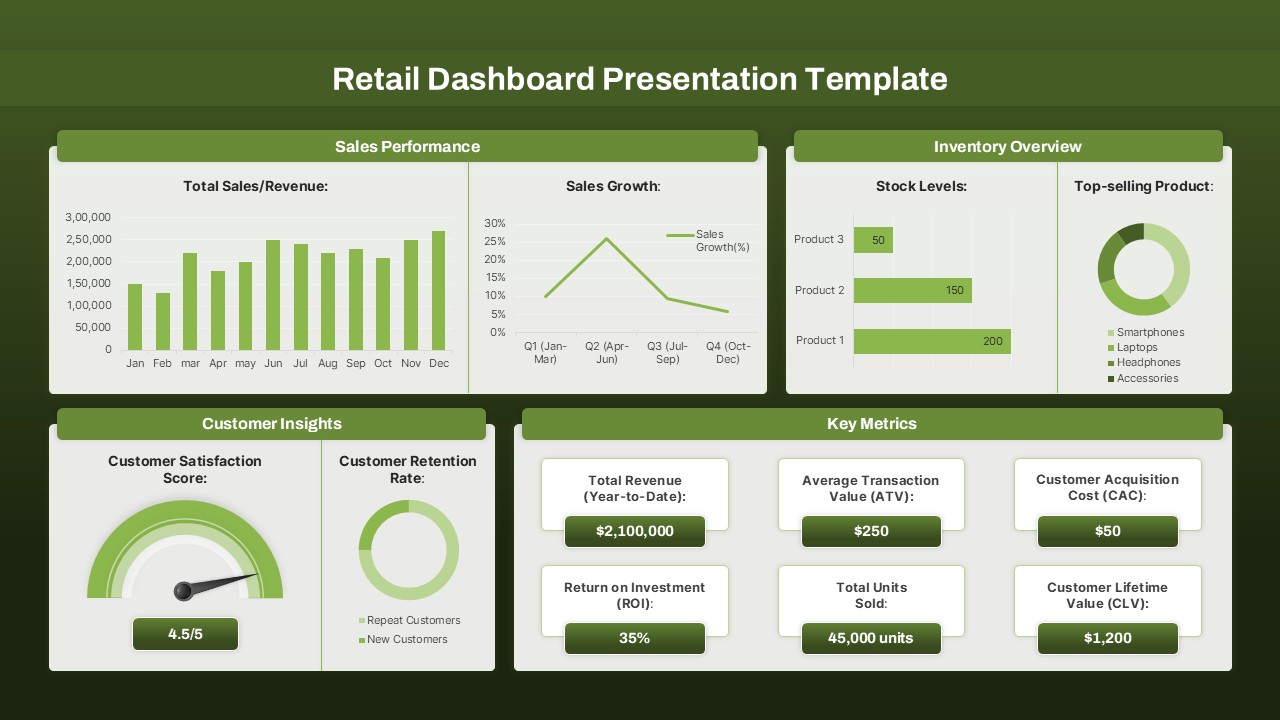
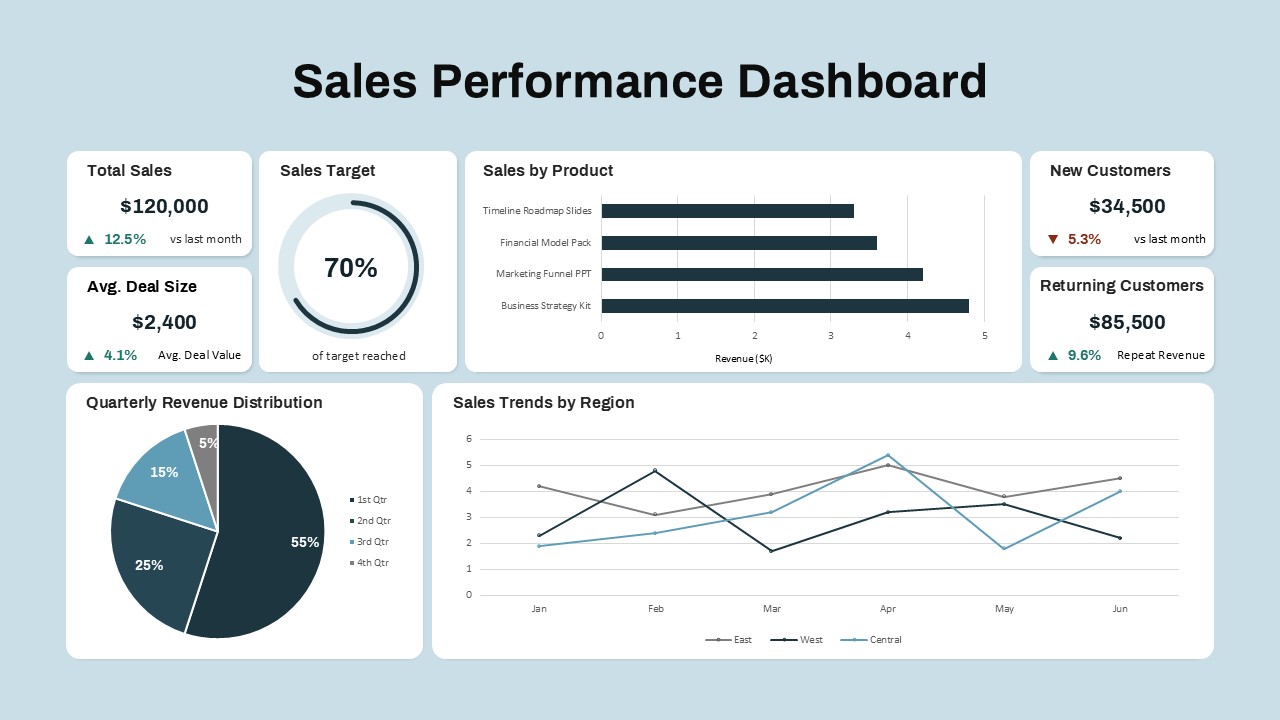
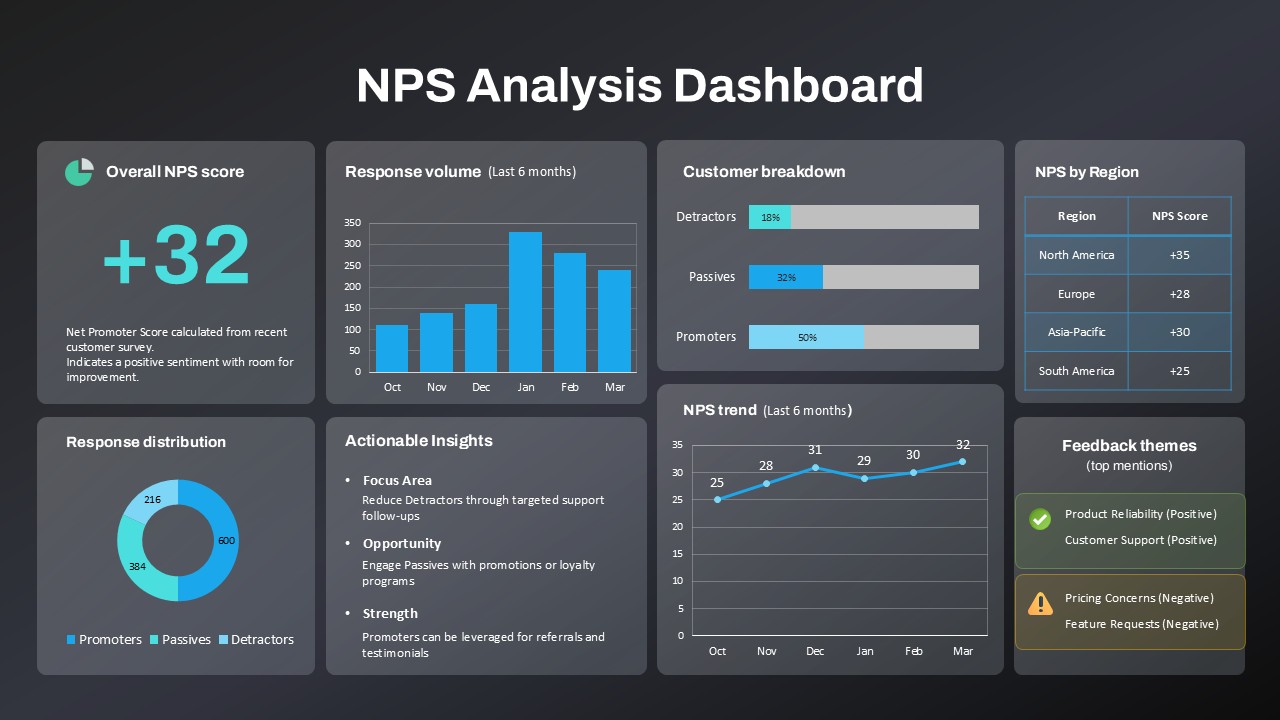
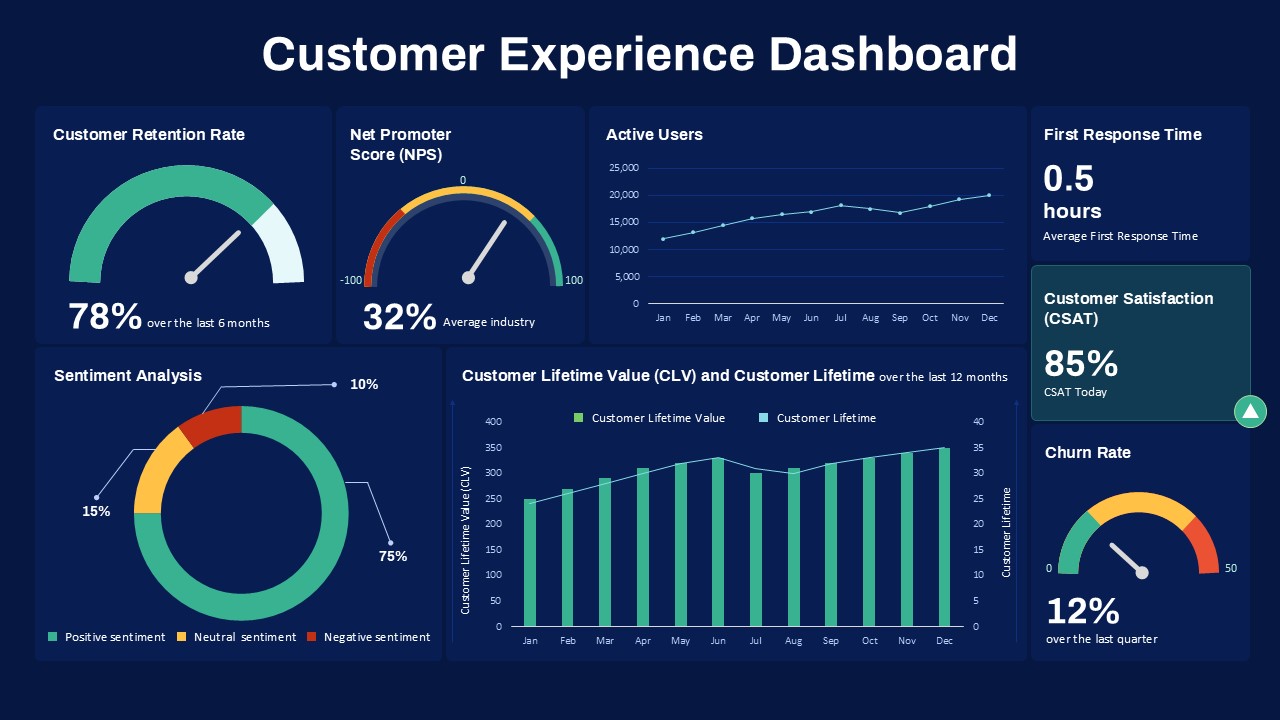
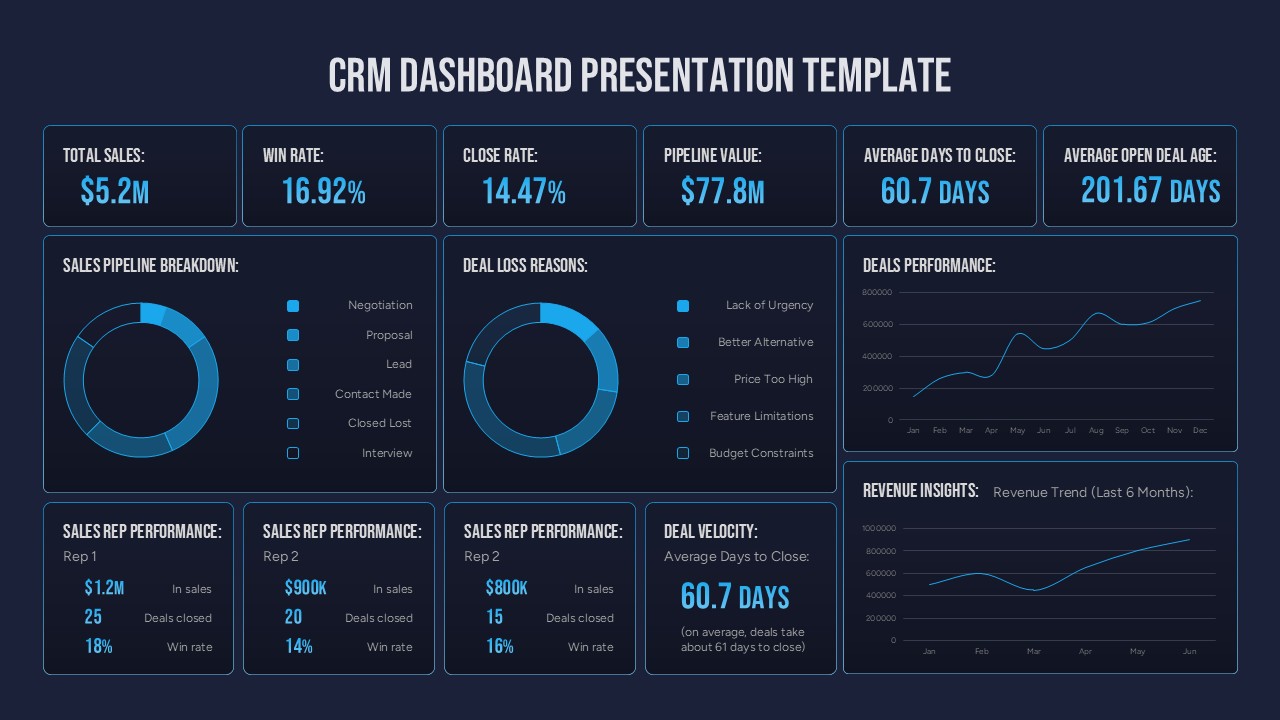
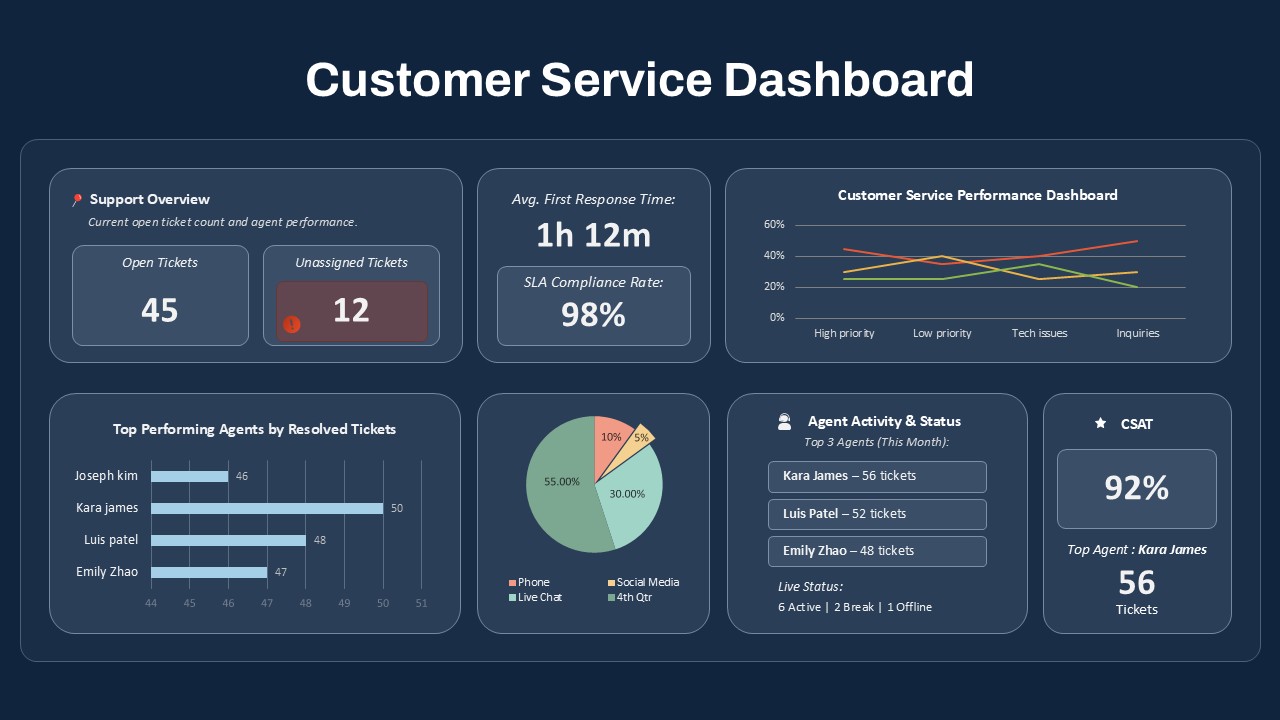
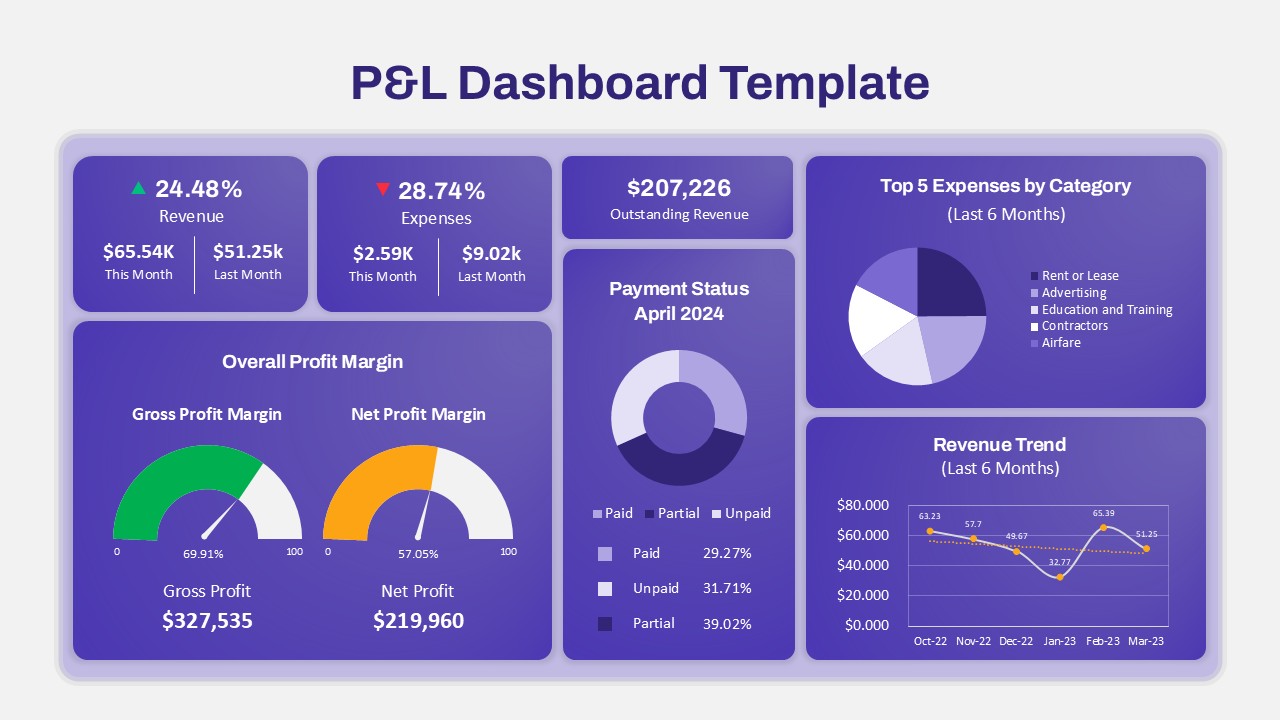
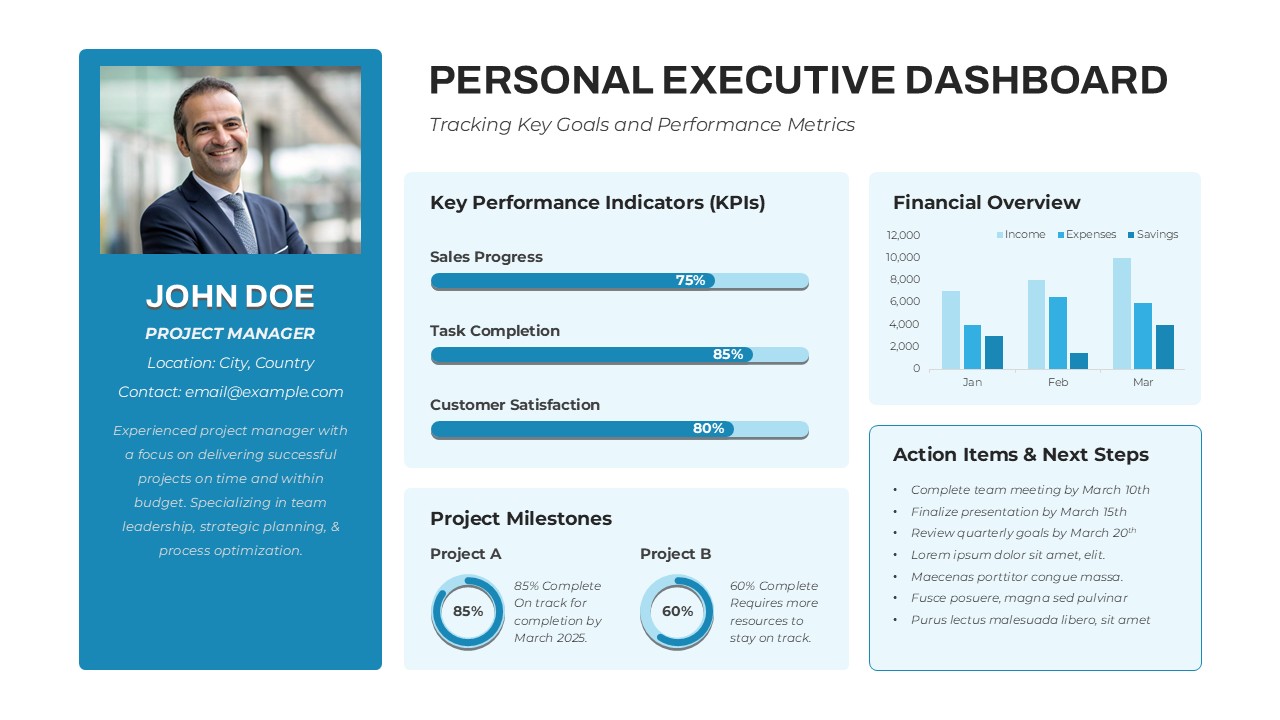
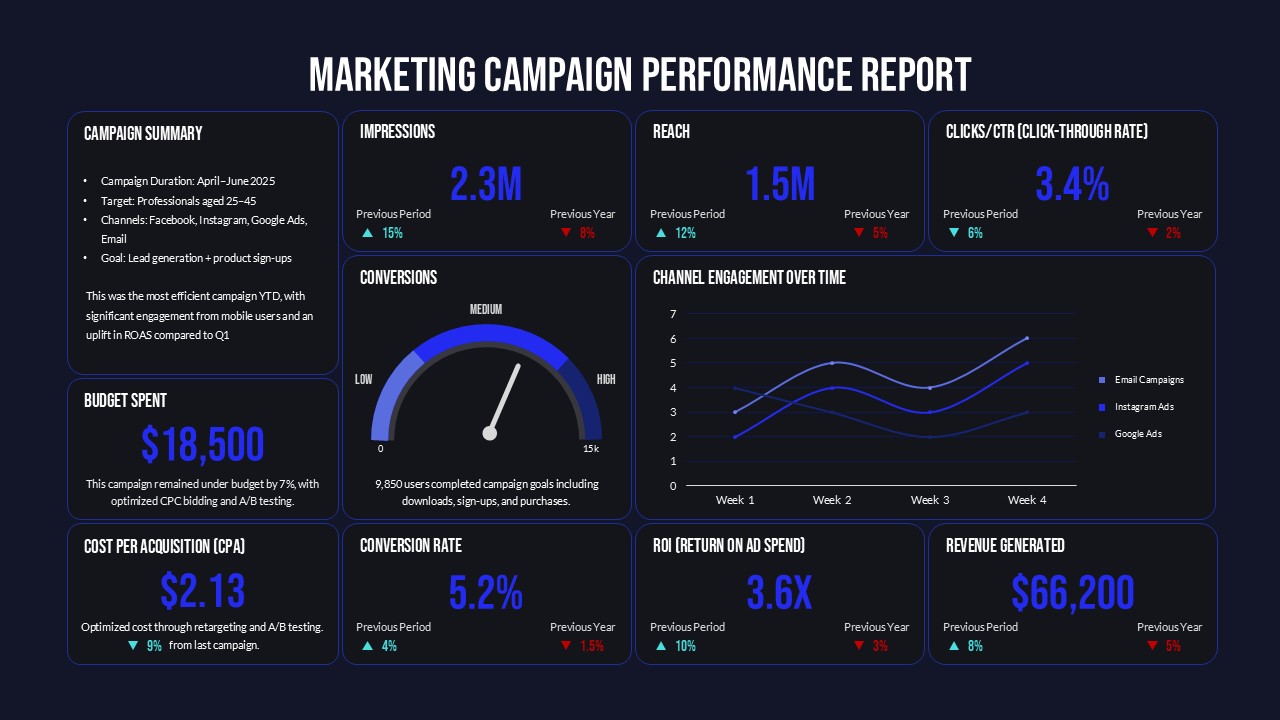
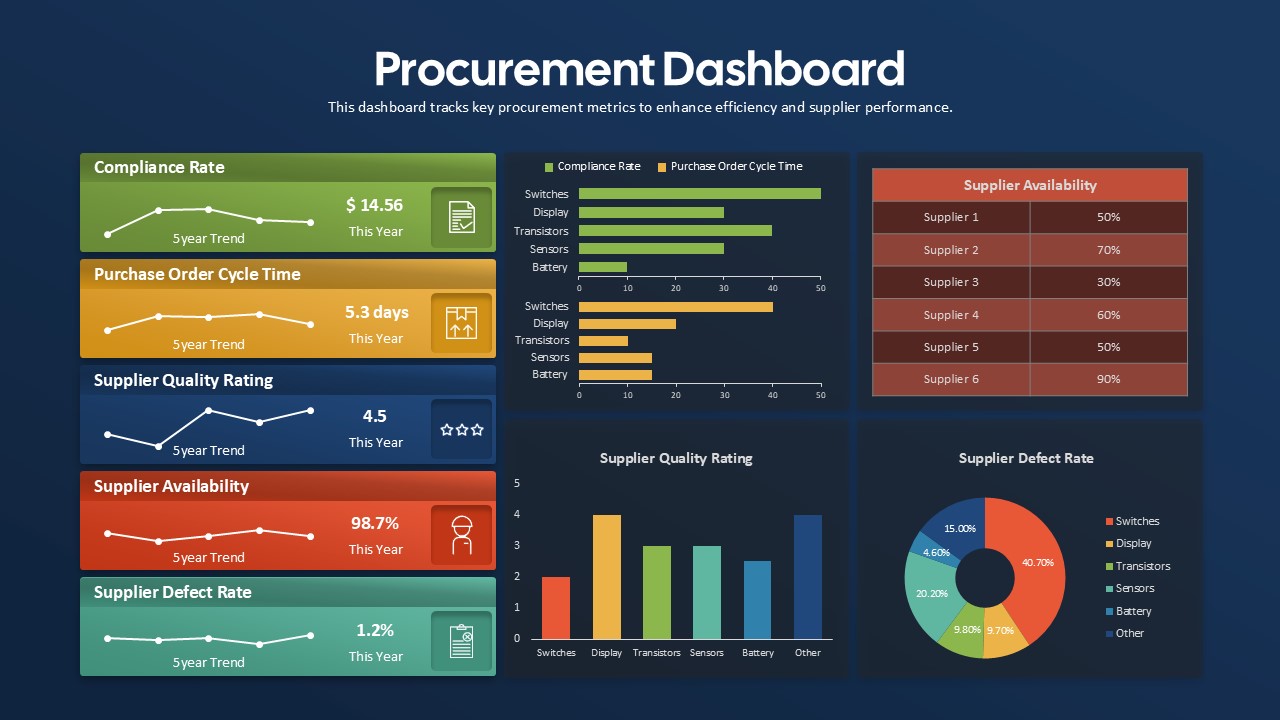
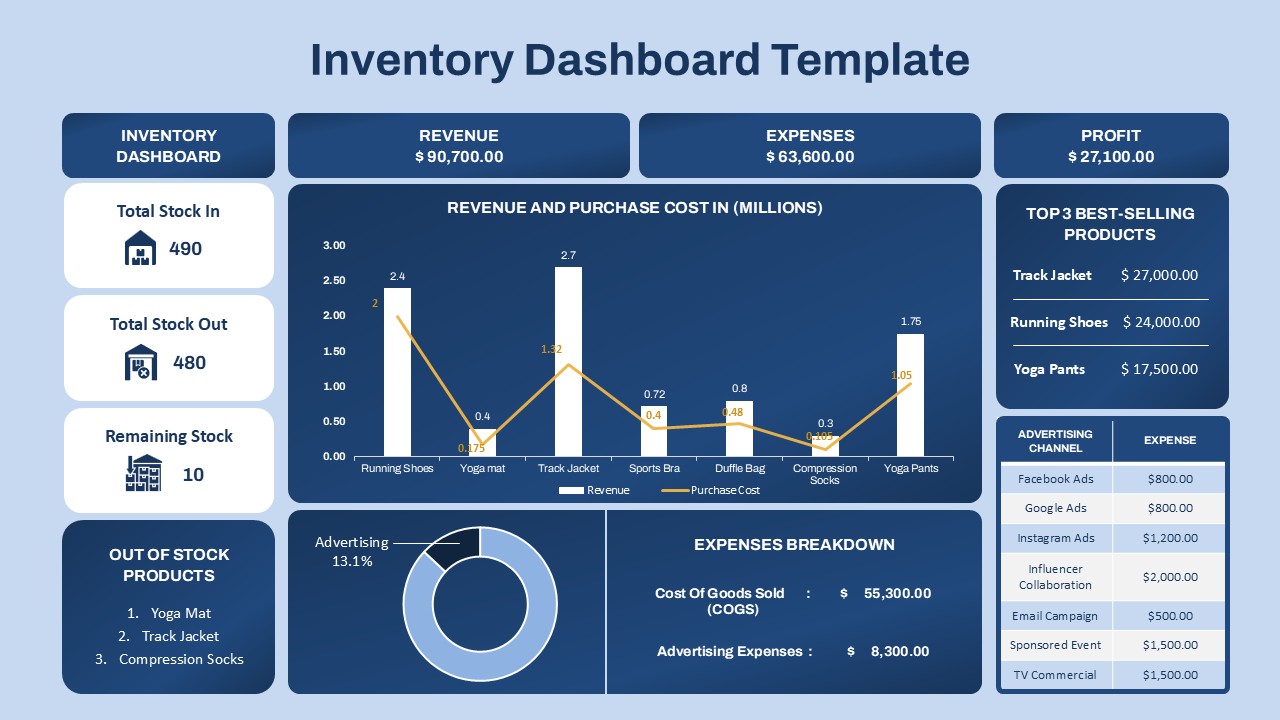
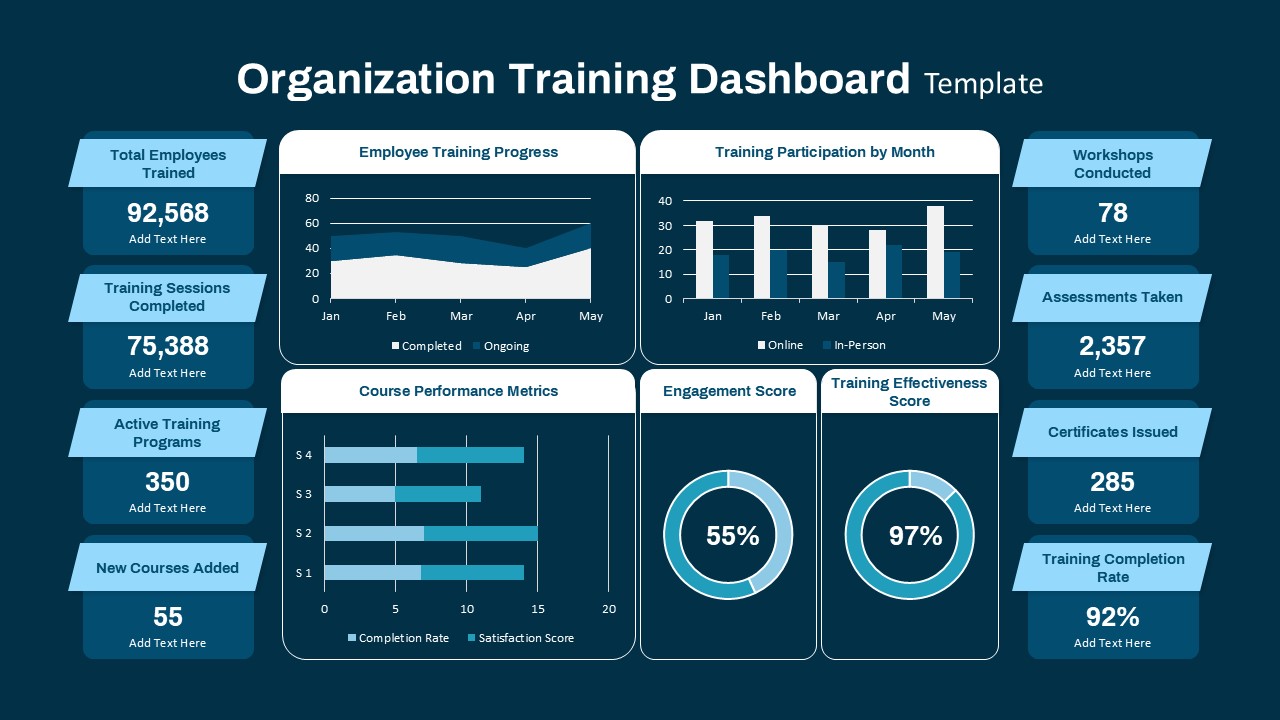
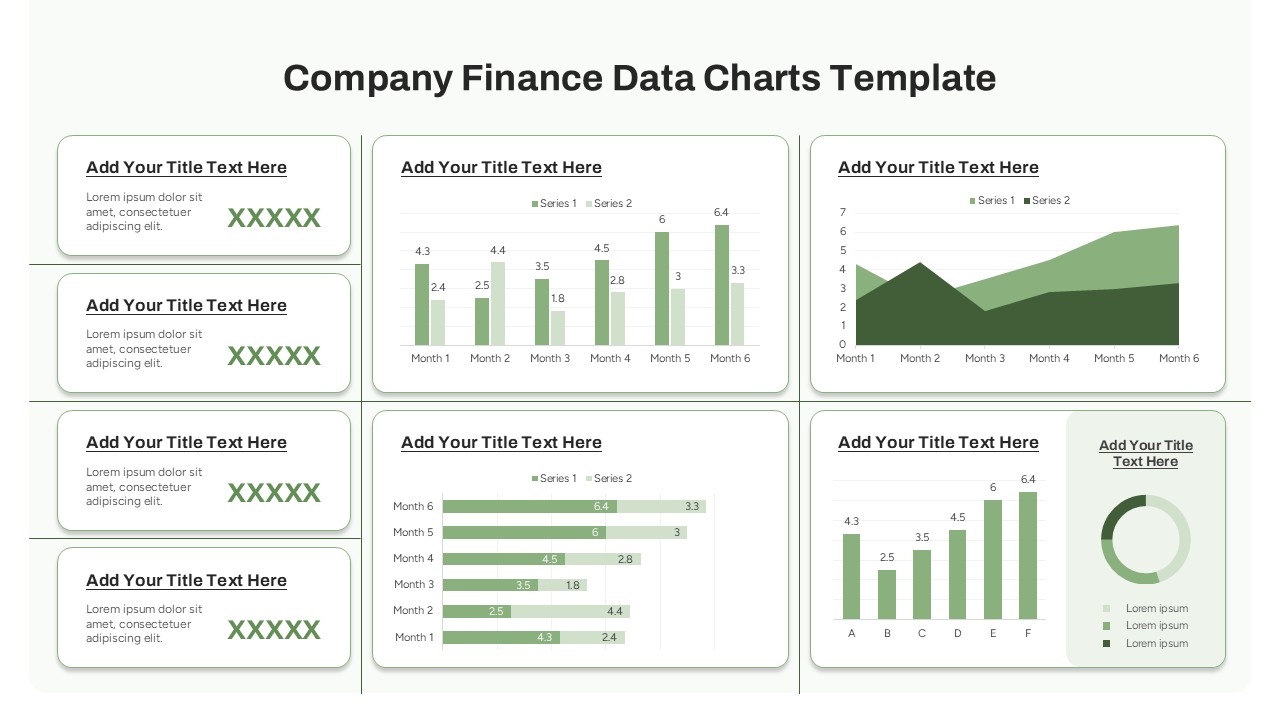
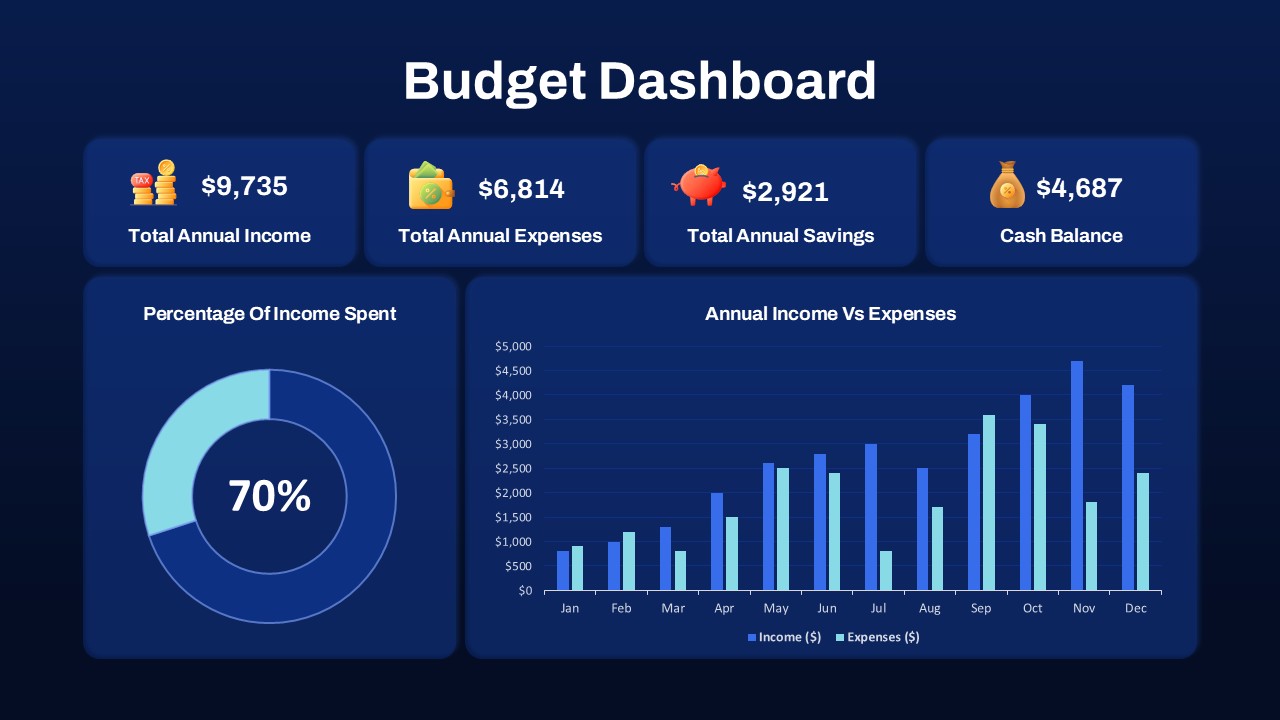
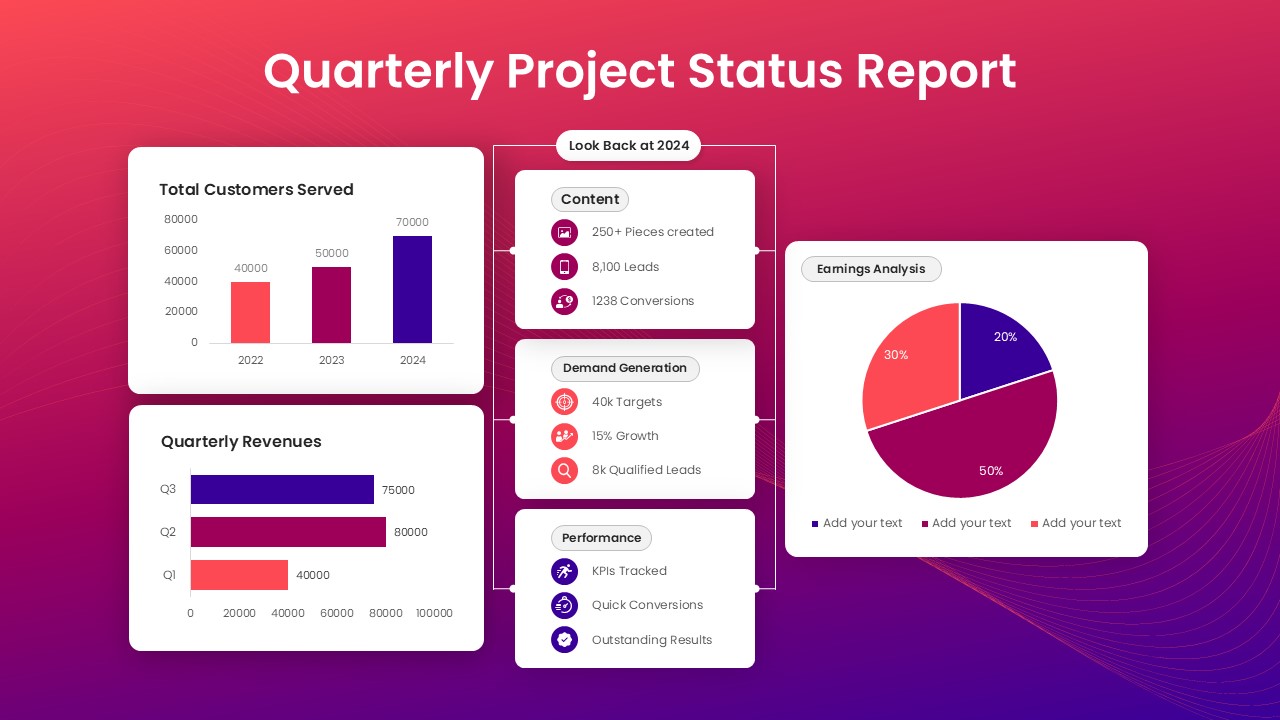
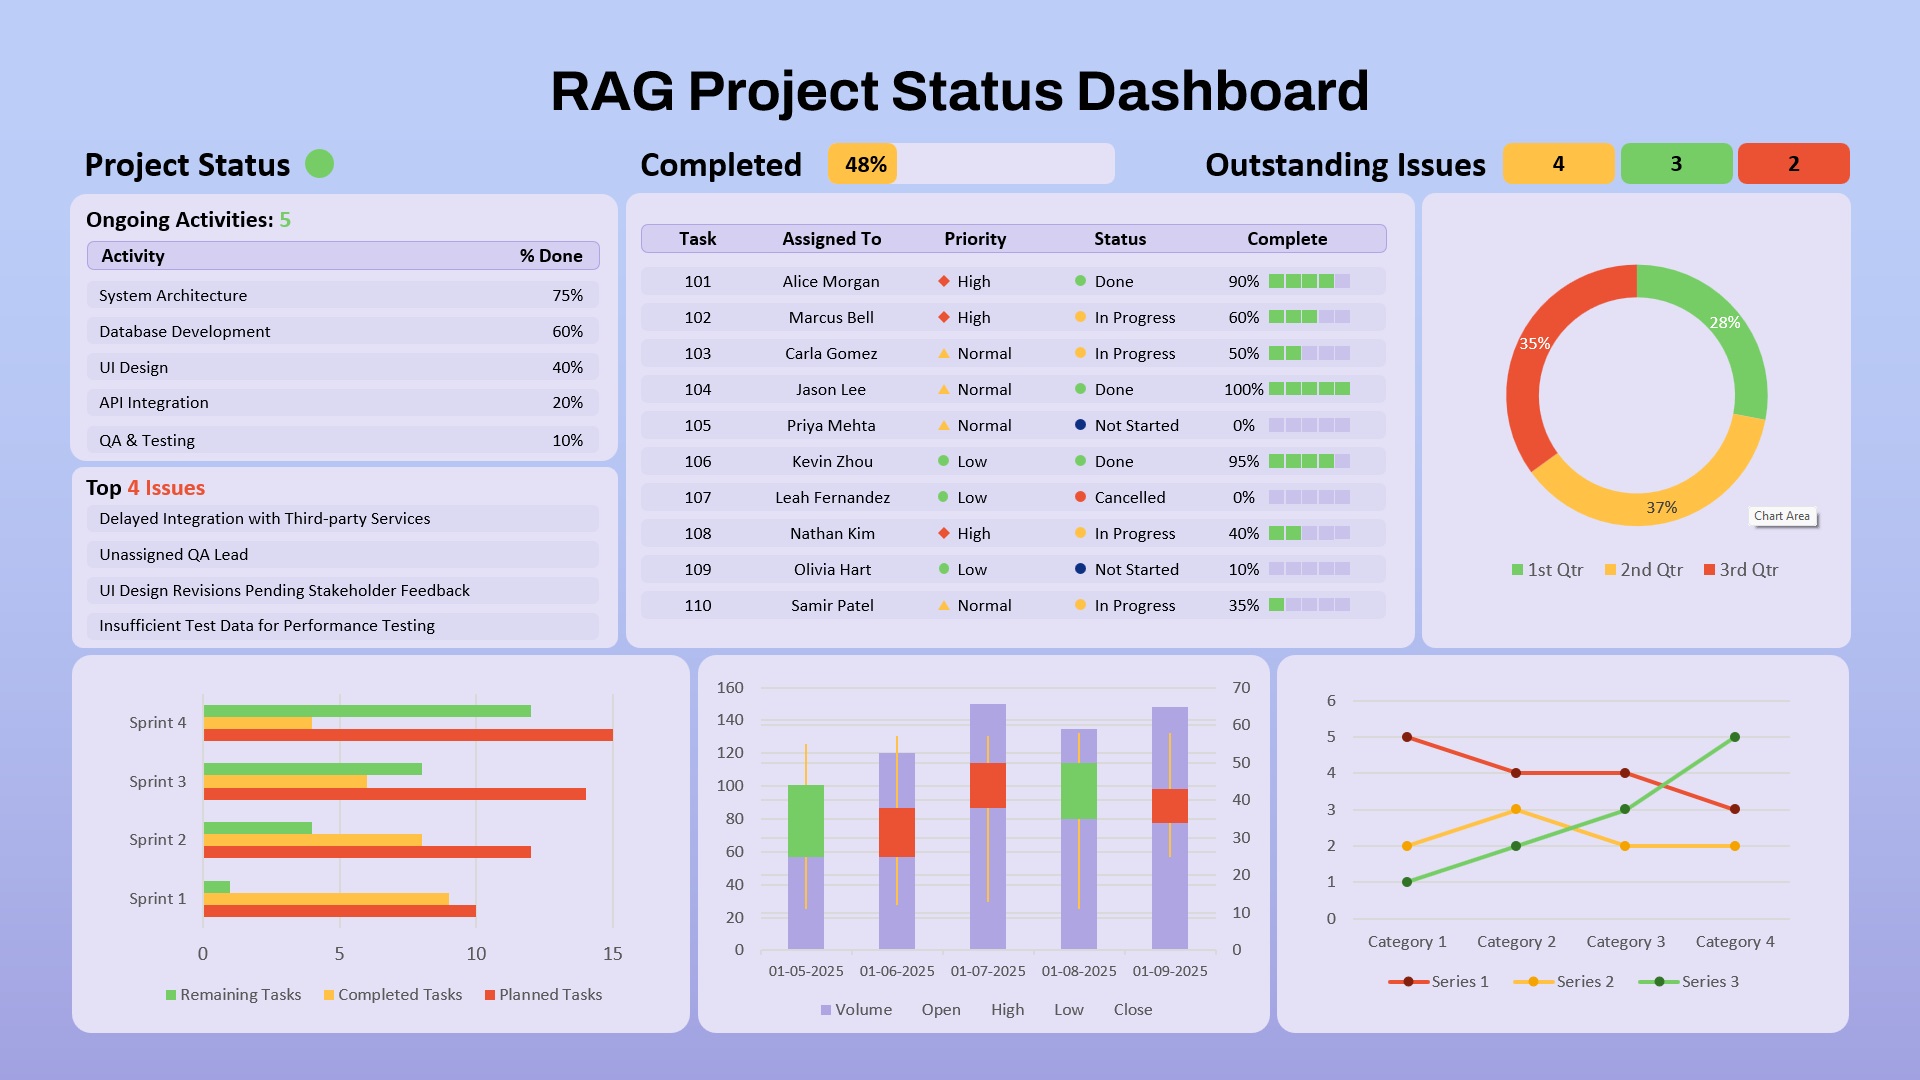
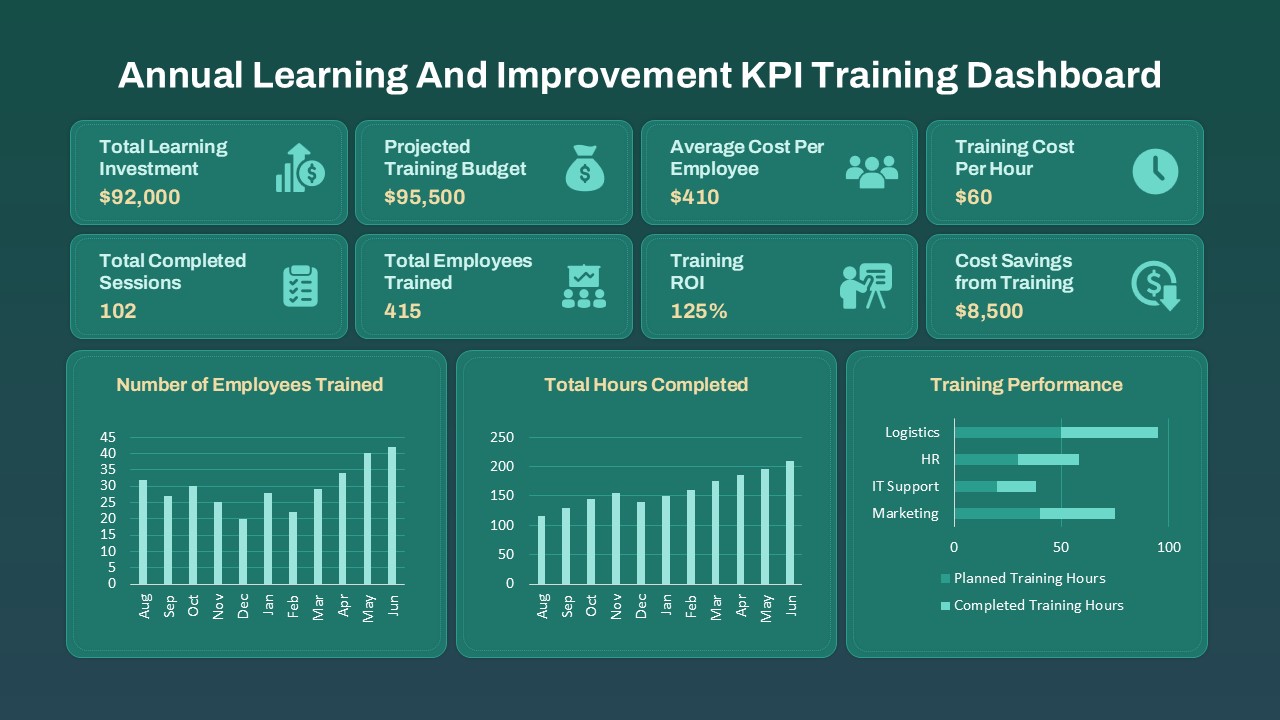
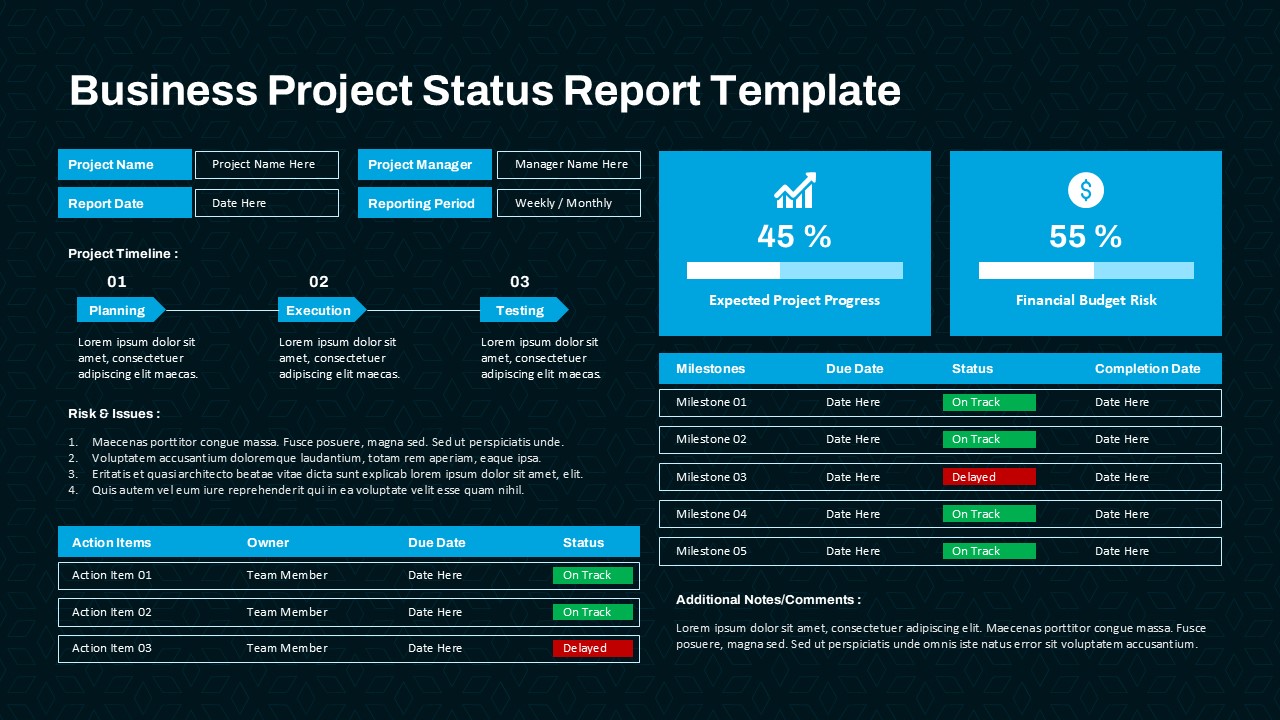
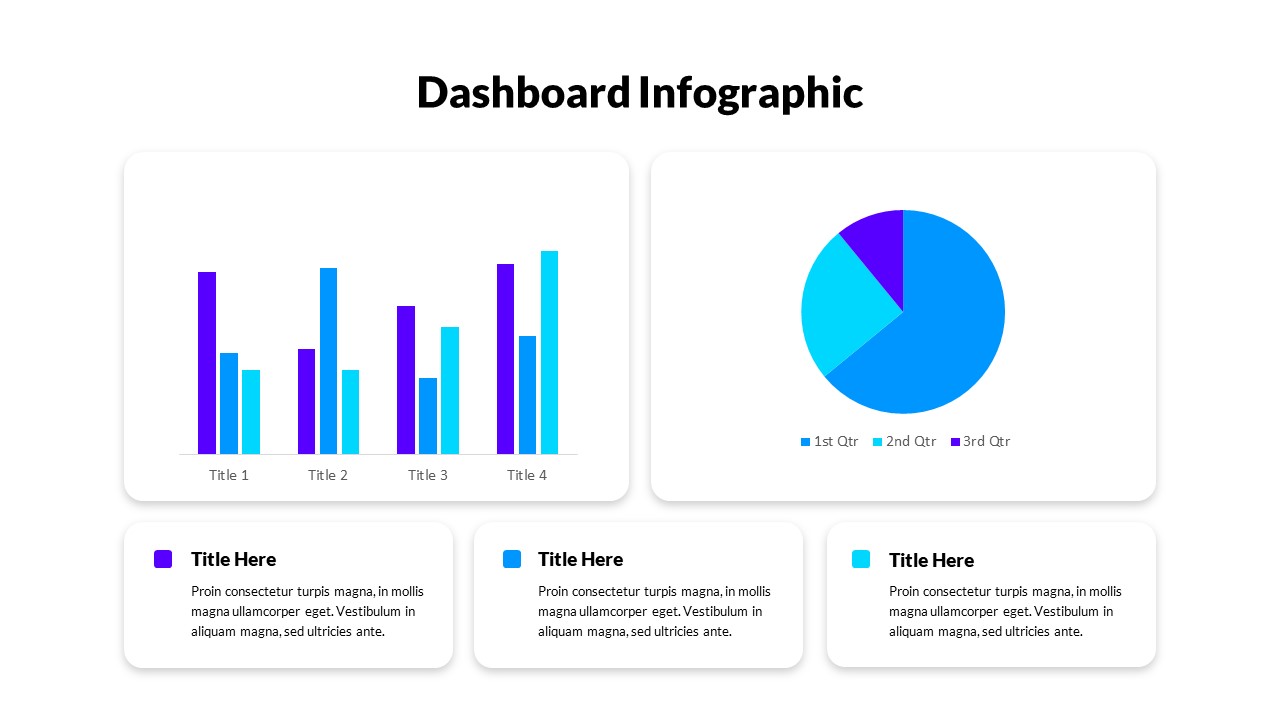
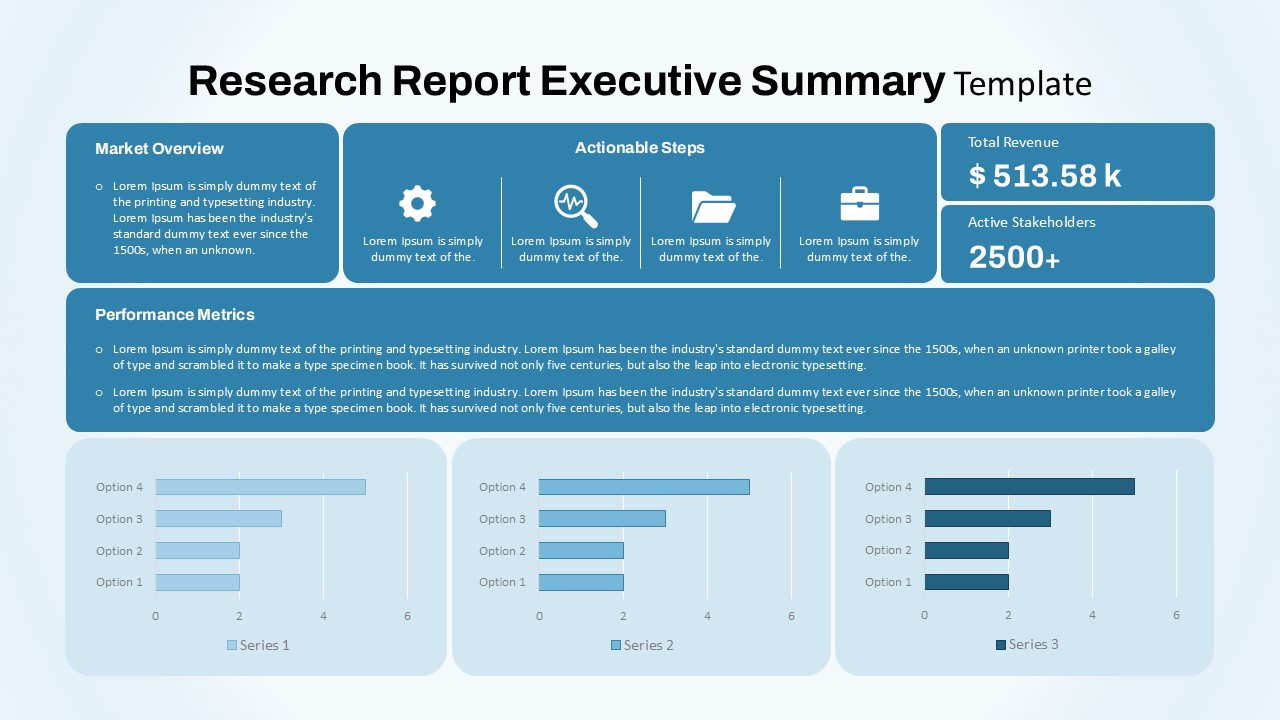
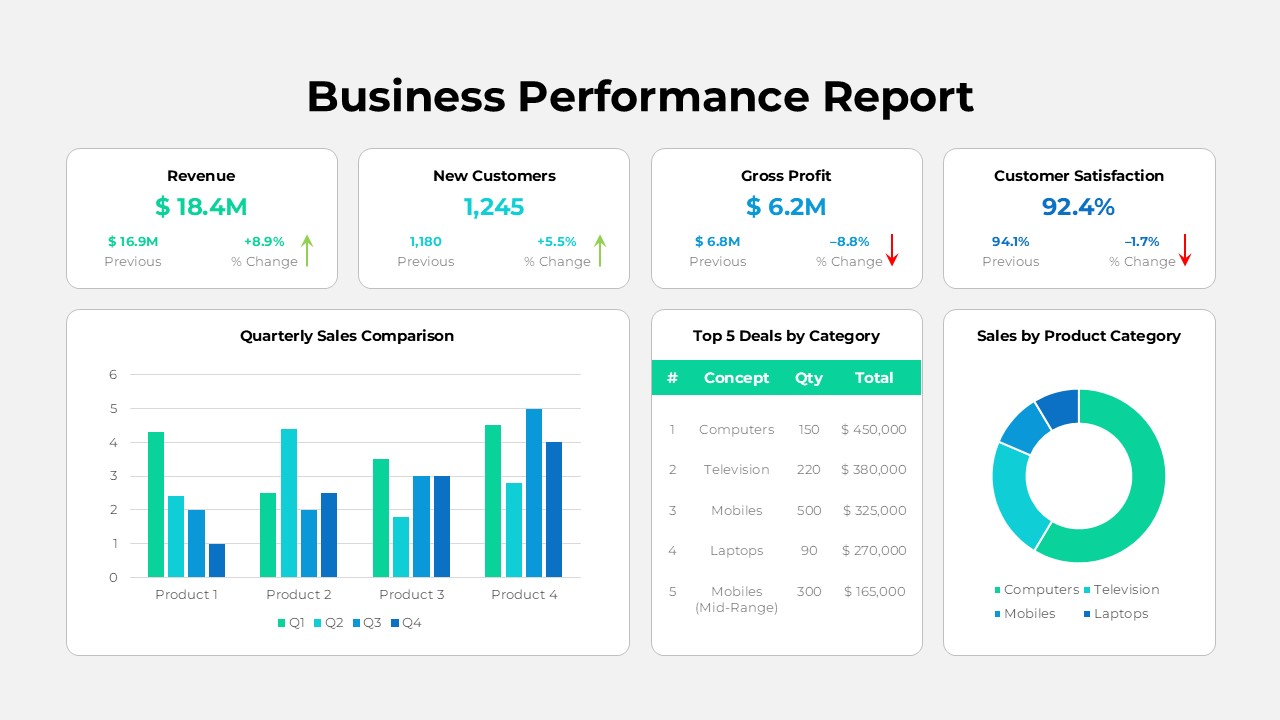
The Business Performance Report Dashboard Analytics Presentation Template for PowerPoint & Google Slides is designed to help organizations present key business metrics in a clear, structured, and visually engaging format. Featuring a professional dashboard layout, this slide combines revenue tracking, customer growth, profitability indicators, customer satisfaction metrics, sales comparisons, category performance analysis, and top deal summaries into a single executive-ready view.
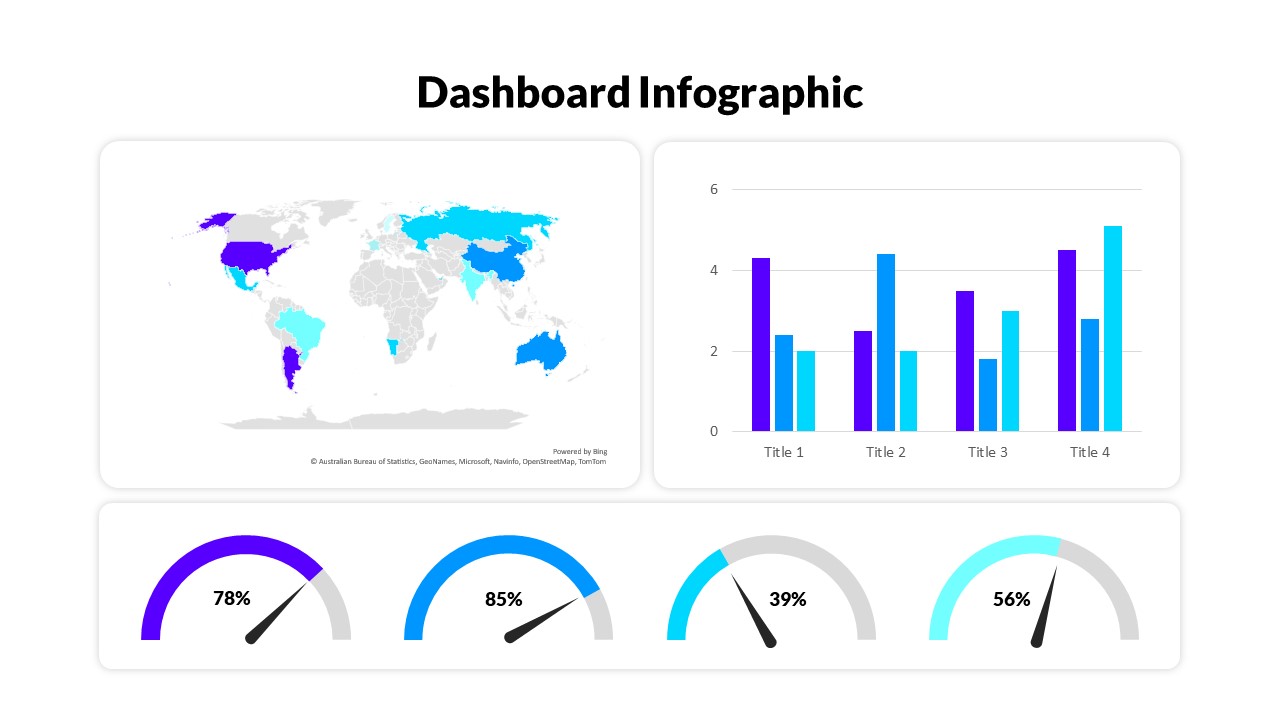
This Business Performance Report Dashboard Analytics Presentation Template for PowerPoint & Google Slides enables teams to transform complex business data into actionable insights. The layout integrates KPI cards, comparison charts, data tables, and category distribution visuals, making it suitable for executive reviews, quarterly business reports, board meetings, sales performance updates, and operational reporting. The clean design ensures that stakeholders can quickly understand trends, performance changes, and strategic priorities without being overwhelmed by excessive information.
Whether you are reporting revenue growth, monitoring customer acquisition, evaluating product category sales, or presenting performance benchmarks, this dashboard slide provides a professional framework for communicating results effectively. Fully editable in PowerPoint and Google Slides, users can customize metrics, charts, labels, and data points to match specific reporting requirements. The modern business-focused design helps organizations improve data storytelling, support decision-making, and deliver impactful presentations that drive discussions and strategic planning.
Features of this template
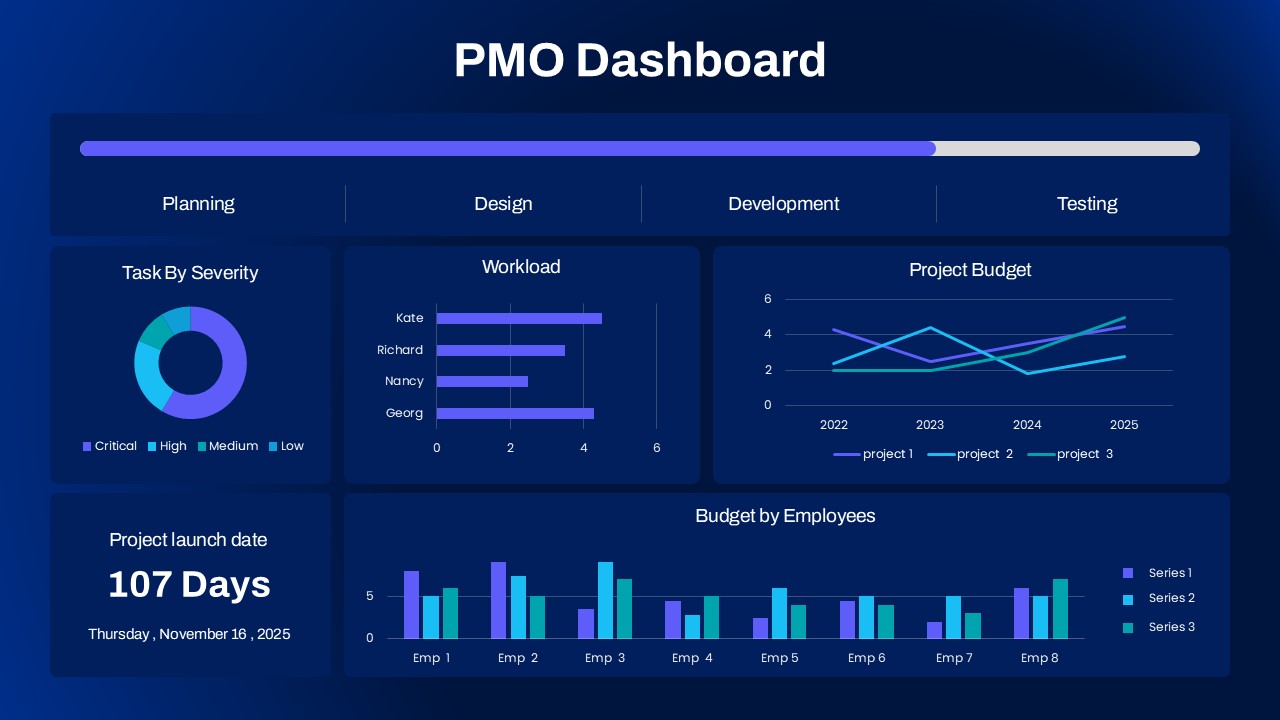
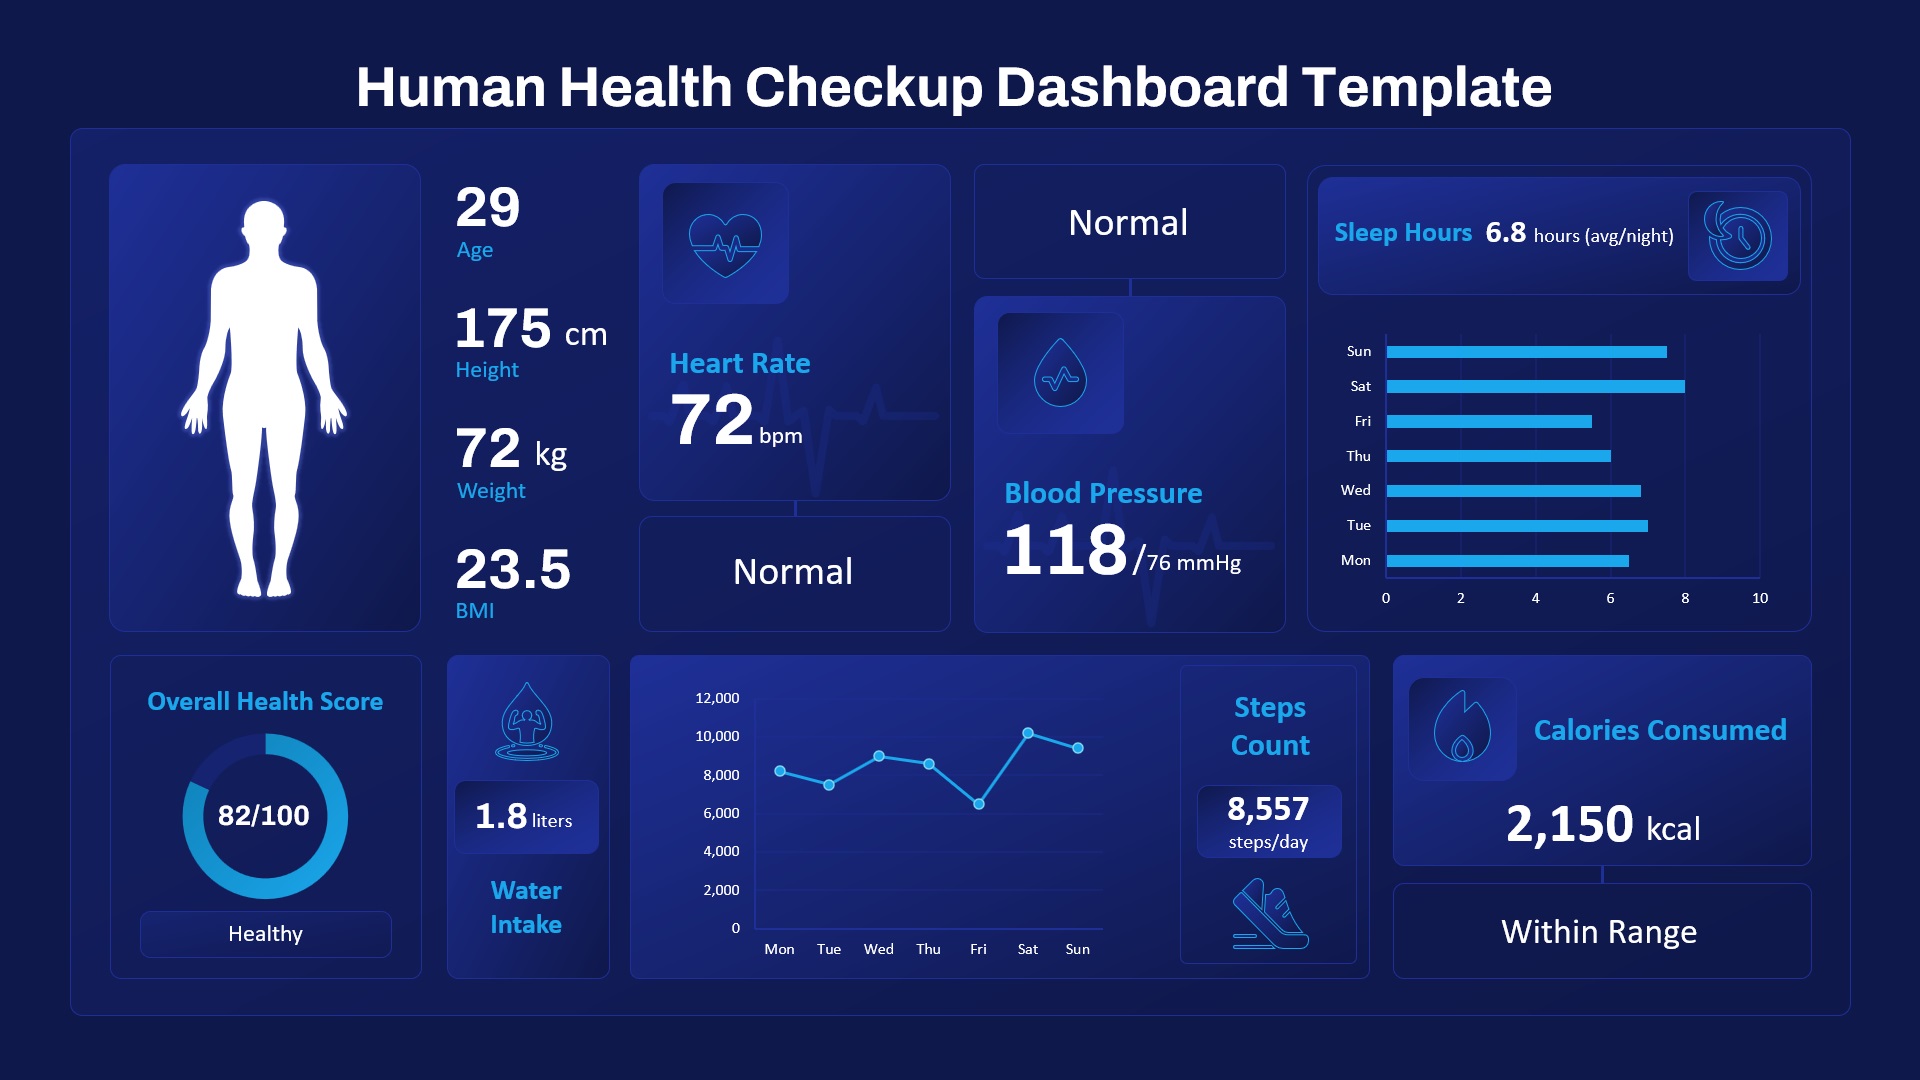
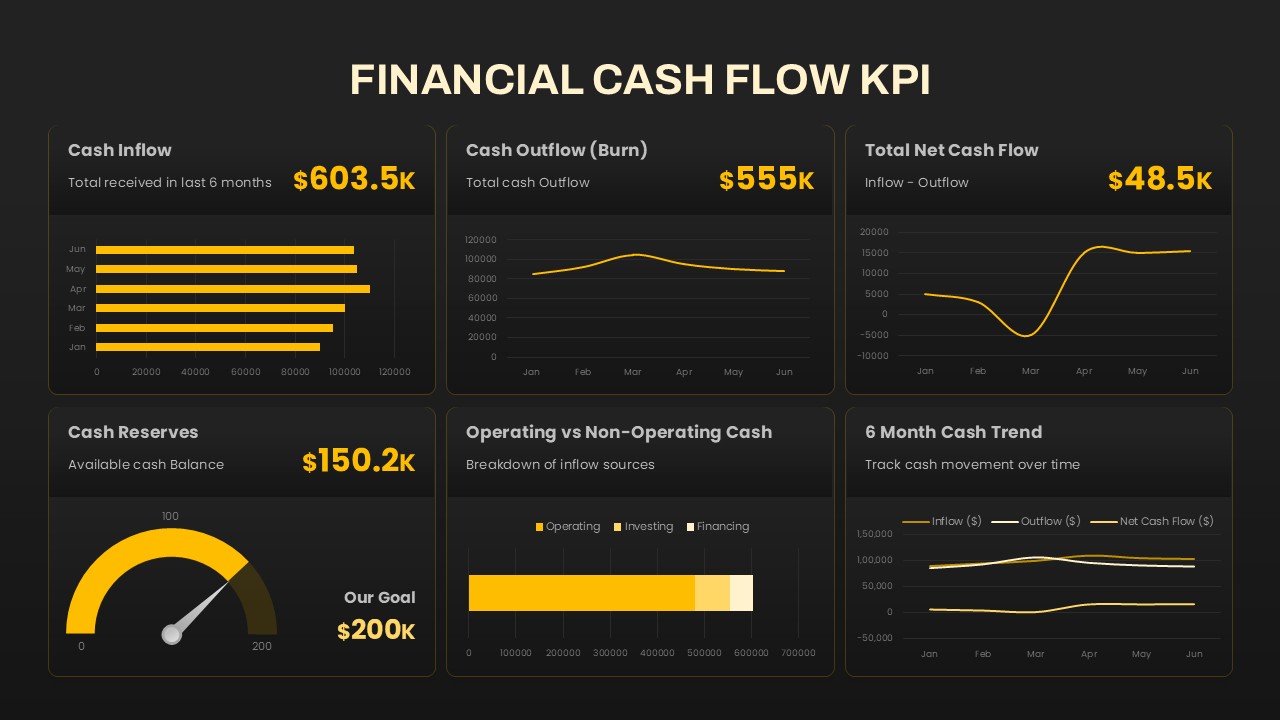
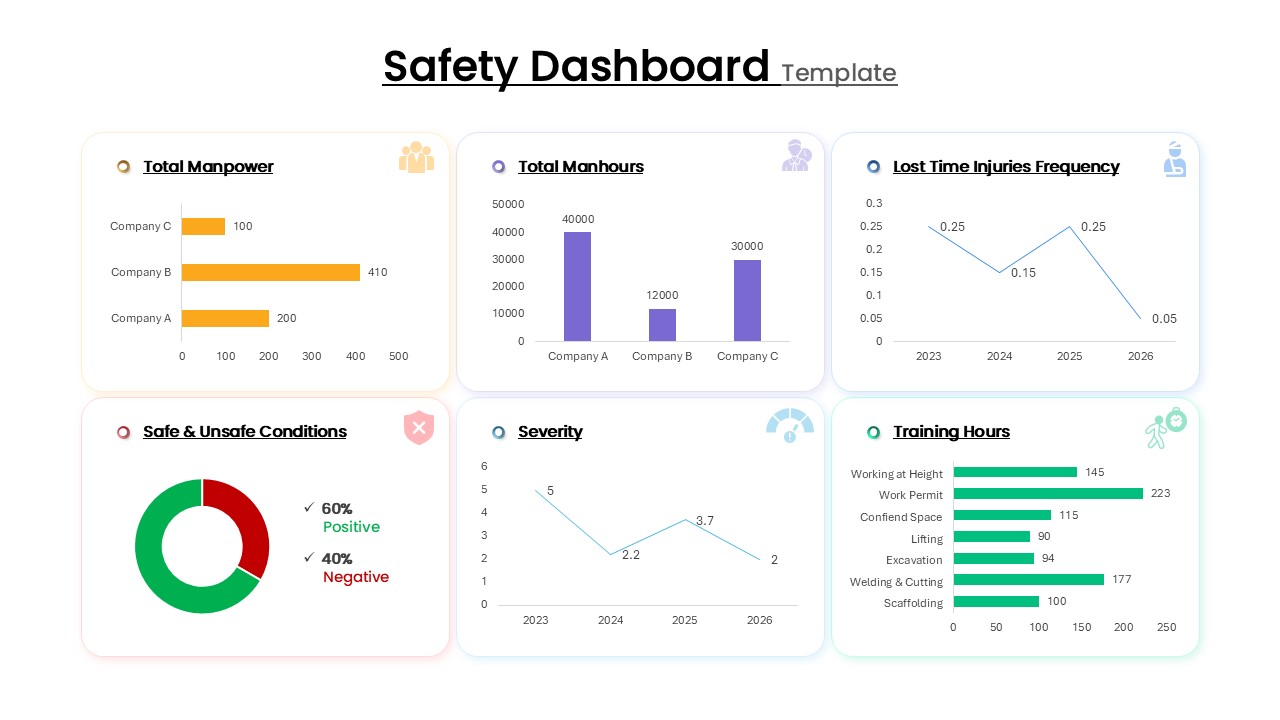
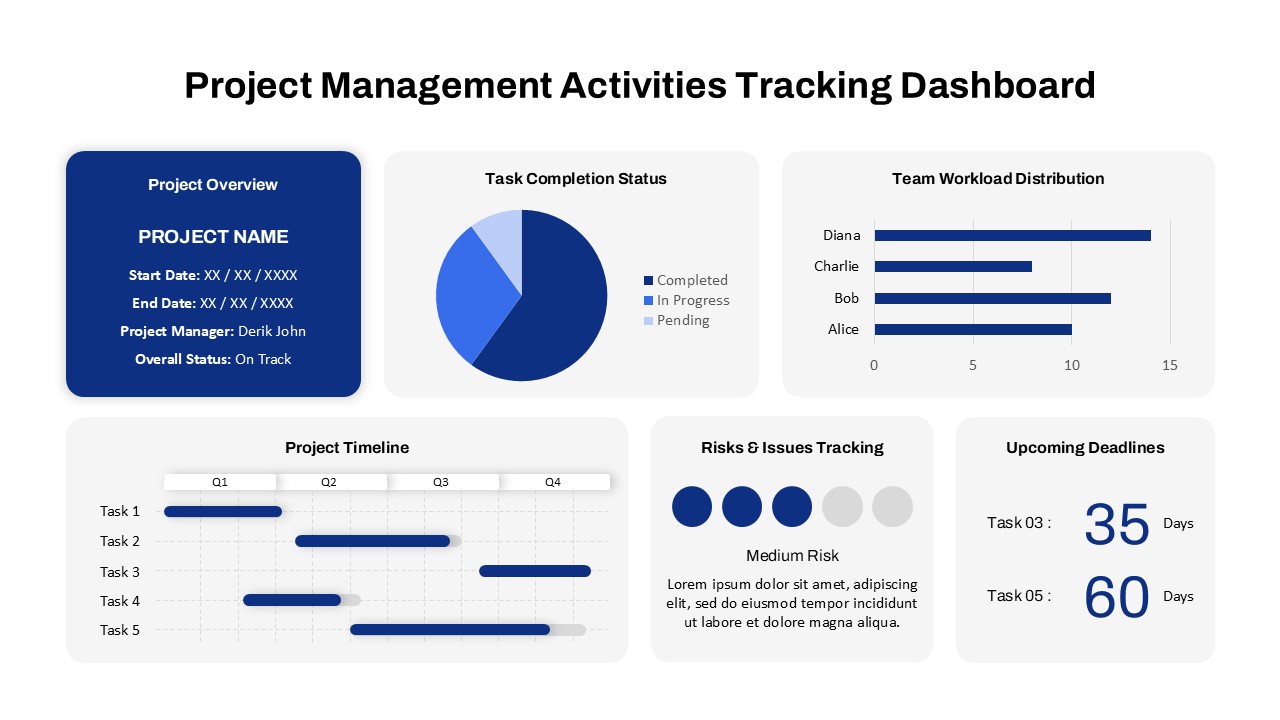
- Professional business performance dashboard layout
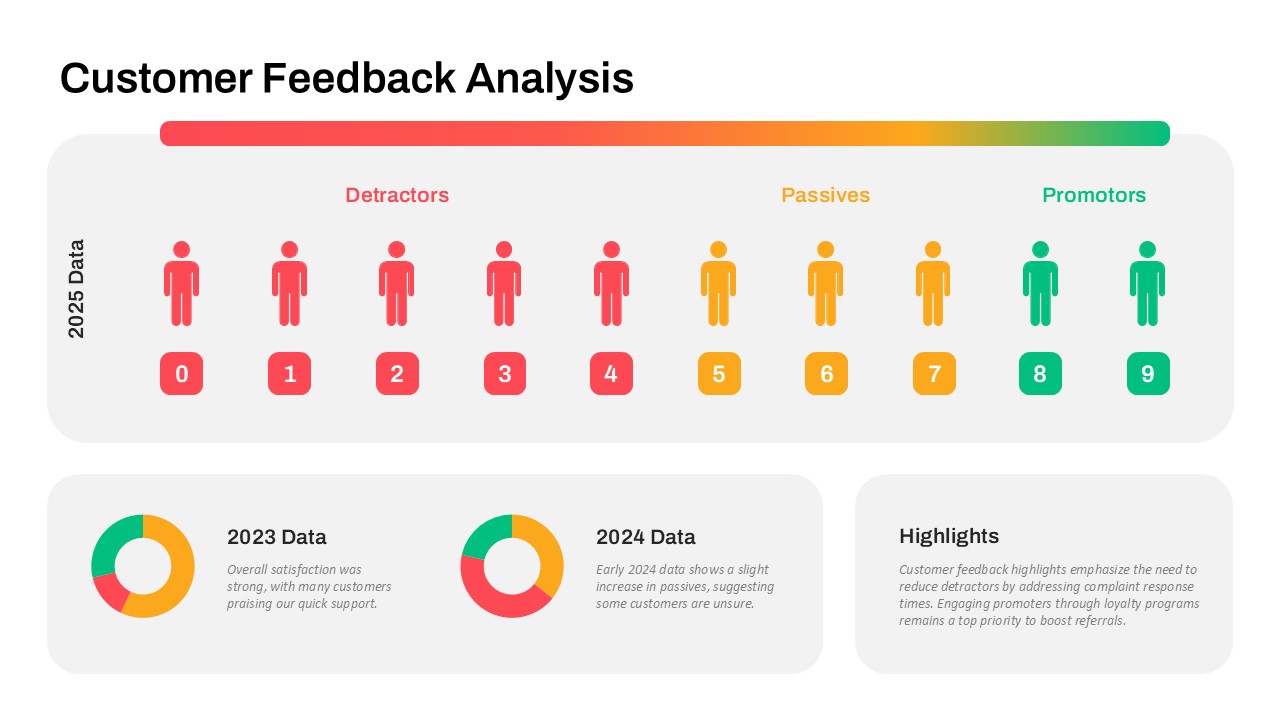
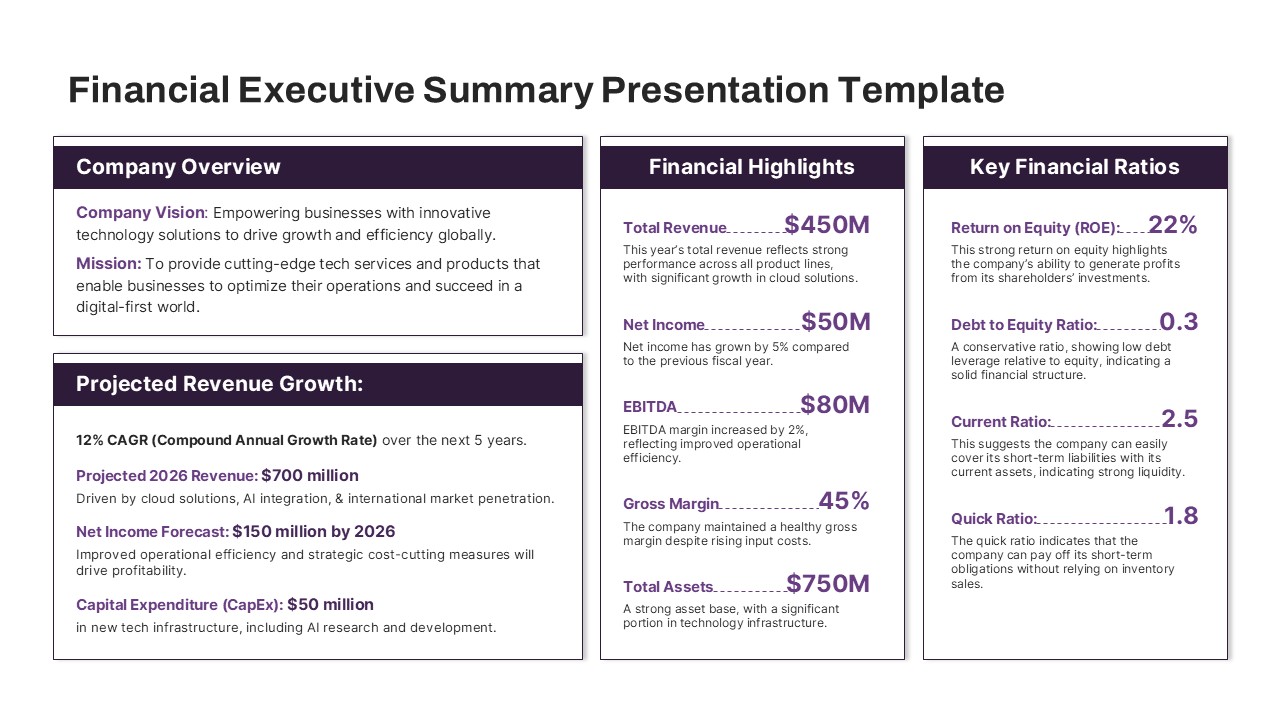
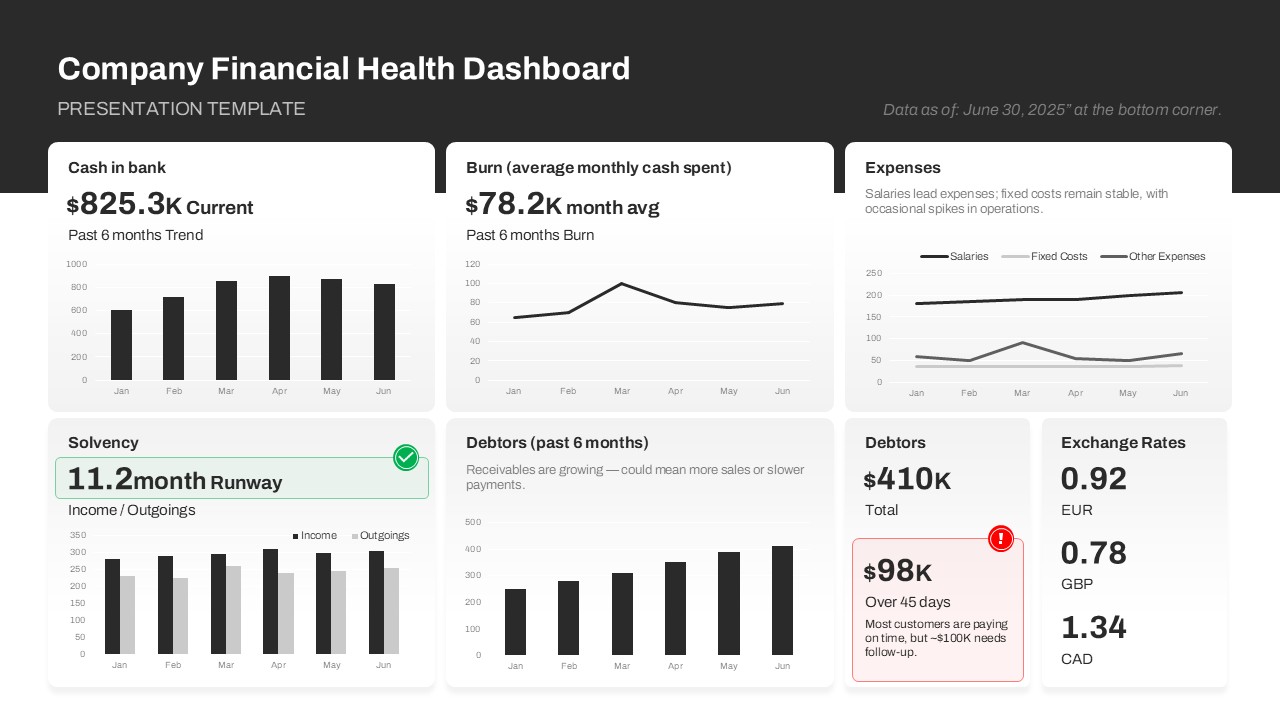
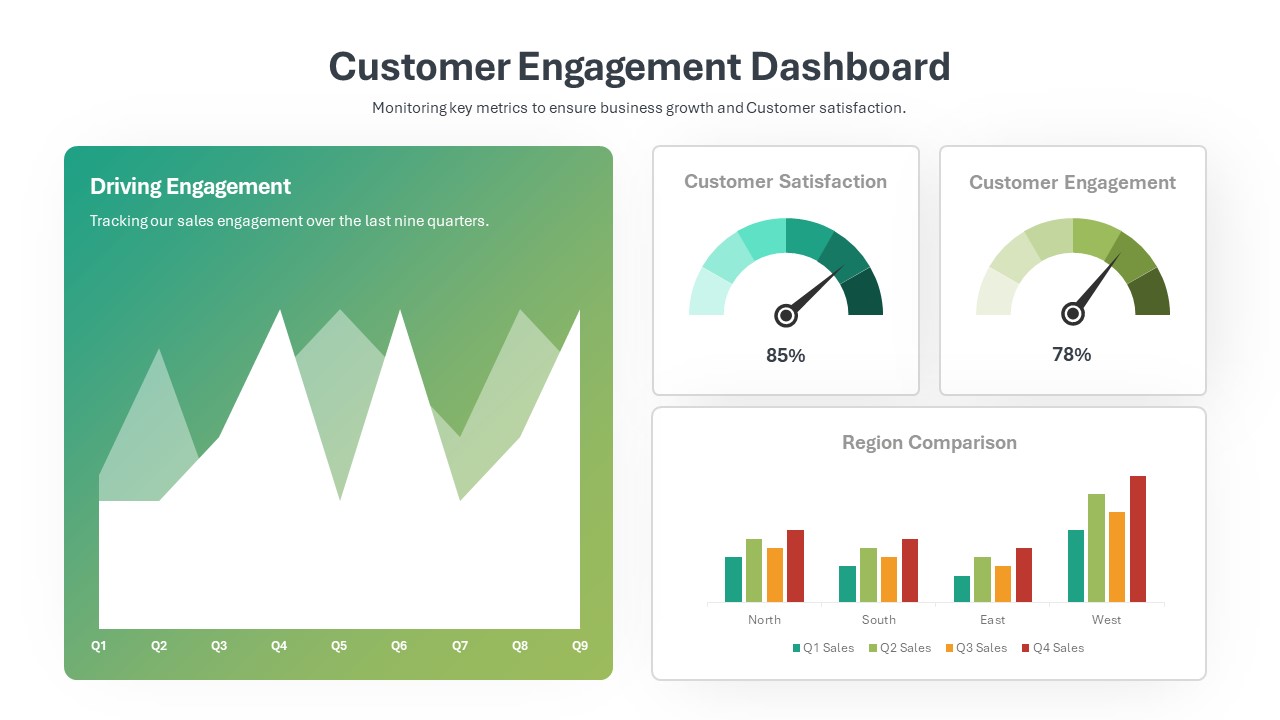
- KPI cards for revenue, customers, profit, and satisfaction metrics
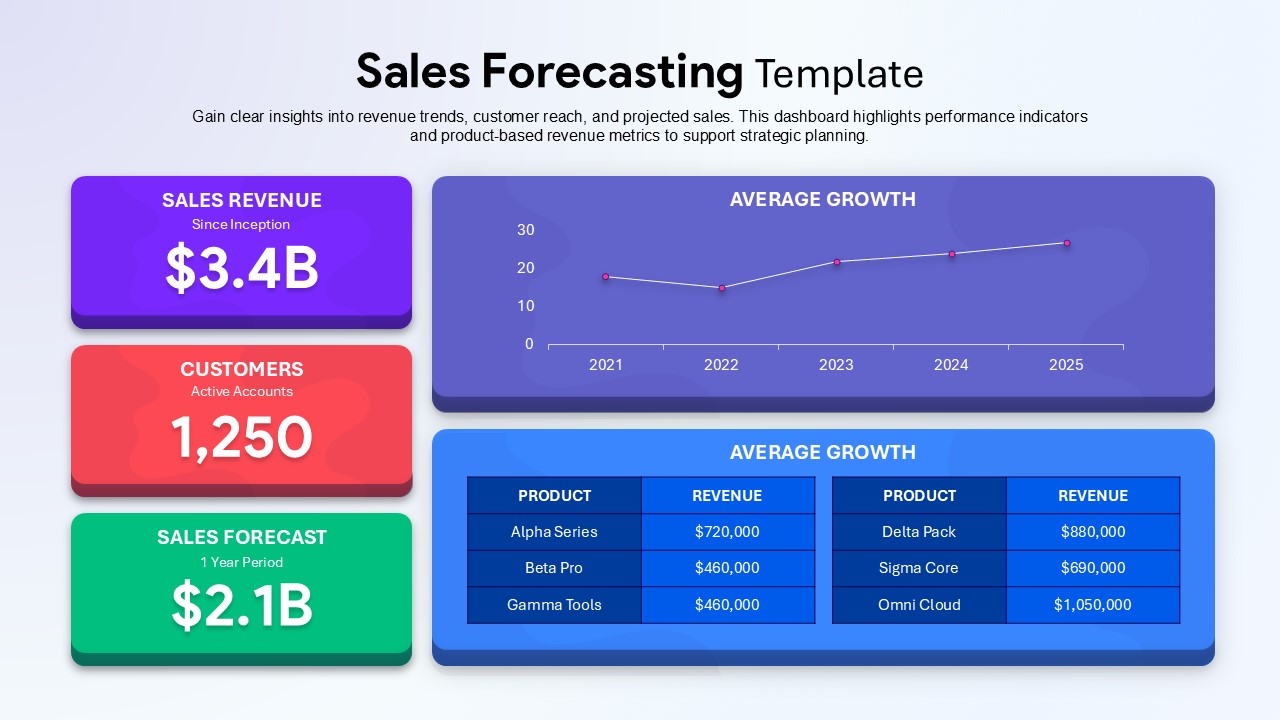
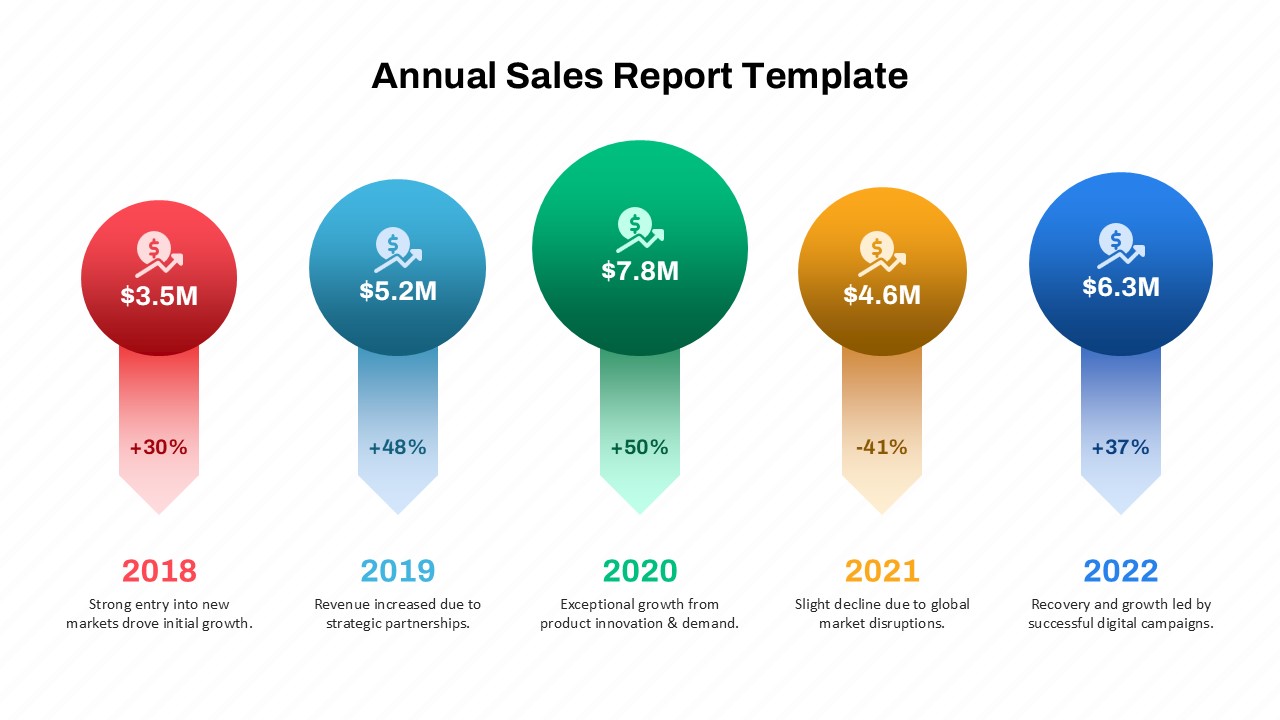
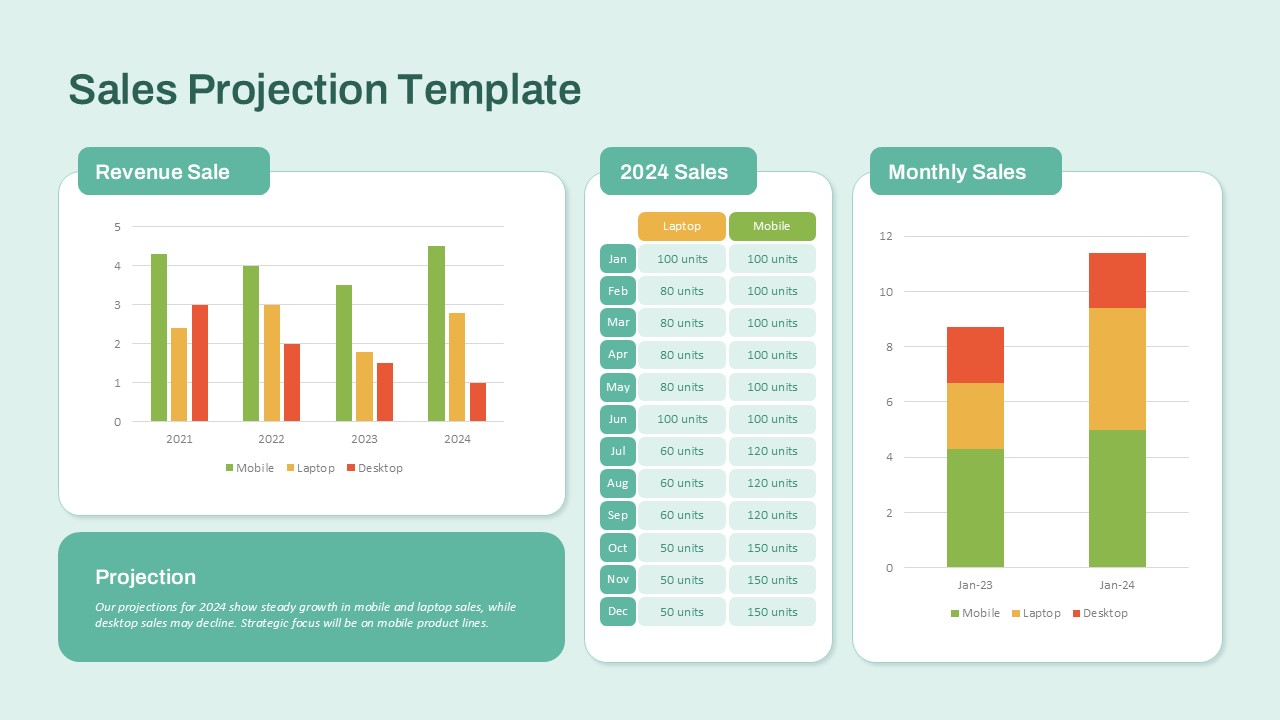
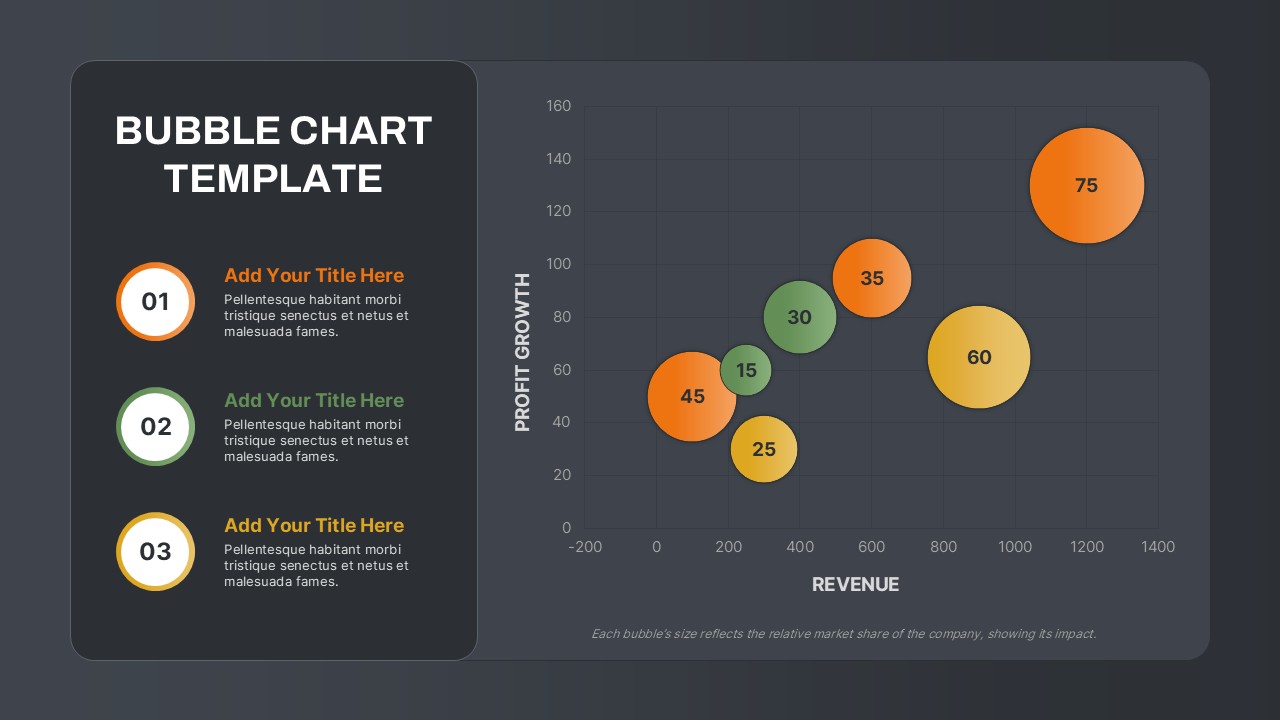
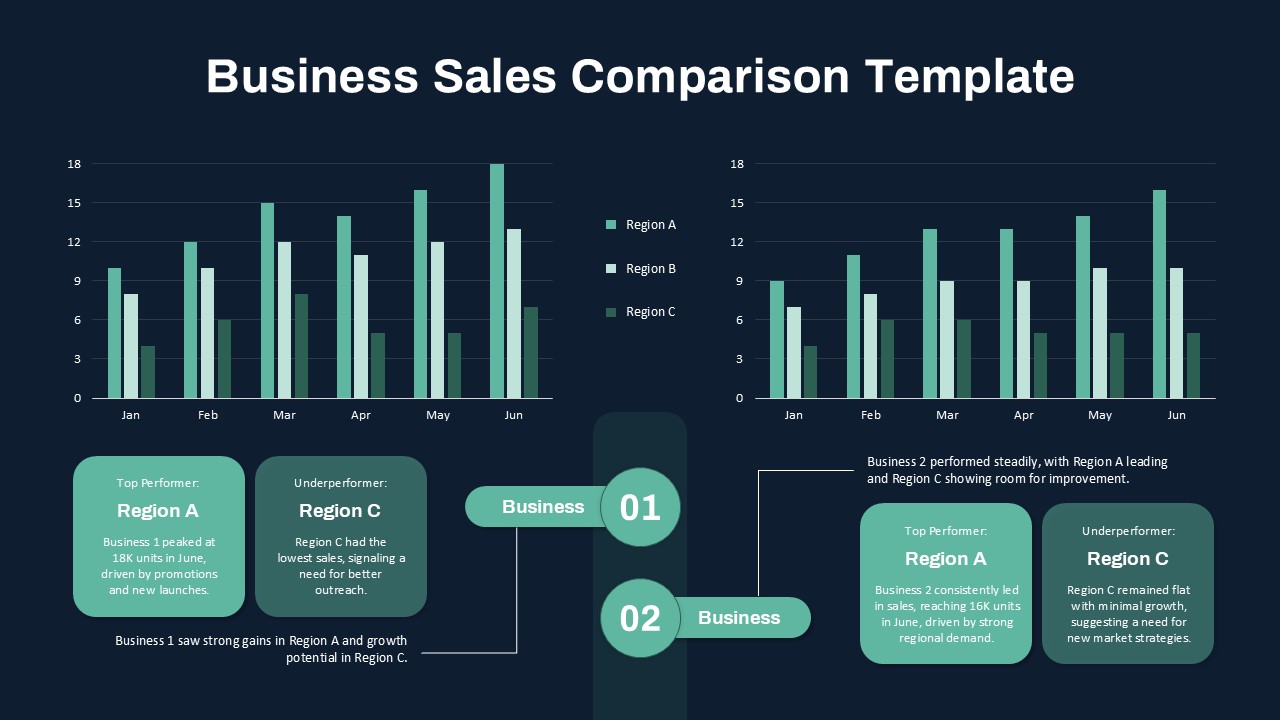
- Quarterly sales comparison chart visualization
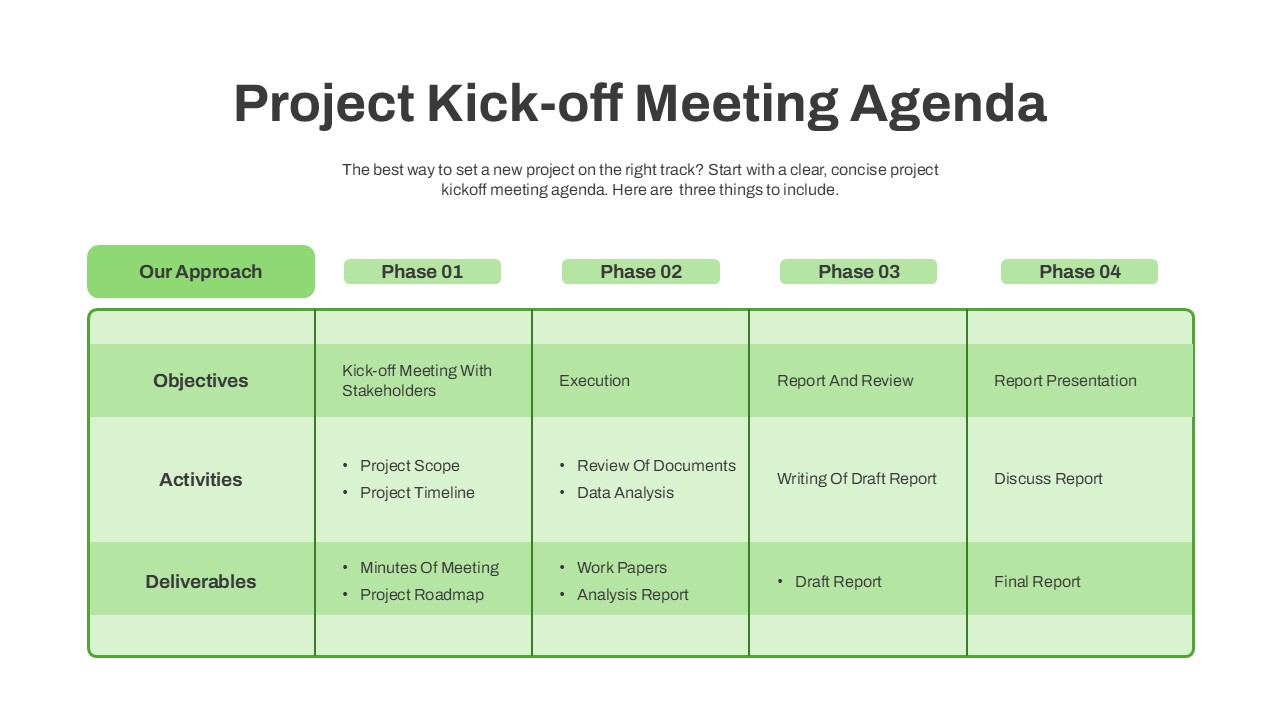
- Top deals and performance ranking table
- Product category sales distribution chart
- Fully editable text, charts, and data fields
- Compatible with PowerPoint and Google Slides
- Suitable for executive and management reporting
Why use this template
- Present multiple business metrics on a single slide
- Improve data visualization and stakeholder understanding
- Support executive decision-making with clear reporting
- Save time when creating business review presentations
- Deliver professional and data-driven reports
- Simplify performance tracking and trend analysis
Who is it for
Business executives, sales managers, financial analysts, operations teams, consultants, marketing leaders, department heads, startup founders, and corporate reporting professionals.
See more

Aspect Ratio
16:9Item ID
SKT04479
FAQs
You May Also Like These Presentation Templates


- Free

- Free
- Free
- Free
- Free
- Free