Finance Budget Dashboard for PowerPoint & Google Slides
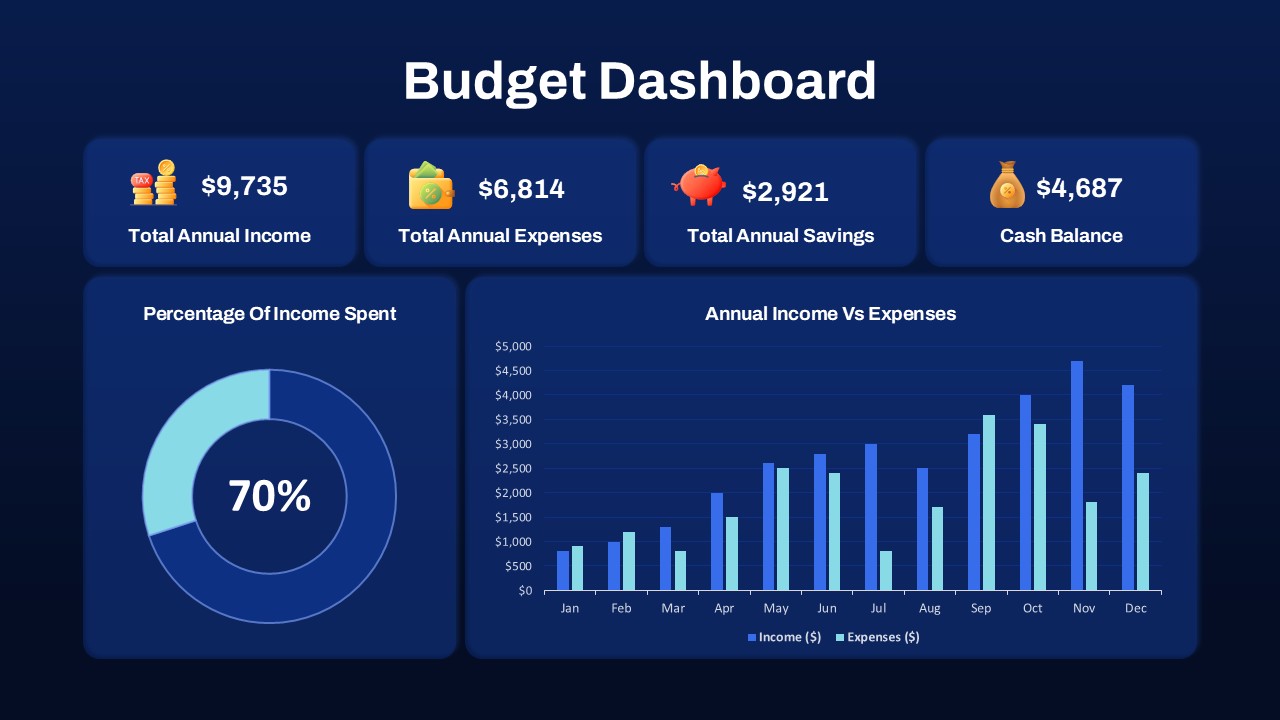
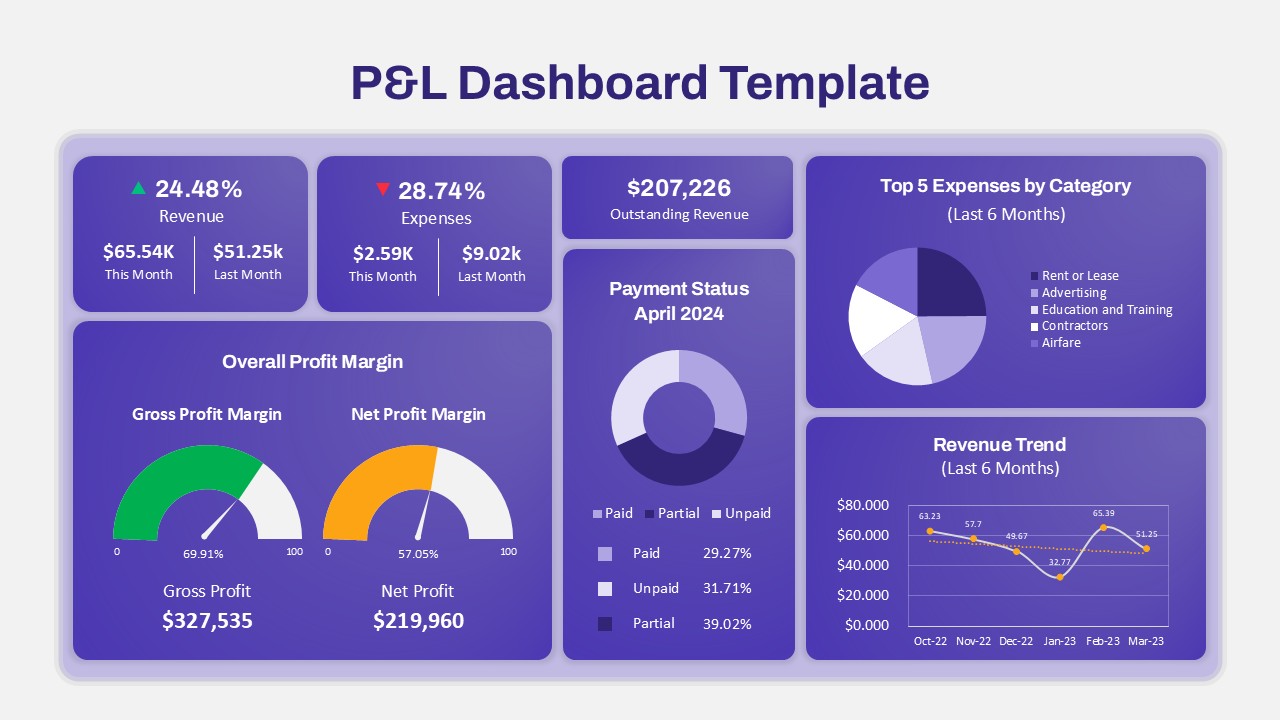
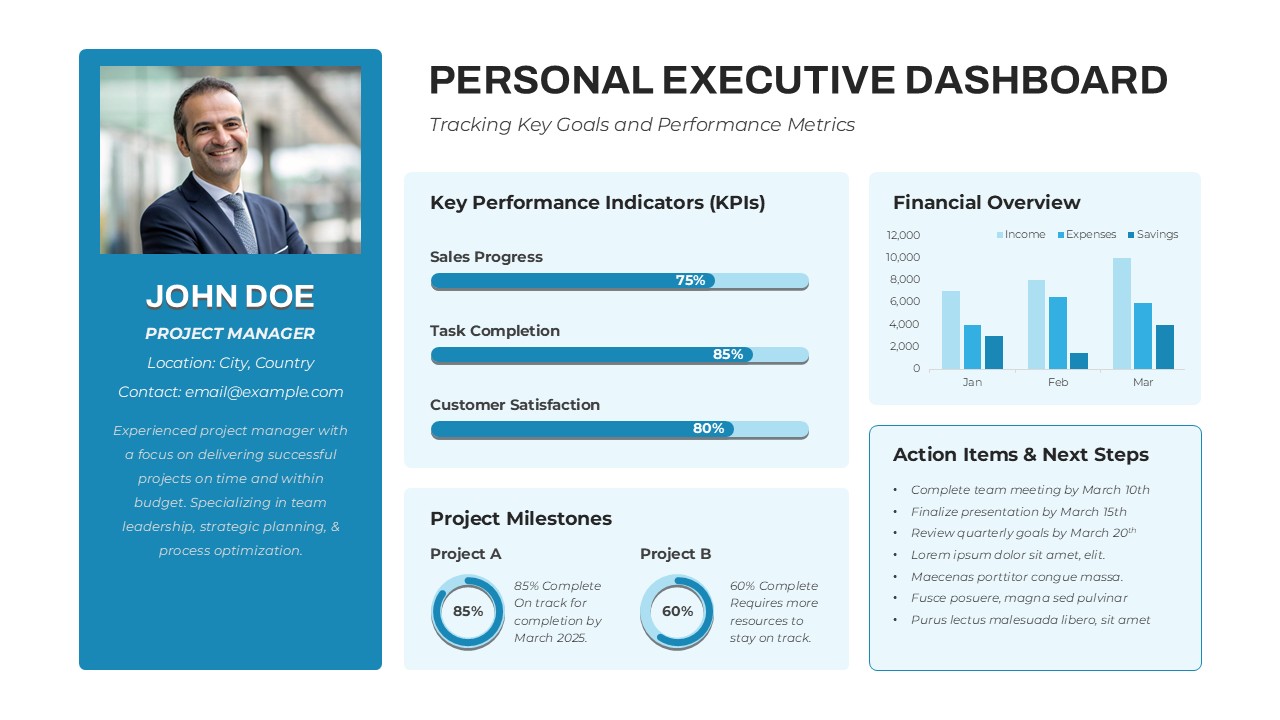
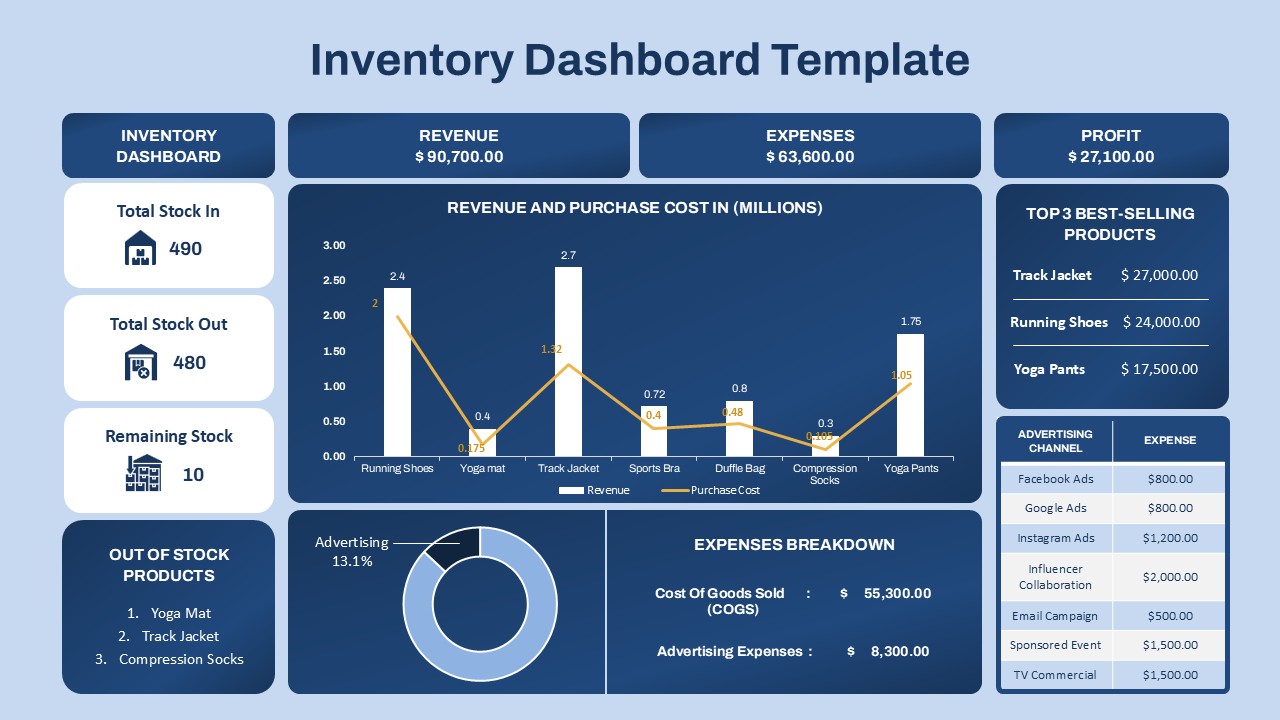
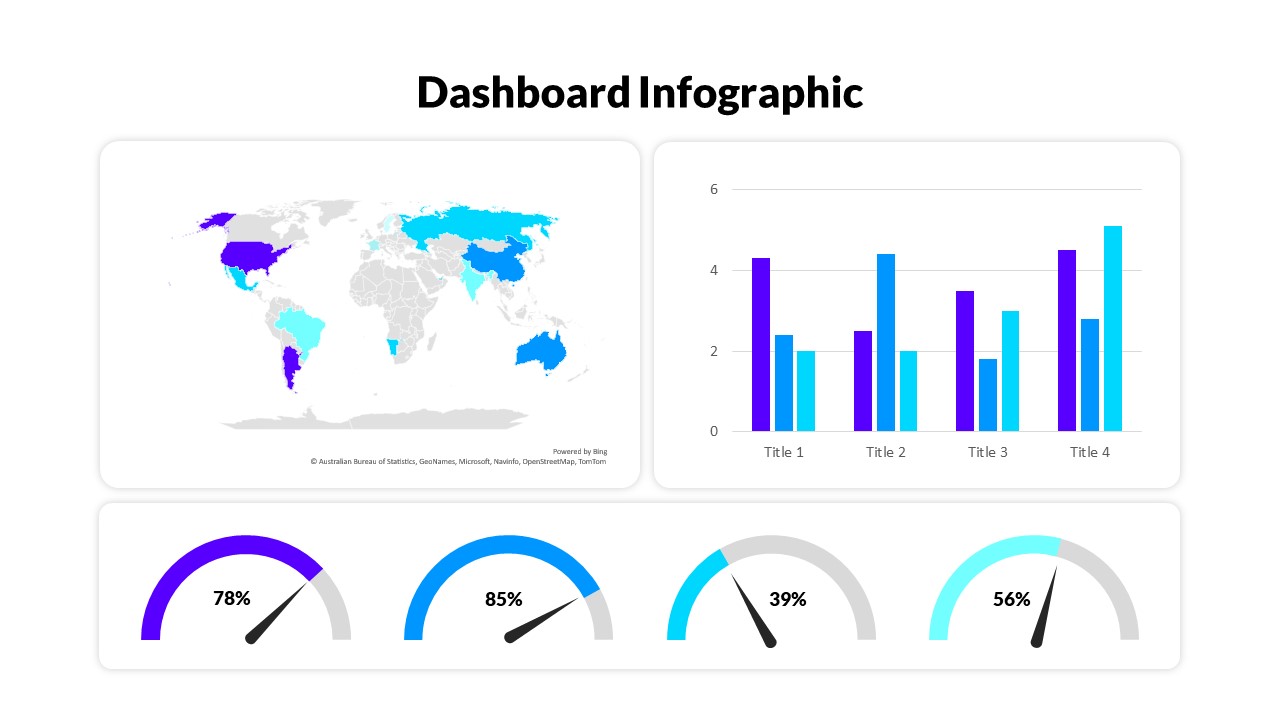
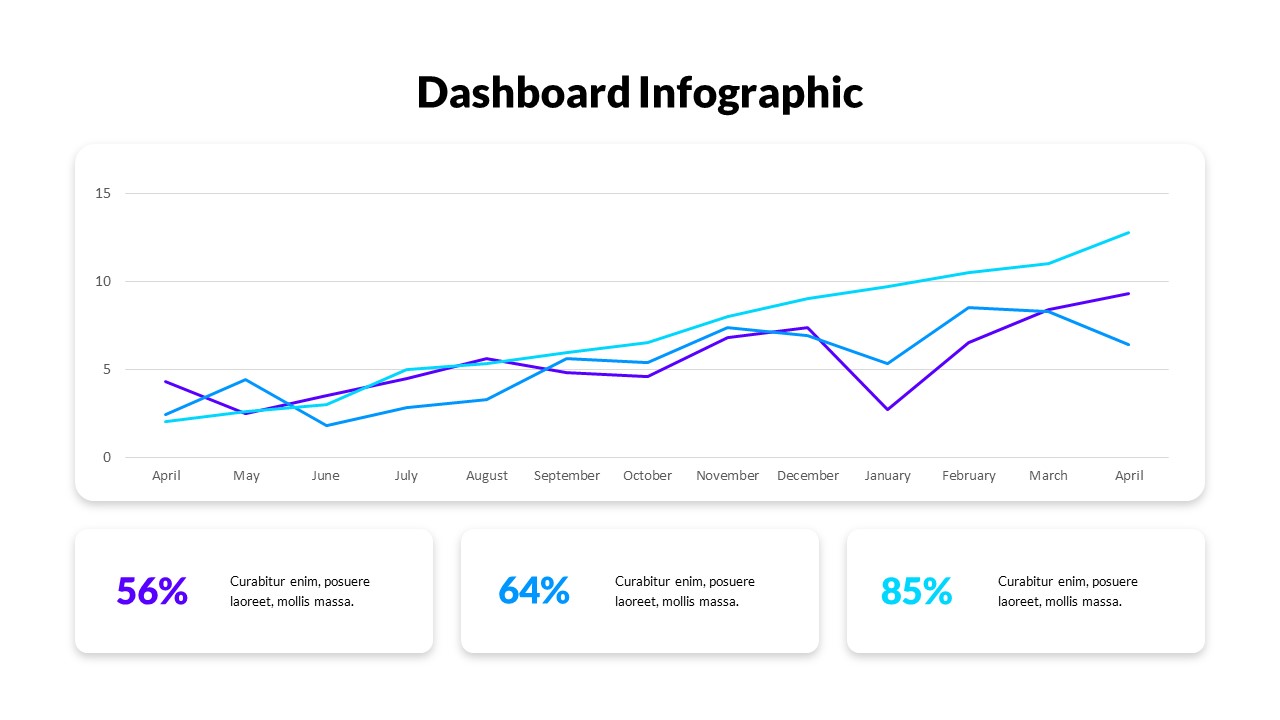
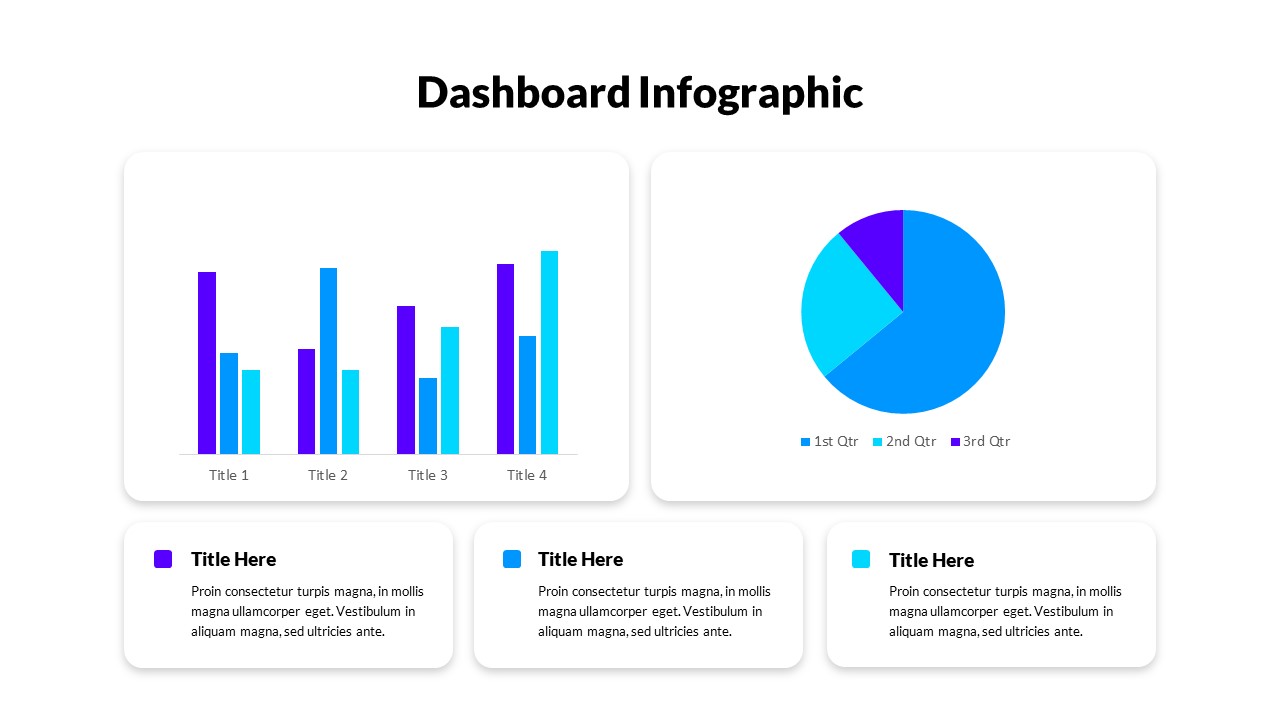
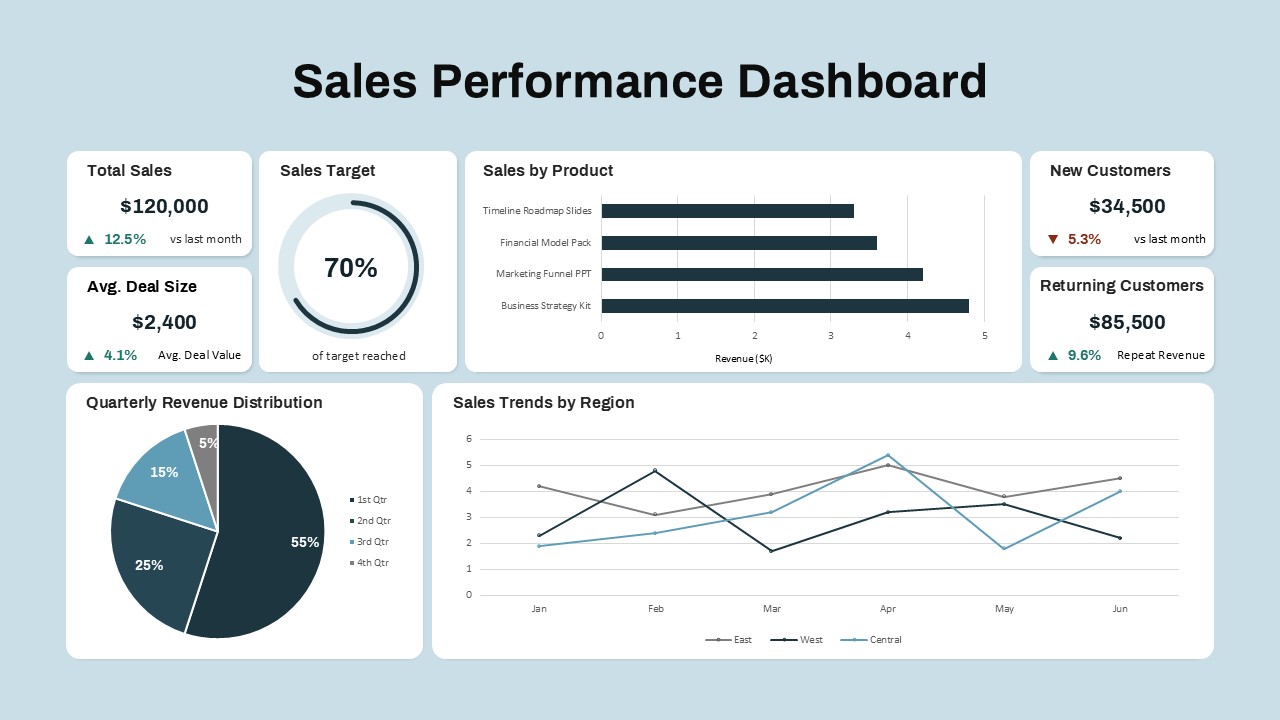
This budget dashboard template offers a sleek, data-rich interface to visualize personal or organizational finances in a single glance. The slide displays four key financial metrics—Total Annual Income, Expenses, Savings, and Cash Balance—highlighted in individual color-coded cards for fast reference. Supporting charts include a donut graph showing “Percentage of Income Spent” and a monthly bar graph comparing income versus expenses, offering intuitive insights into spending patterns and financial health across the year.
Crafted with a modern dark blue theme, this dashboard enhances clarity and contrast, ensuring numbers and charts stand out prominently. The vector-based icons and well-aligned grid layout provide a polished, professional aesthetic that is fully customizable. Users can easily adjust values, swap colors, or replace icons without disrupting the overall structure. This makes it ideal for real-time financial reviews, budget presentations, or year-end summaries.
Optimized for both PowerPoint and Google Slides, the layout maintains formatting integrity across platforms. Whether presenting to clients, stakeholders, or internal teams, this dashboard streamlines financial storytelling and decision-making by condensing critical data into a visually appealing, single-slide summary.
See more

Aspect Ratio
16:9Item ID
SKT04069
FAQs
You May Also Like These Presentation Templates


- Free

- Free
- Free

- Free

- Free
- Free
- Free
- Free
- Free
- Free

- Free

- Free
- Free
- Free