Colorful RAG Project Status Dashboard Template for PowerPoint & Google Slides
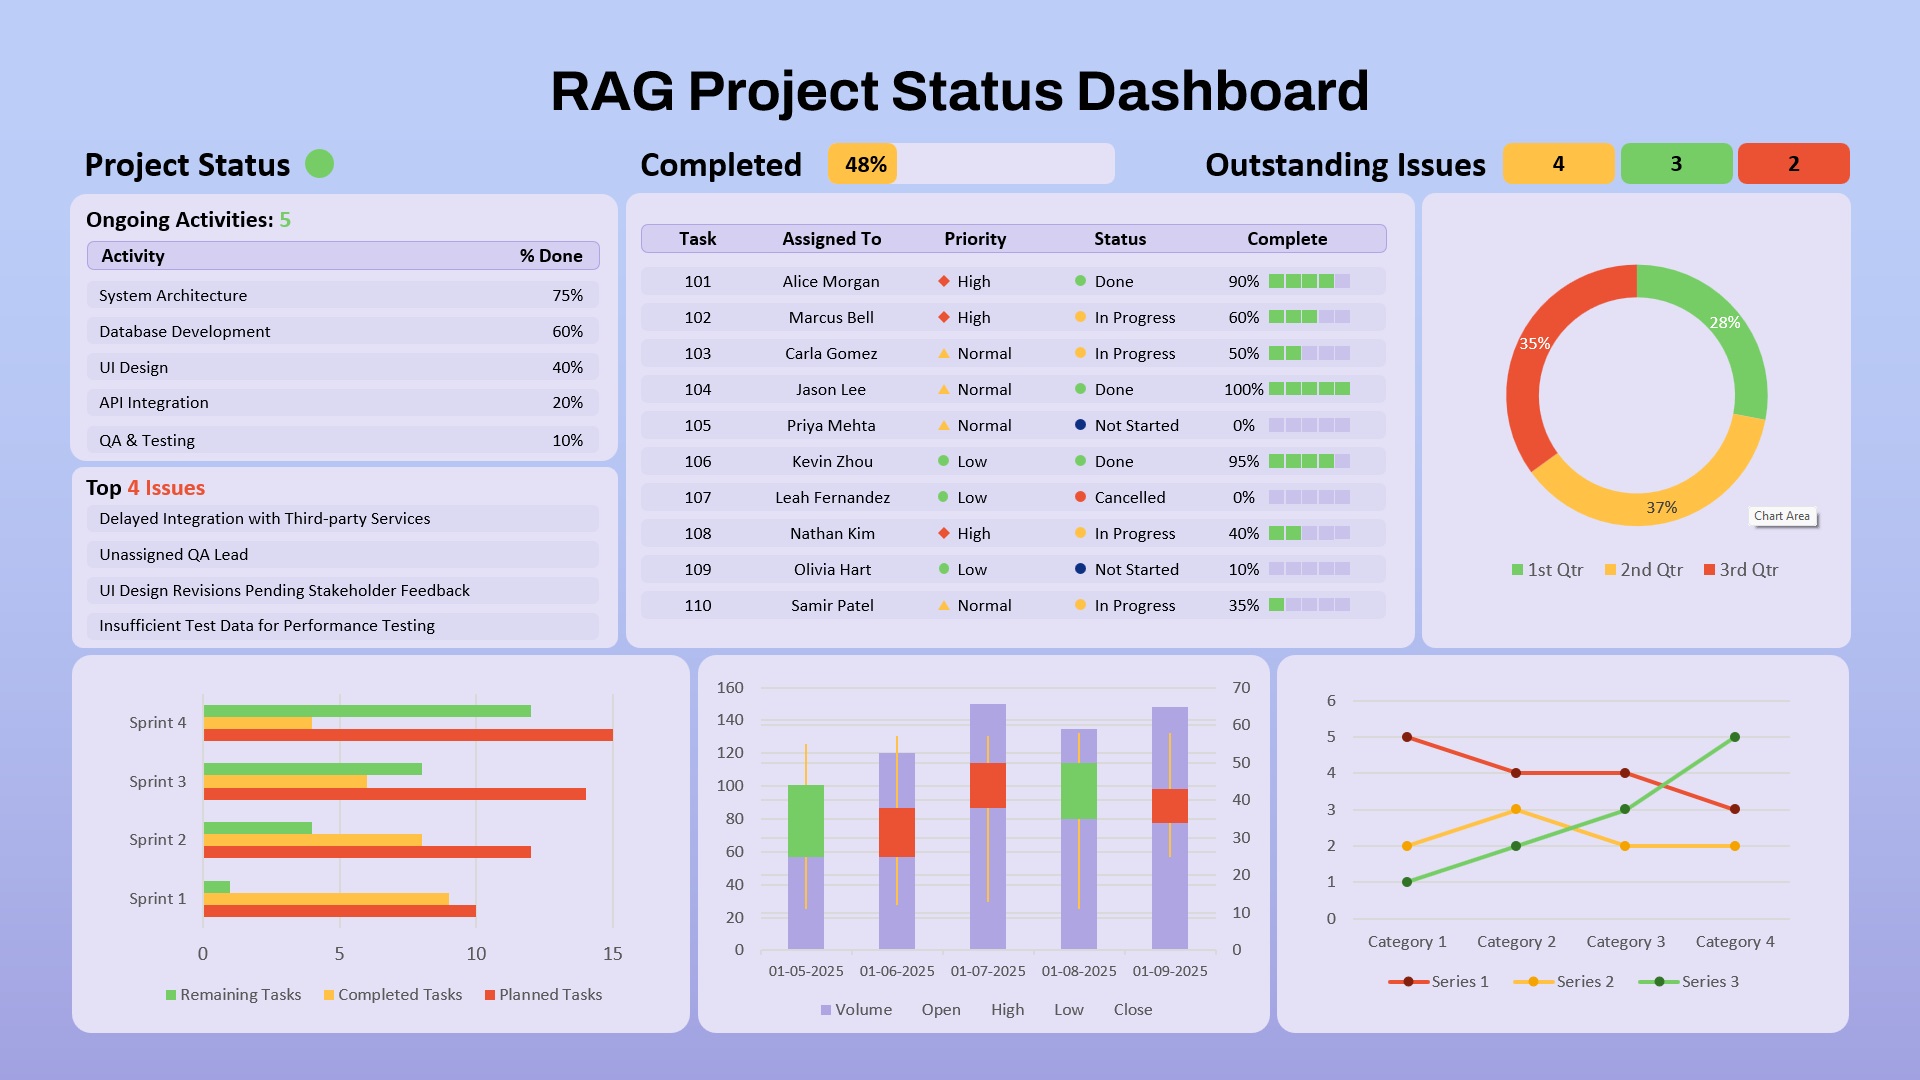
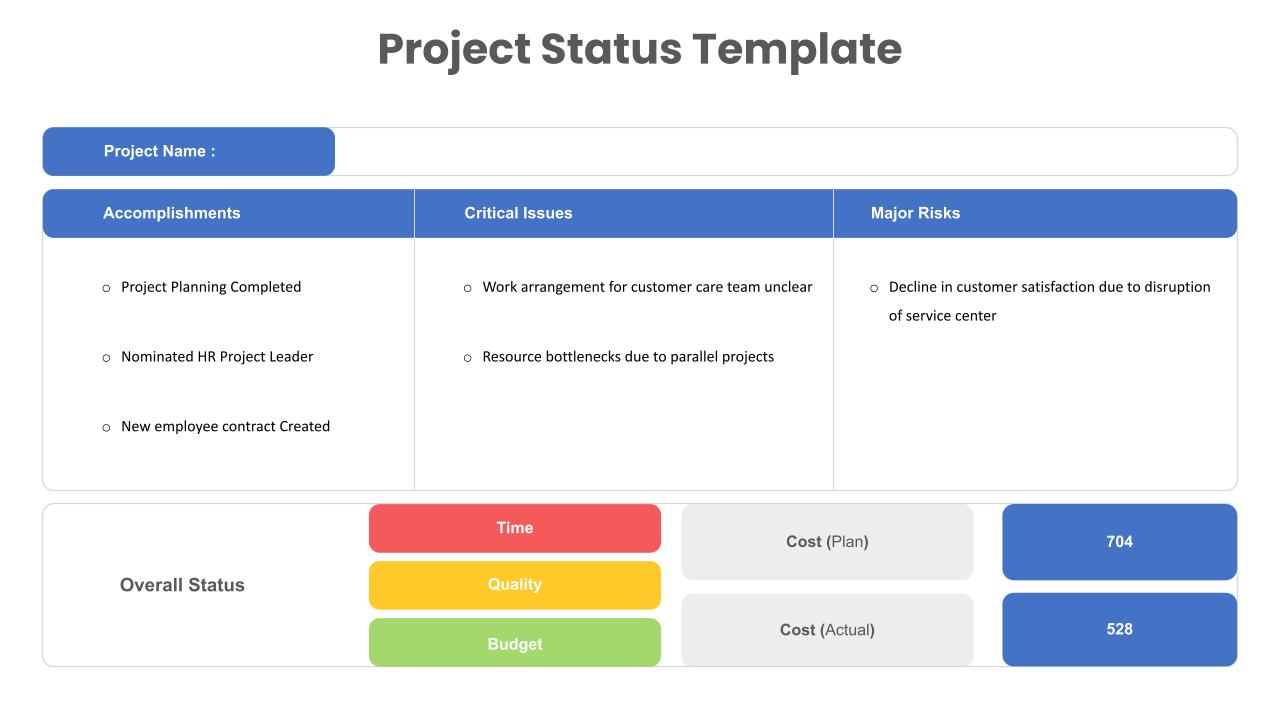
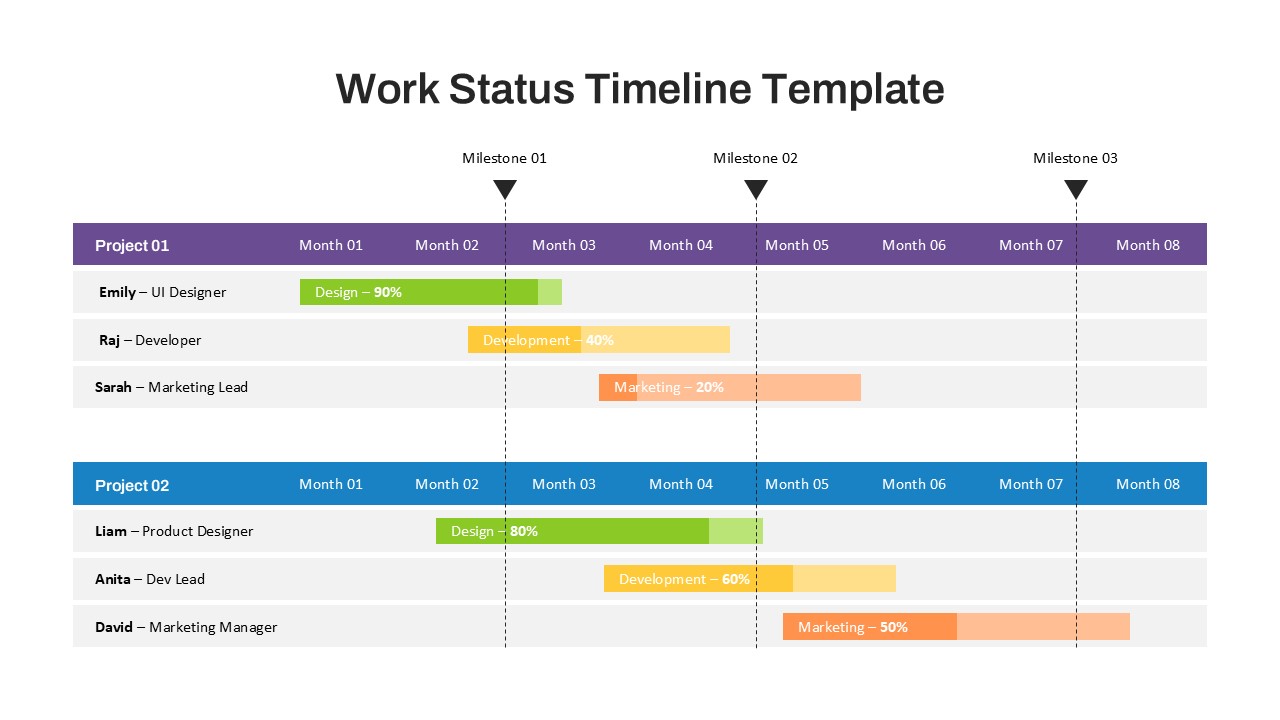
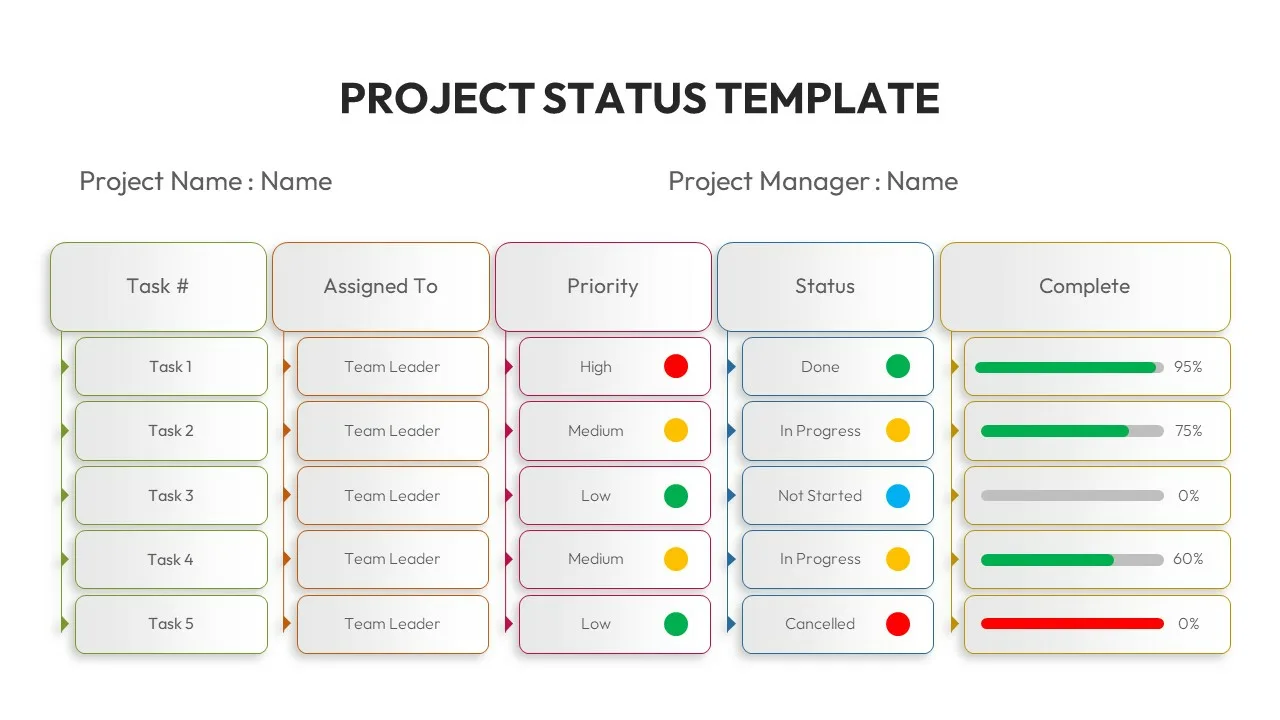
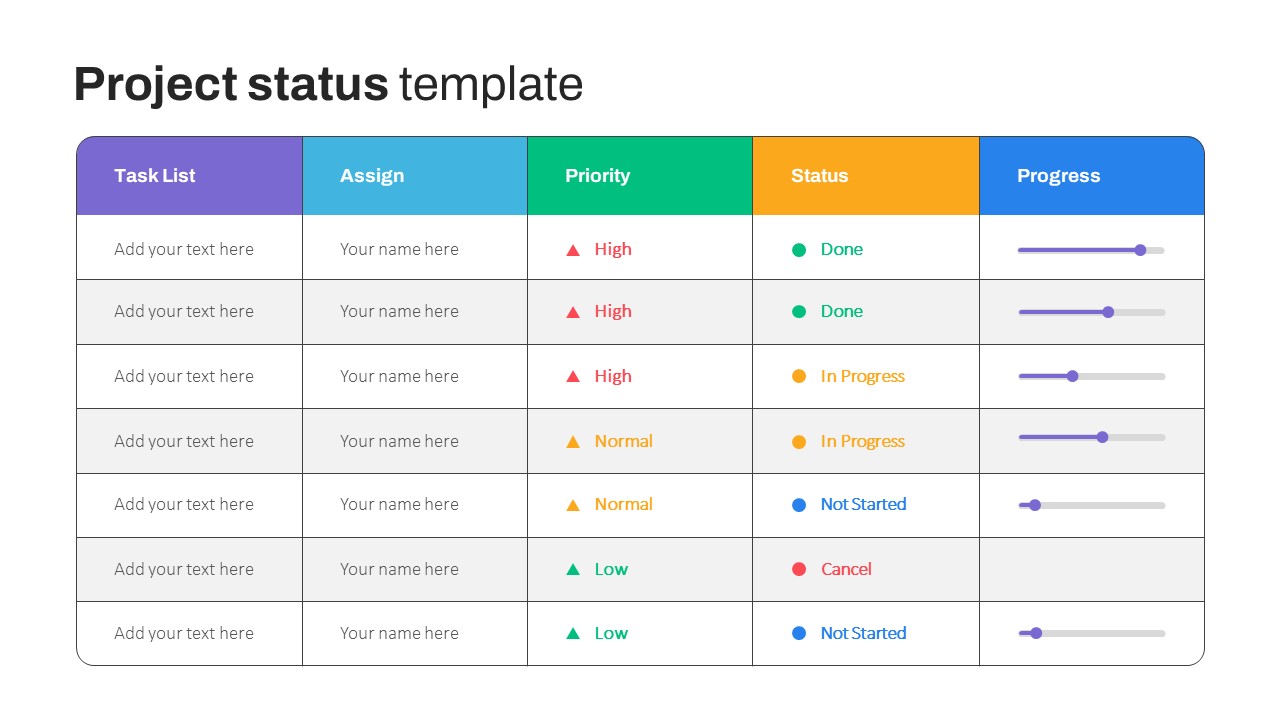
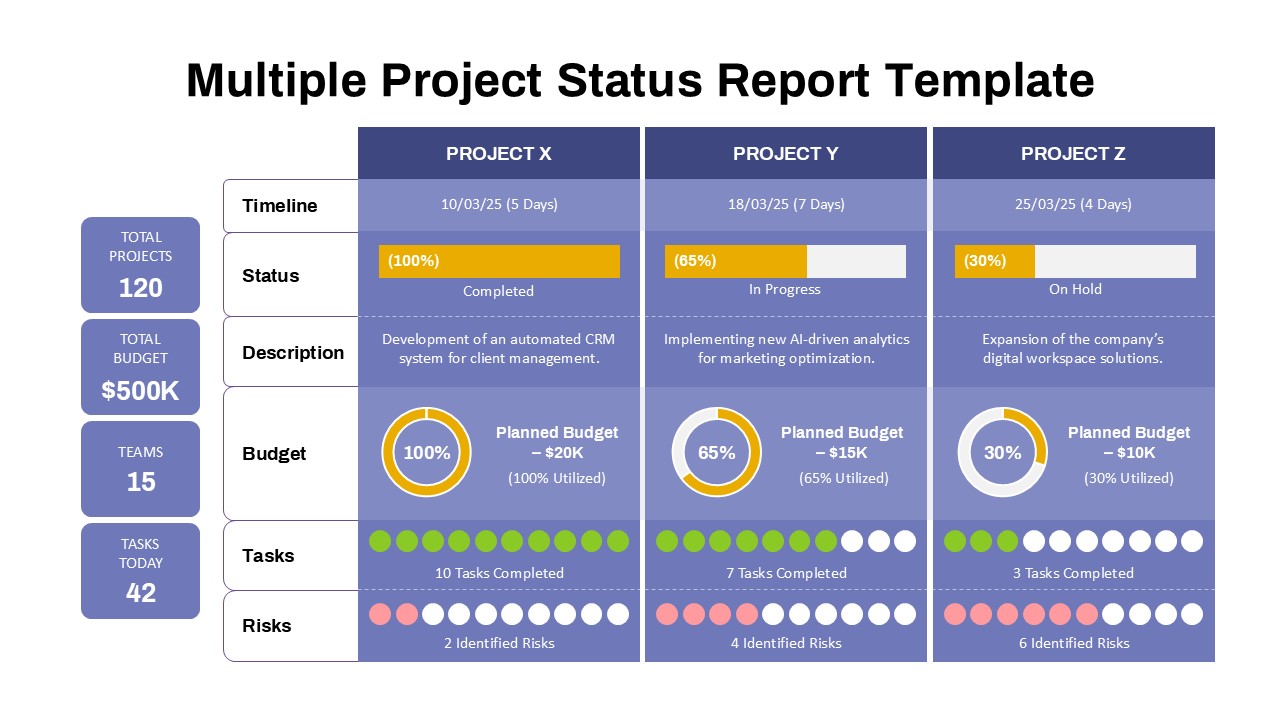
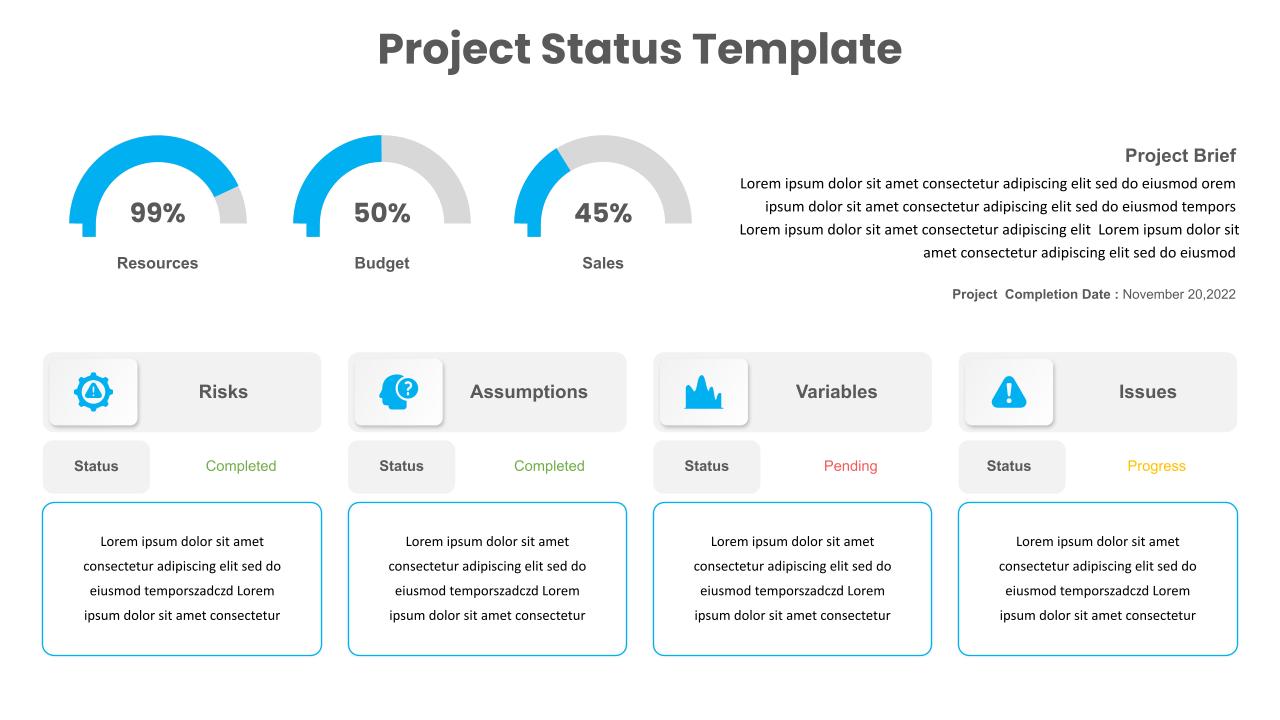
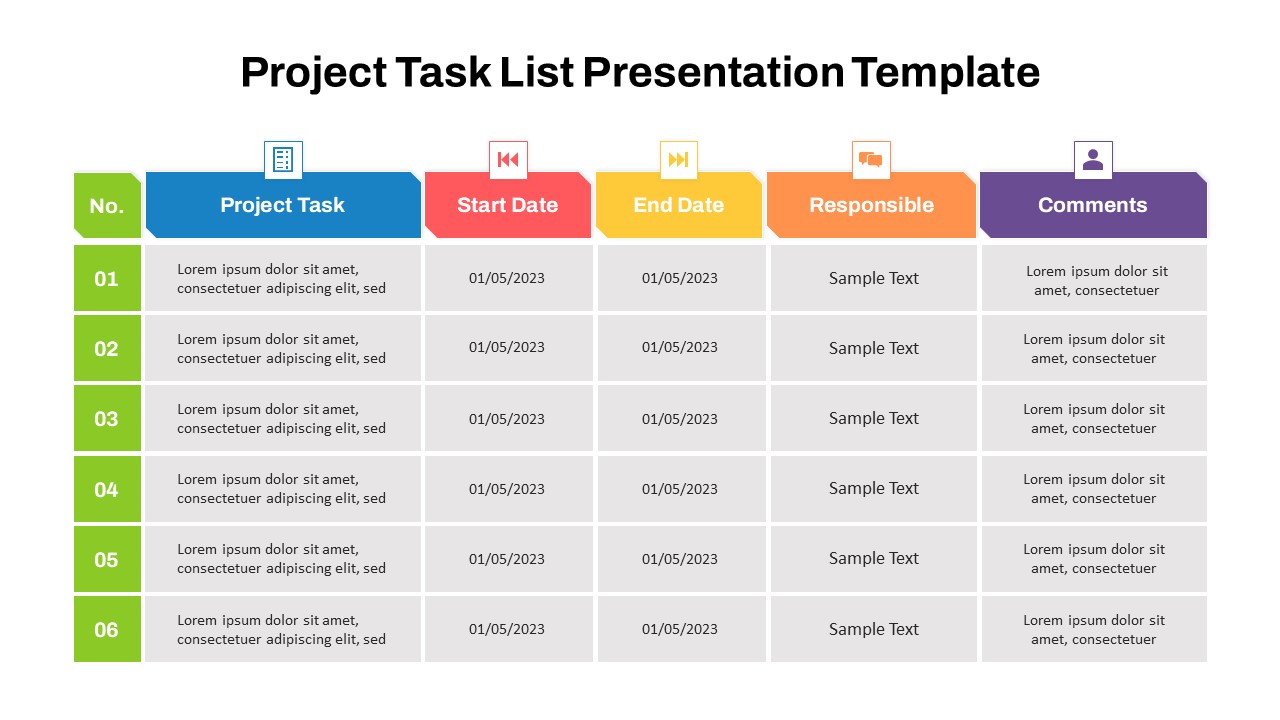
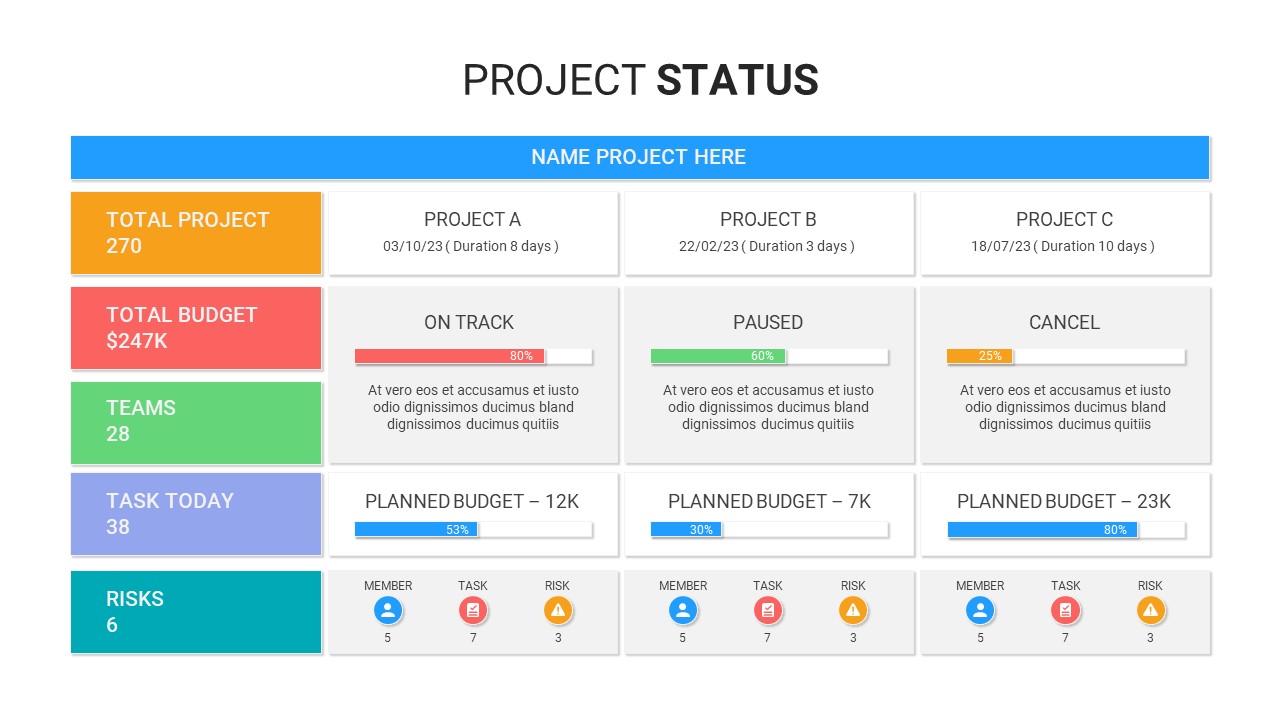
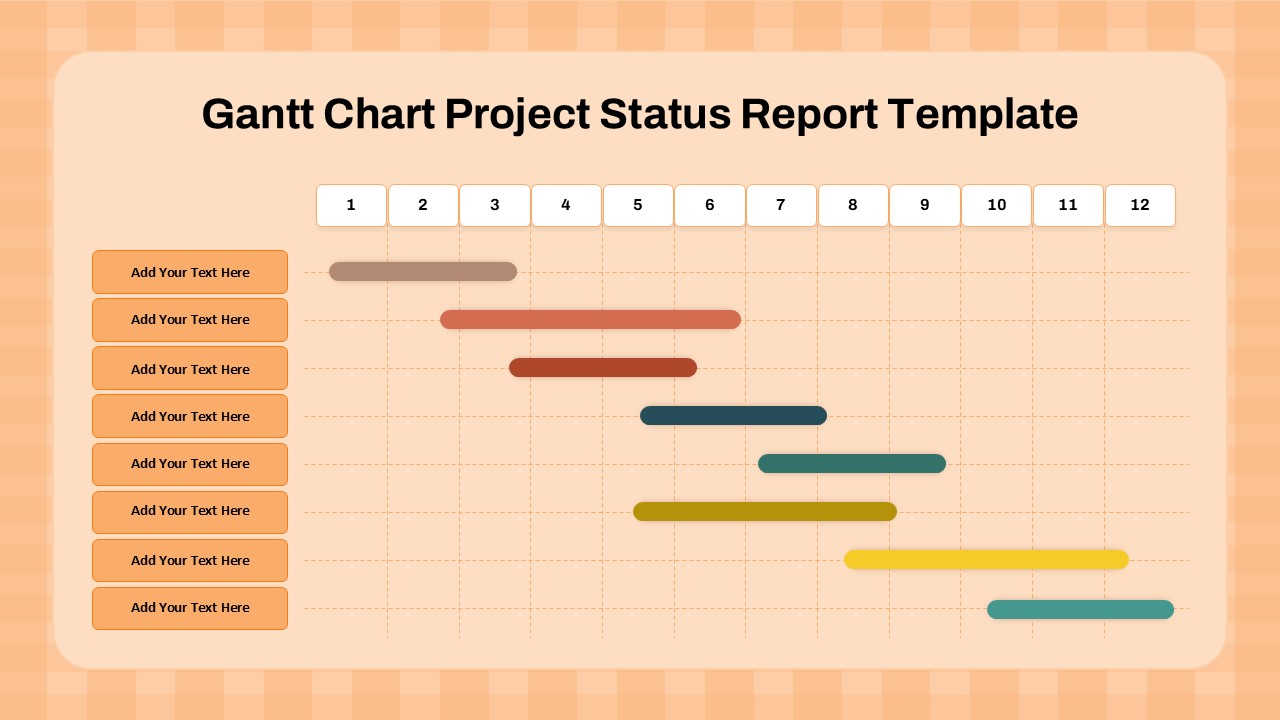
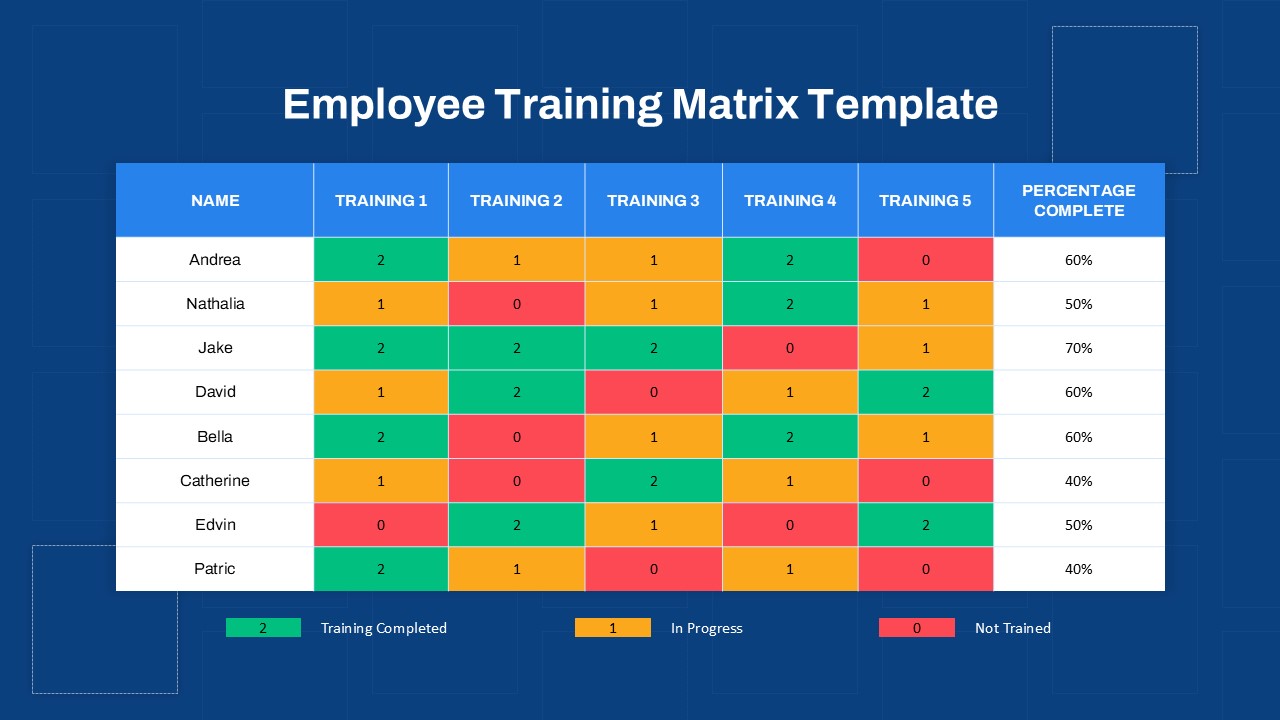
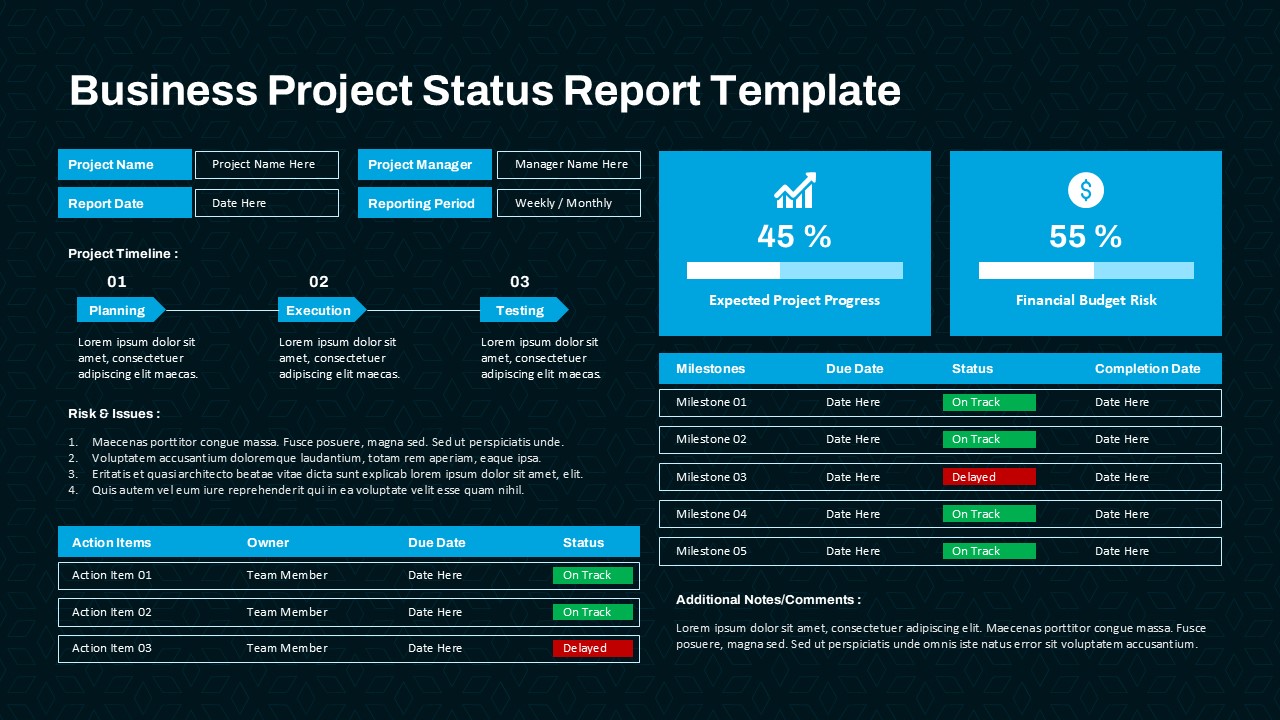
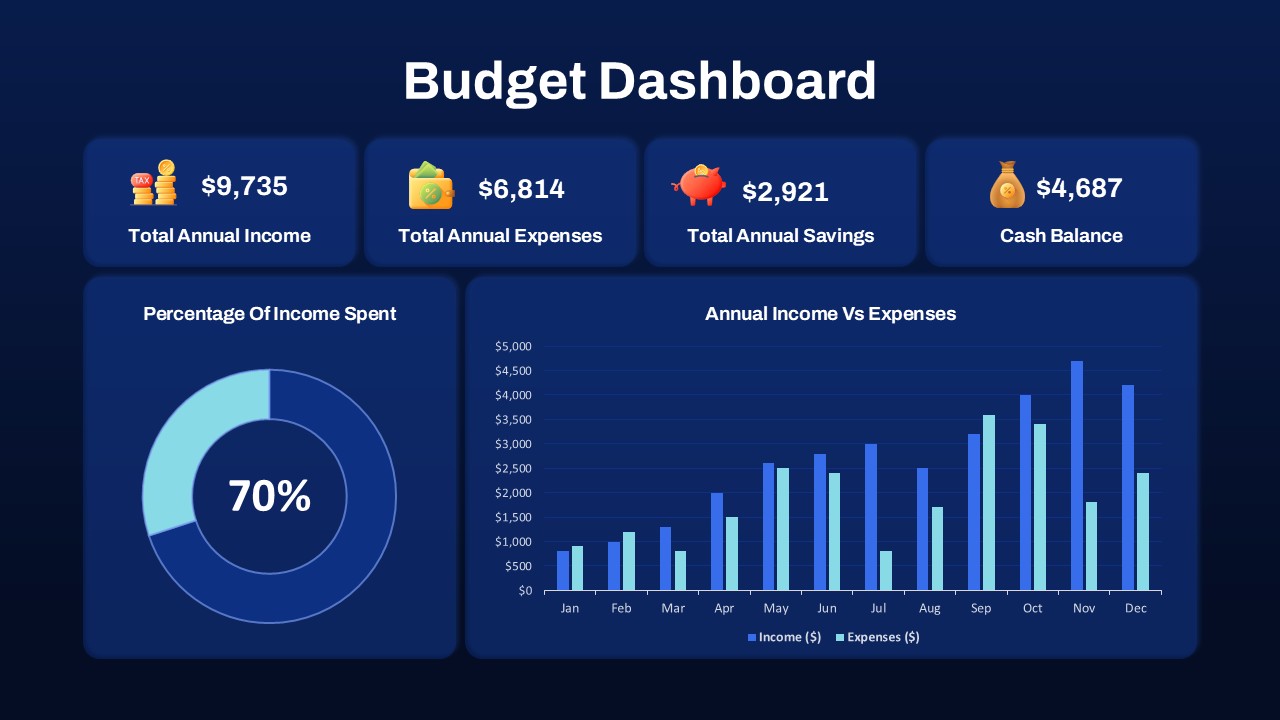
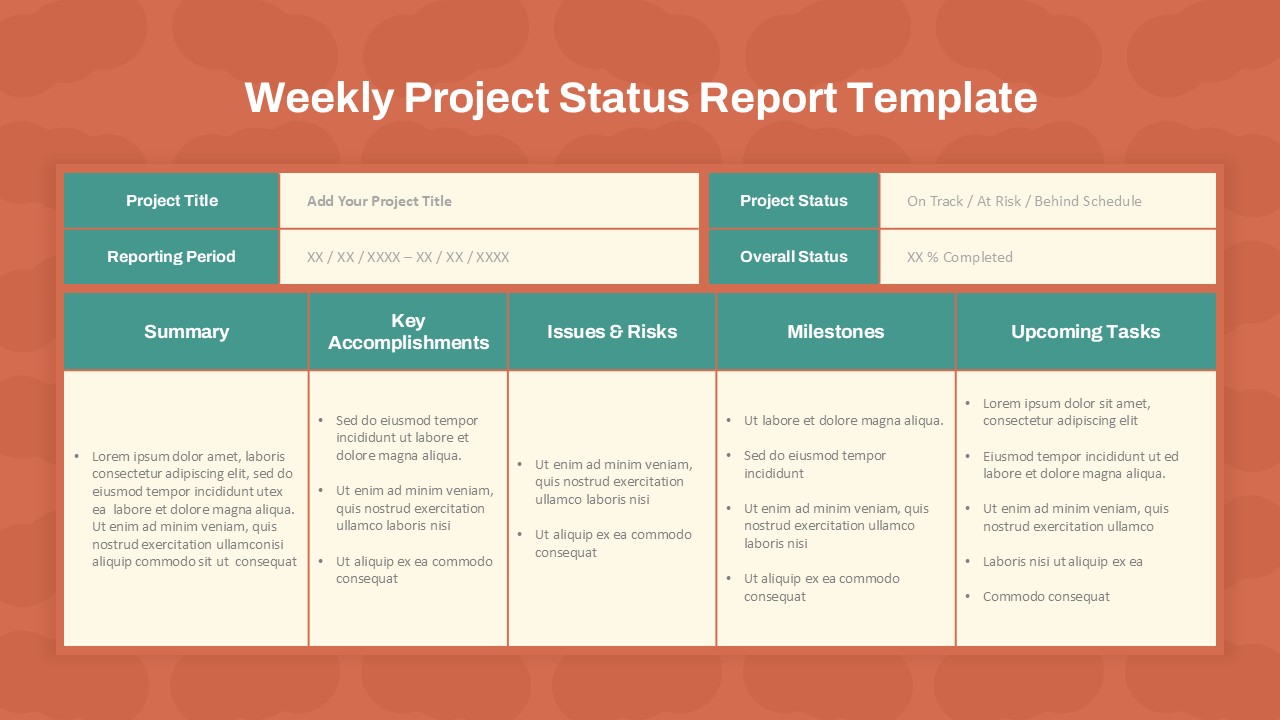
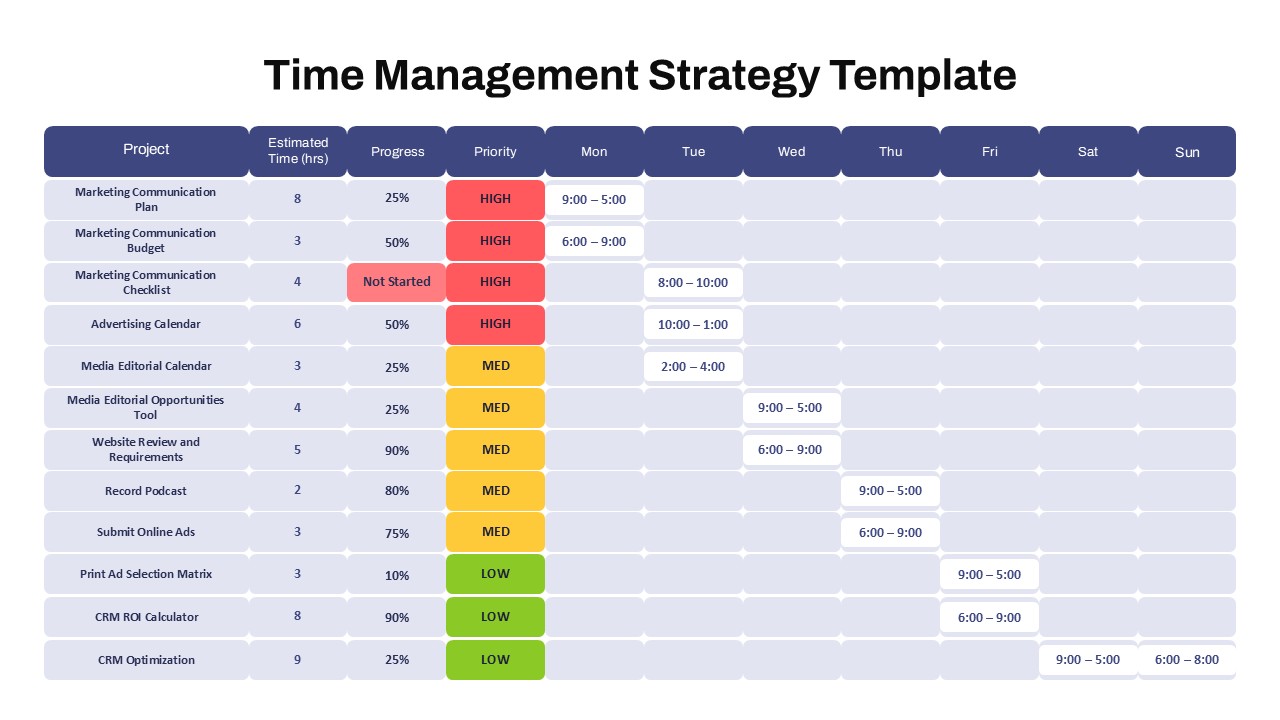
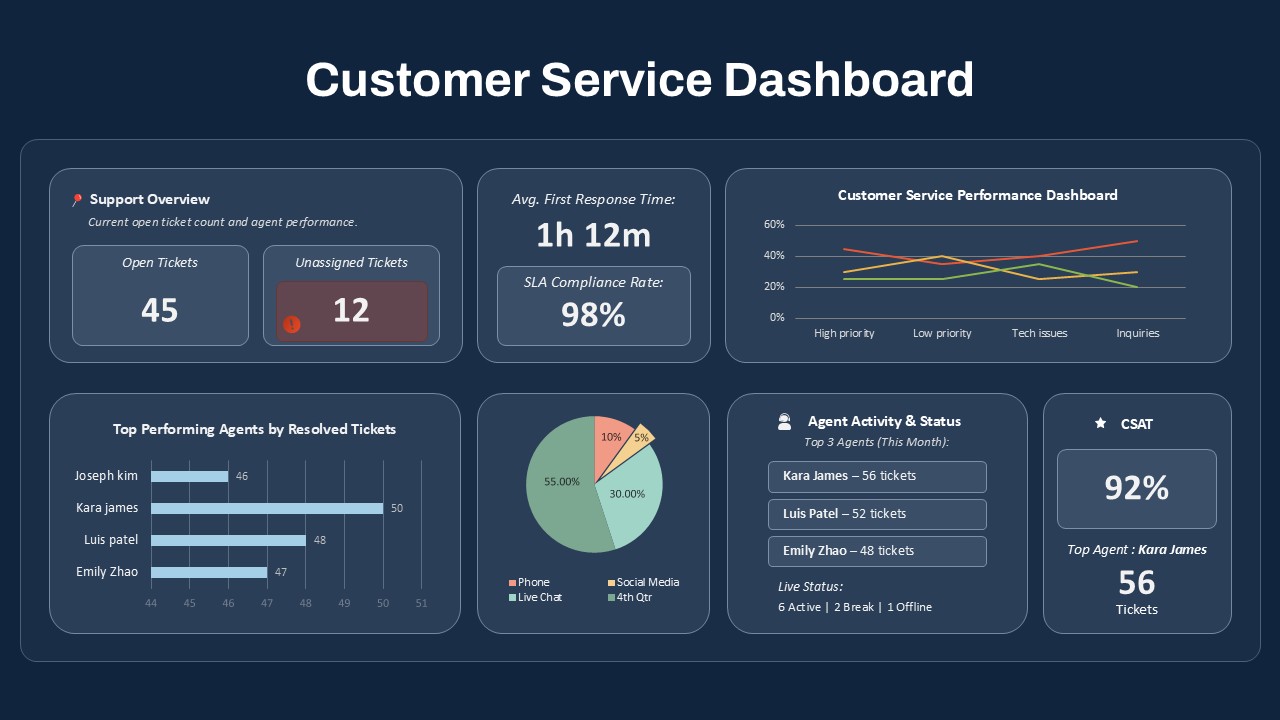
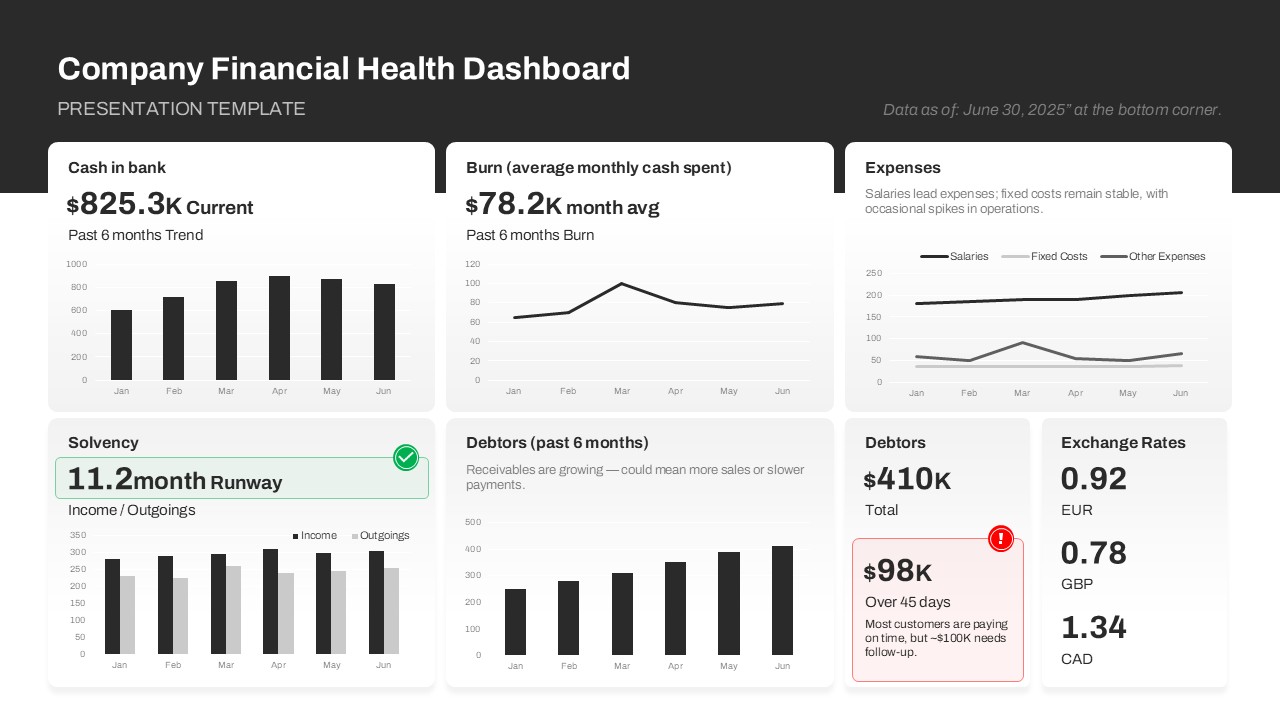
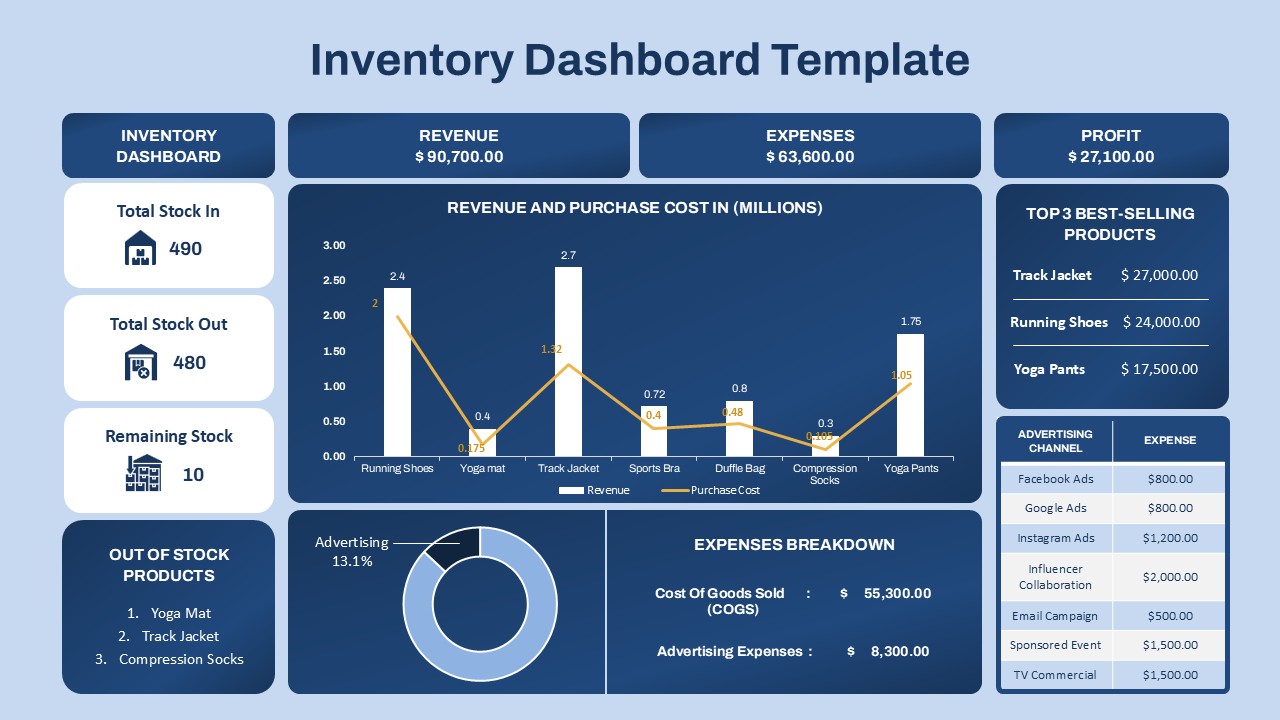
Visualize your project’s health and progress with this Colorful RAG Project Status Dashboard. Using the Red-Amber-Green (RAG) methodology, this comprehensive slide presents real-time metrics in a compact, visually intuitive layout. The top section highlights overall completion (48%), issue count by severity, and a quick project status indicator. Five core activities are tracked with completion percentages, while a task breakdown matrix outlines individual assignments, priorities, statuses, and progress bars for clear accountability.
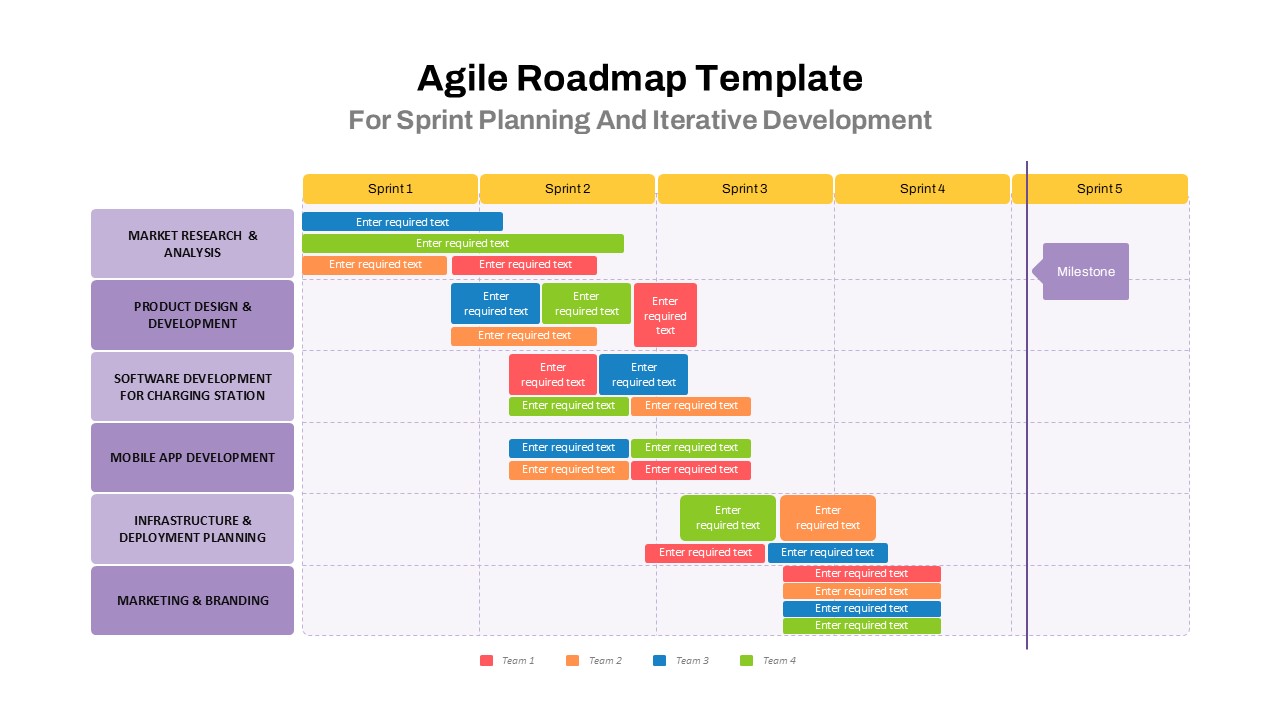
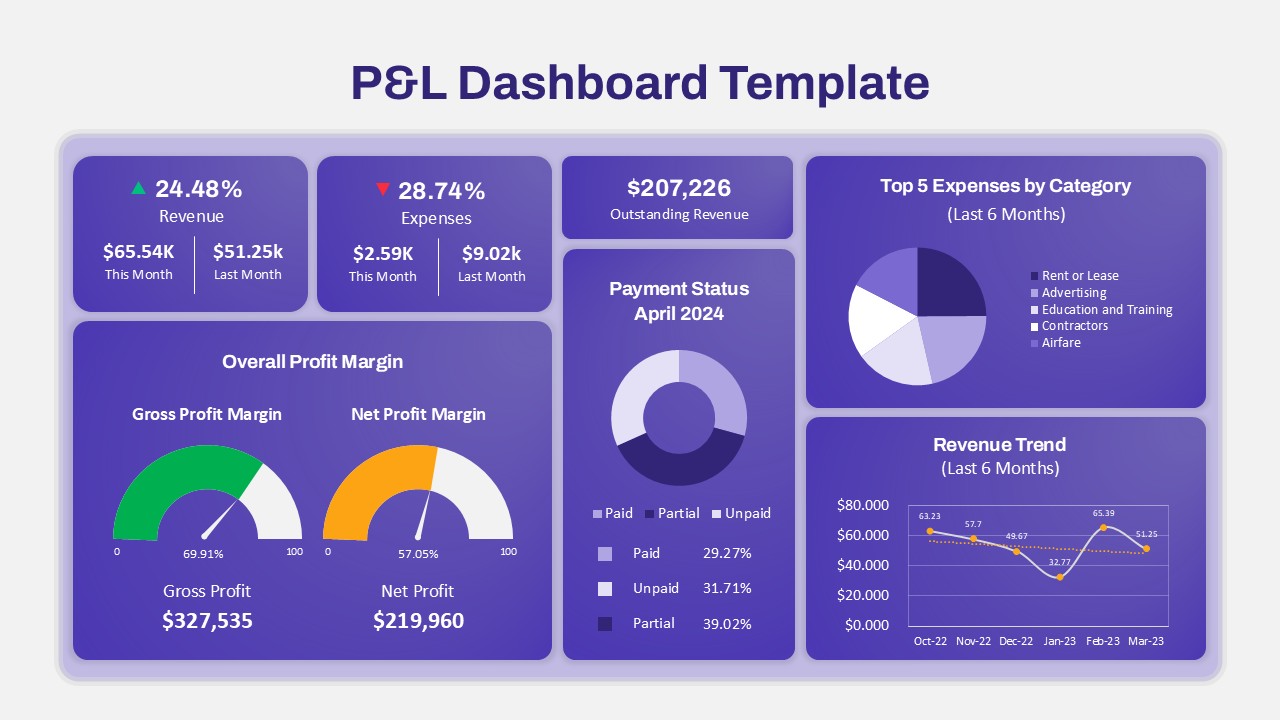
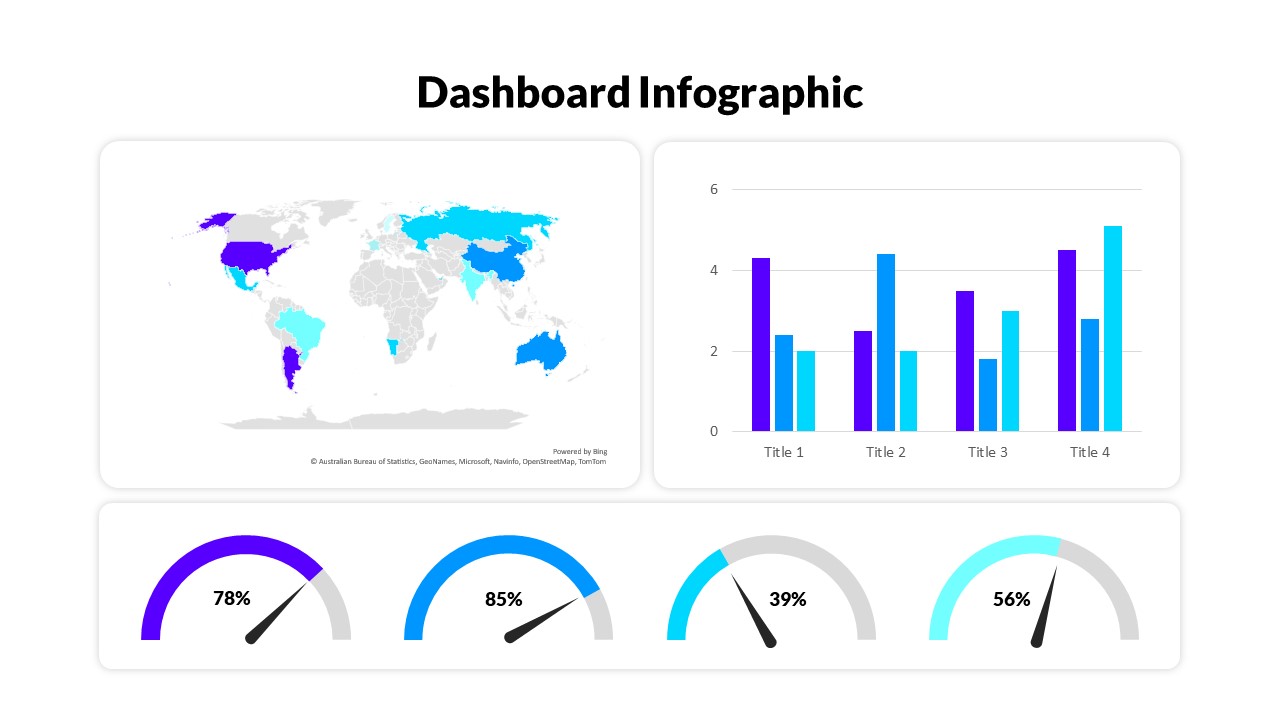
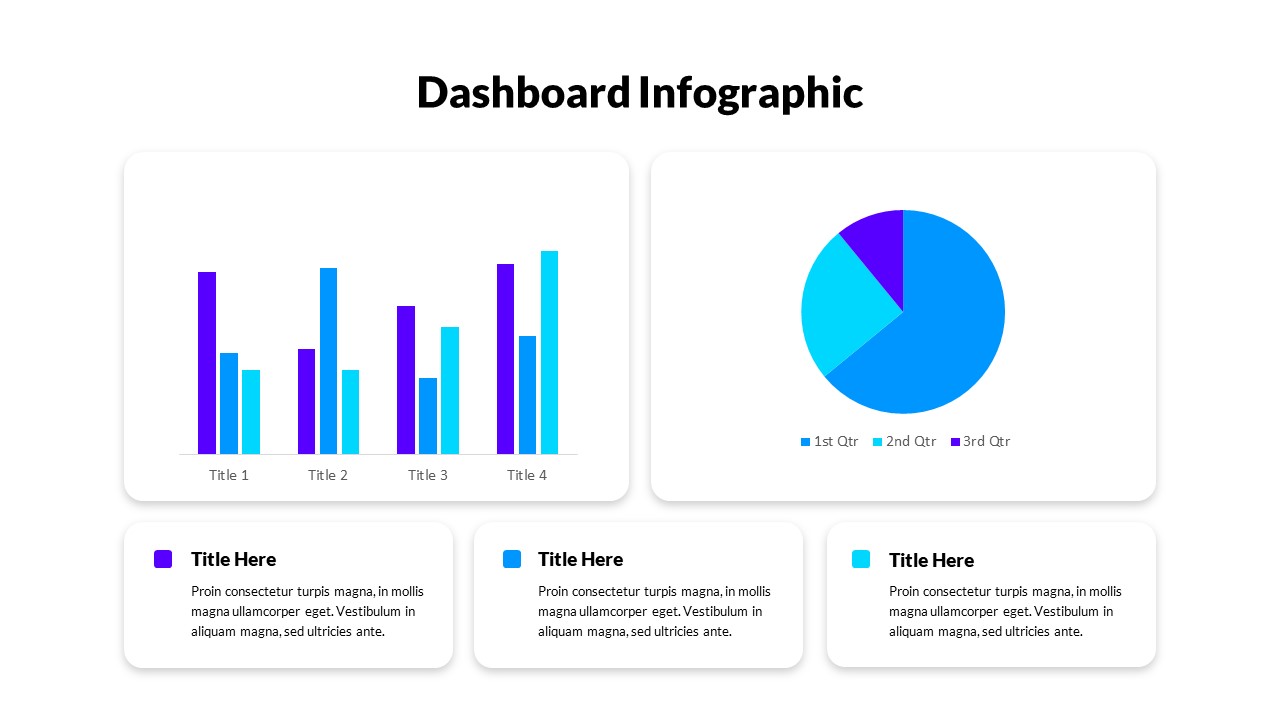
The dashboard includes four additional visualization tools: a donut chart showing quarterly task distribution, a bar chart comparing sprint performance (planned vs. completed vs. remaining), a candlestick chart for time-series task data, and a line graph tracking trends across categories. A “Top 4 Issues” list ensures critical risks are front and center. Every visual element is color-coded for instant readability, making it easy to identify bottlenecks, monitor task owners, and support agile workflows.
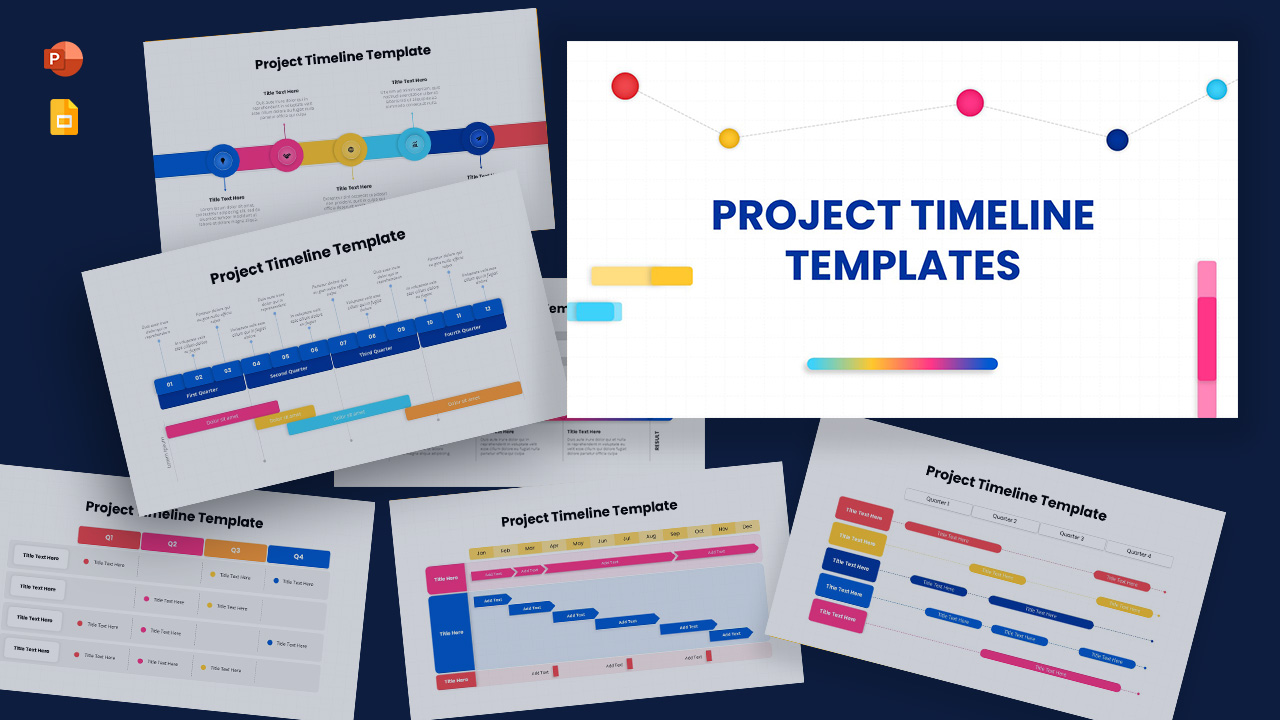
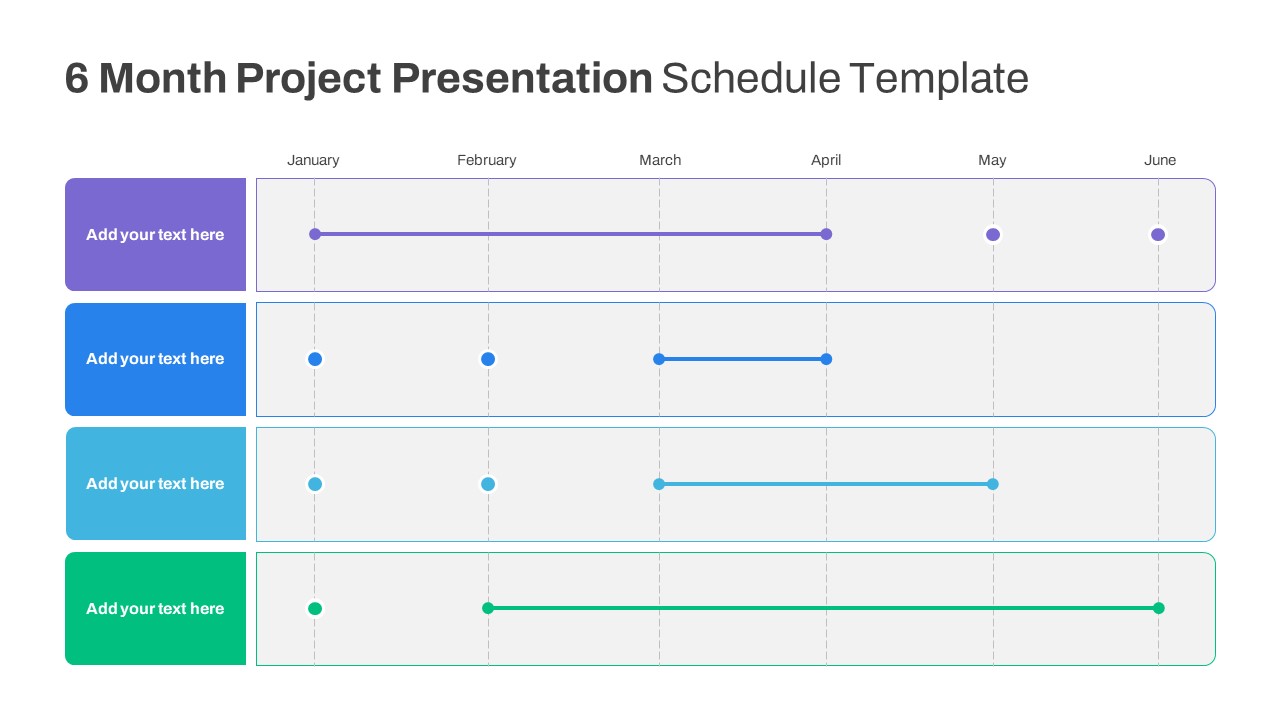
Fully editable and compatible with both PowerPoint and Google Slides, this template is ideal for weekly stand-ups, sprint reviews, executive updates, or stakeholder reporting. With its polished design and data-rich layout, it brings clarity to complex project dynamics while encouraging action-oriented decision-making.
See more

Aspect Ratio
16:9Item ID
SKT03896
Features of this template
Other Uses
Use this slide for cross-functional project tracking, internal performance reporting, strategic initiative updates, or quarterly portfolio reviews. It also supports use cases in IT, marketing, finance, and operations.
FAQs
You May Also Like These Presentation Templates


- Free
- Free

- Free

- Free
- Free
- Free

- Free