Smart City Monitoring Dashboard Slide for PowerPoint & Google Slides
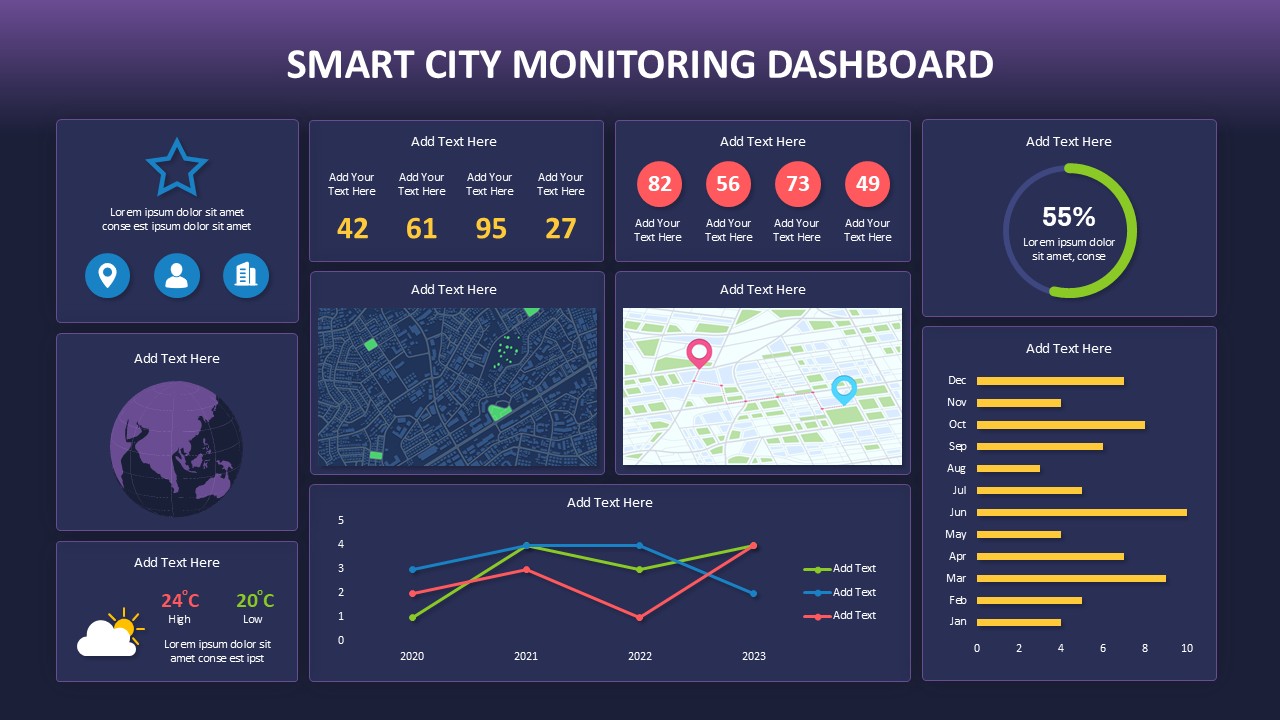
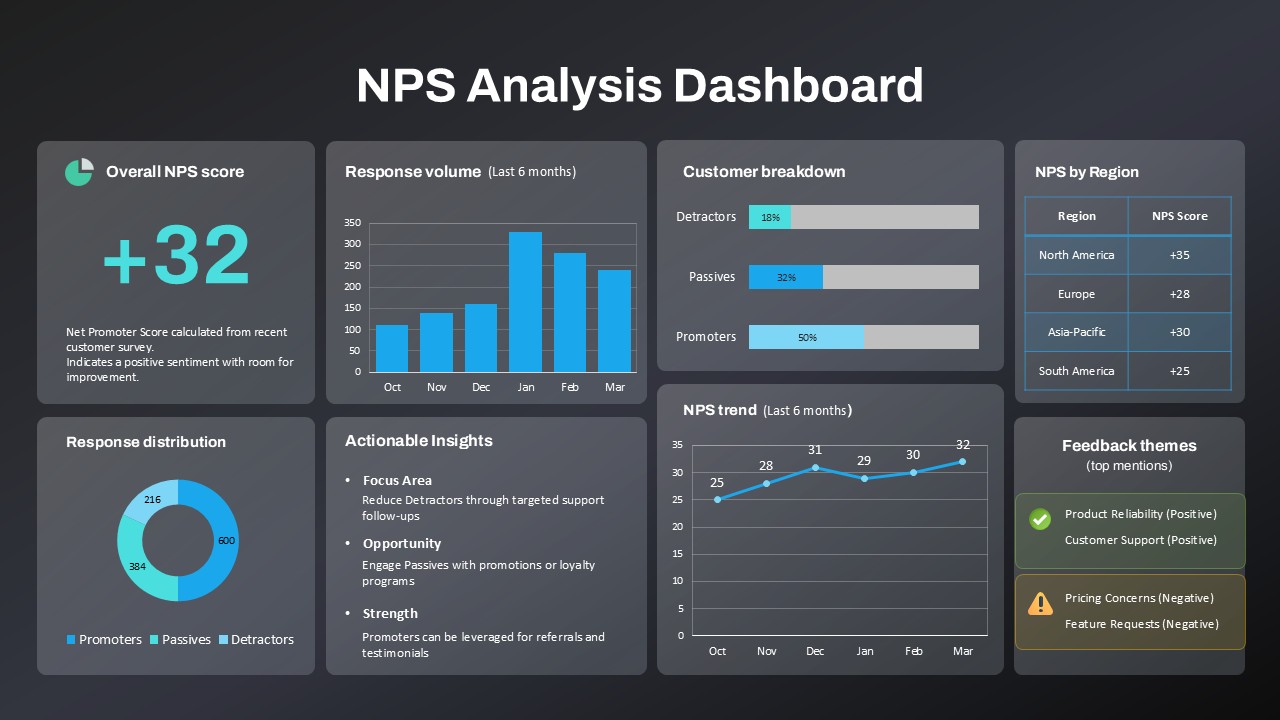
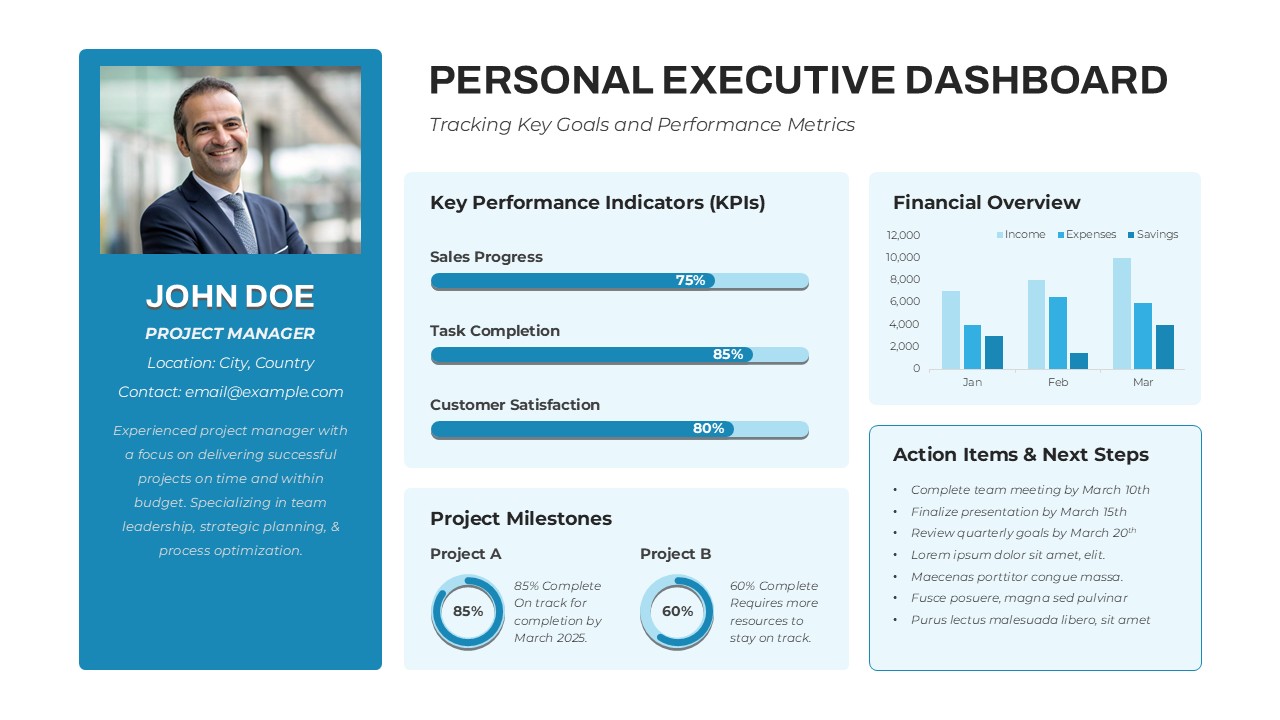
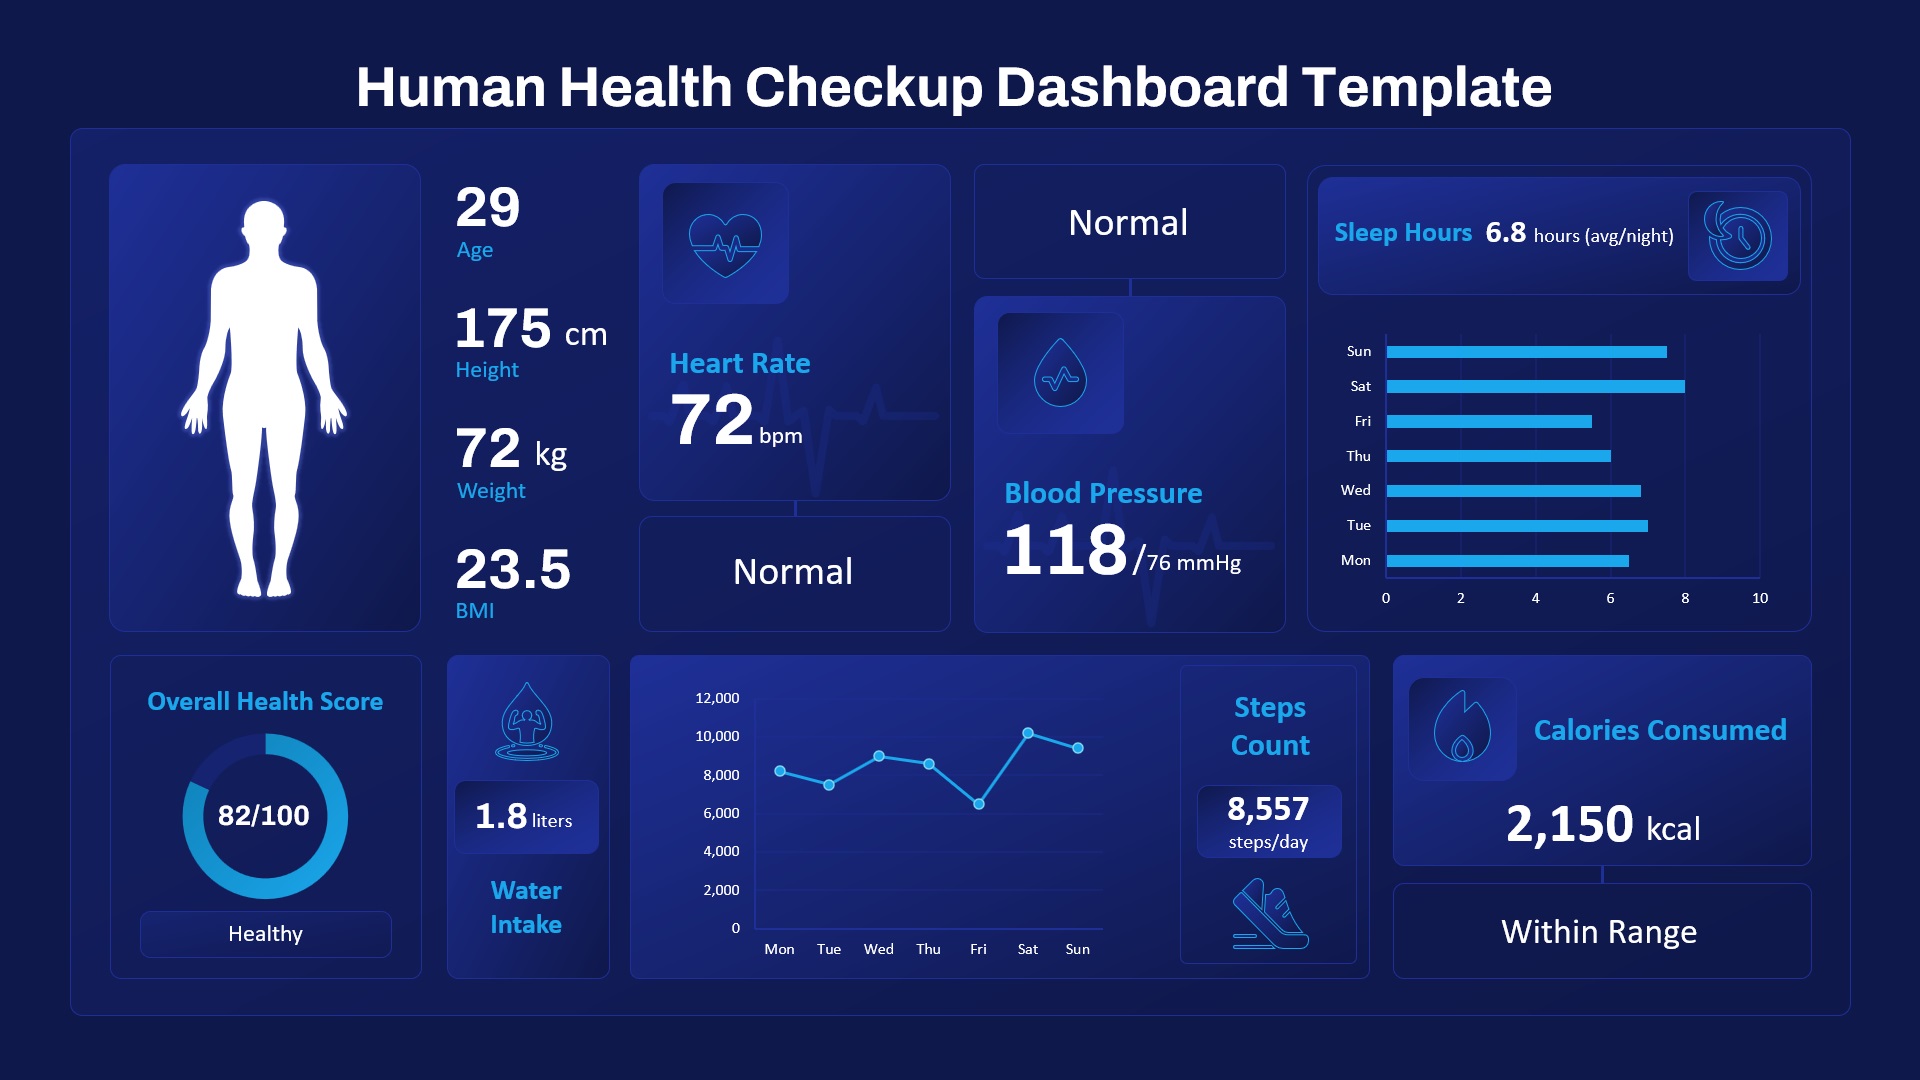
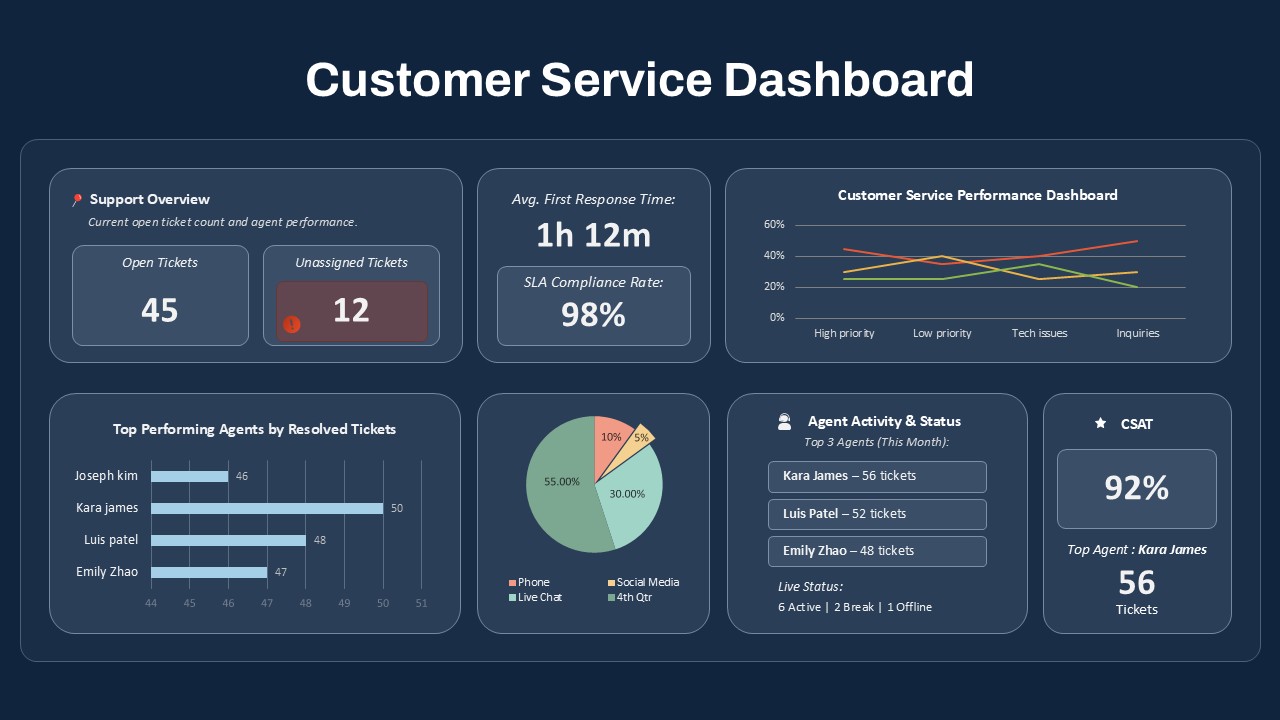
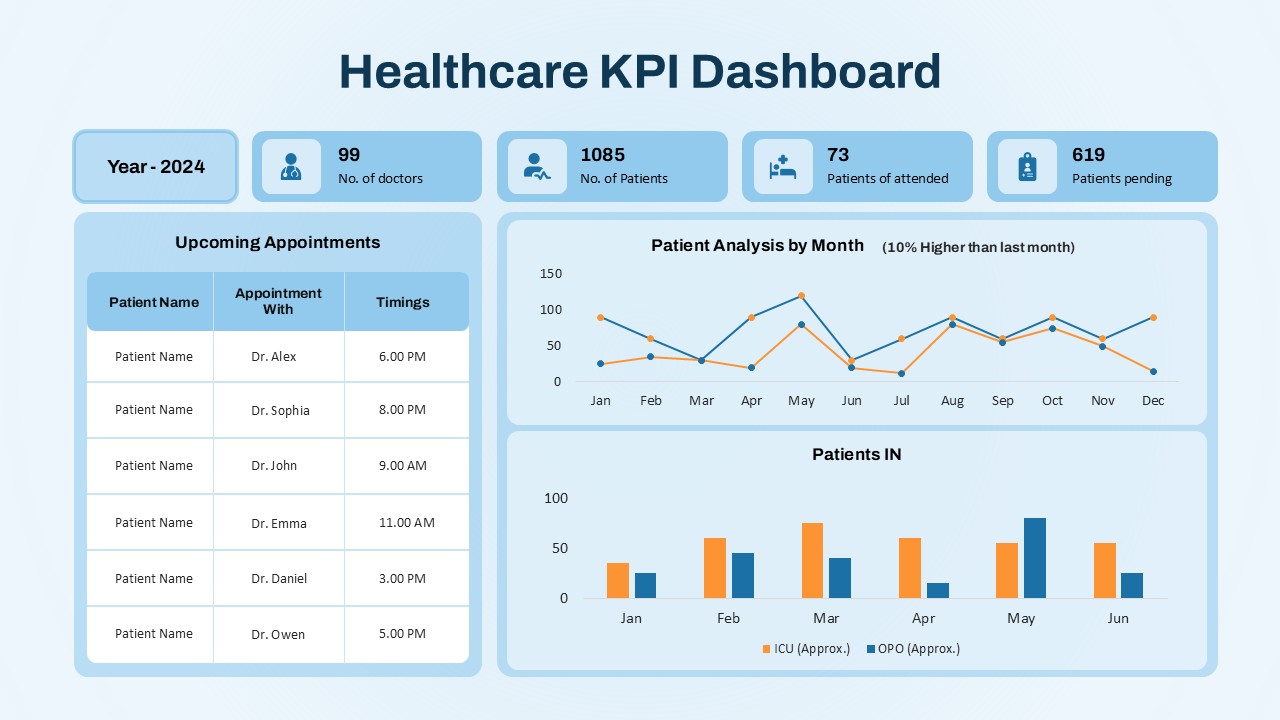
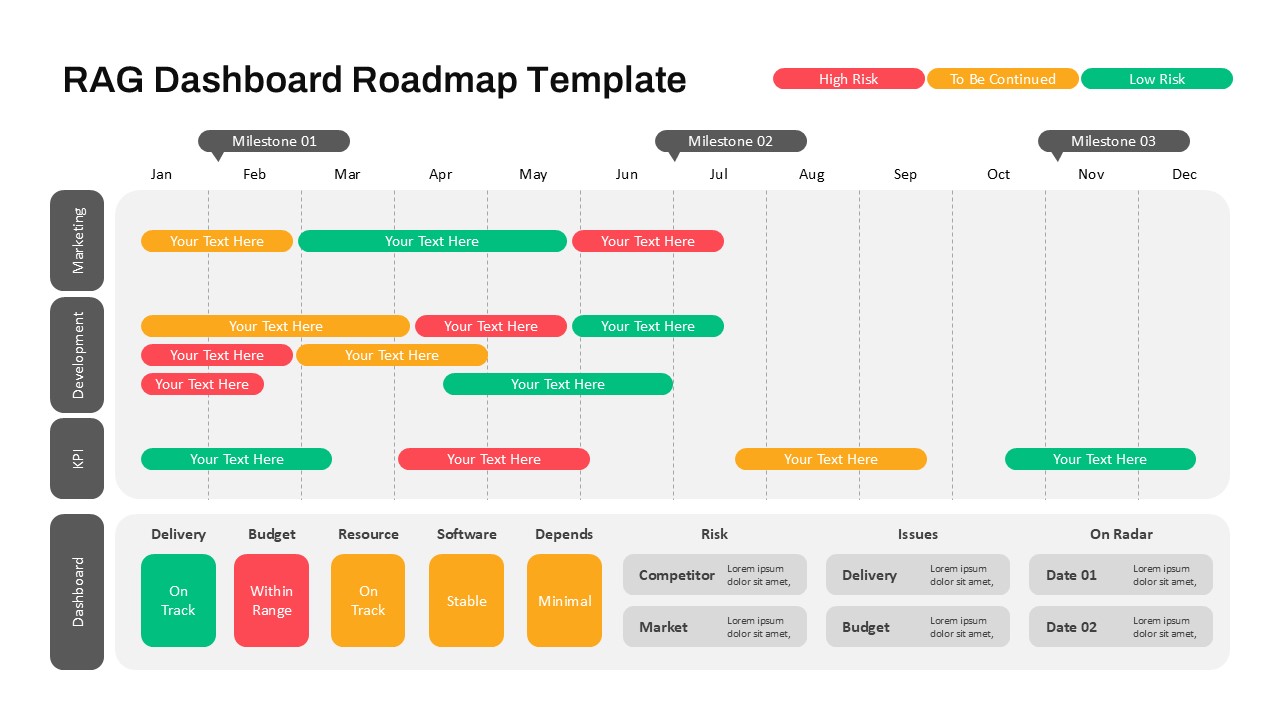
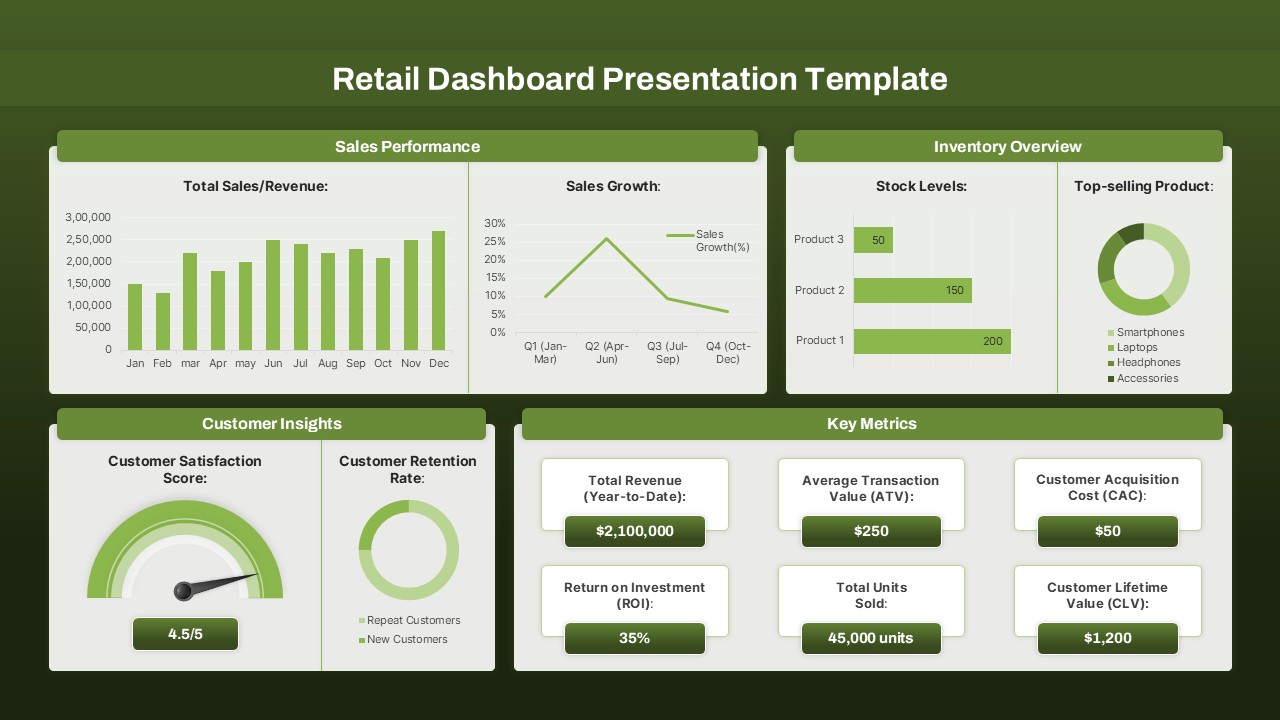
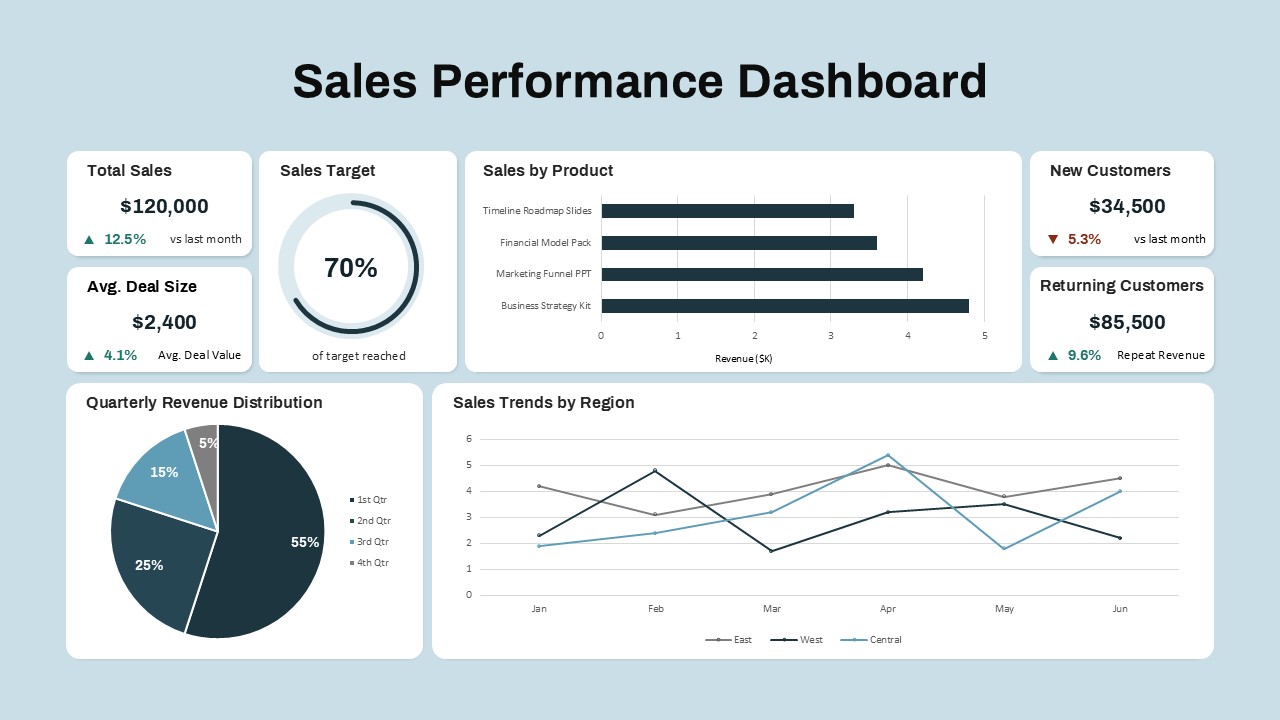
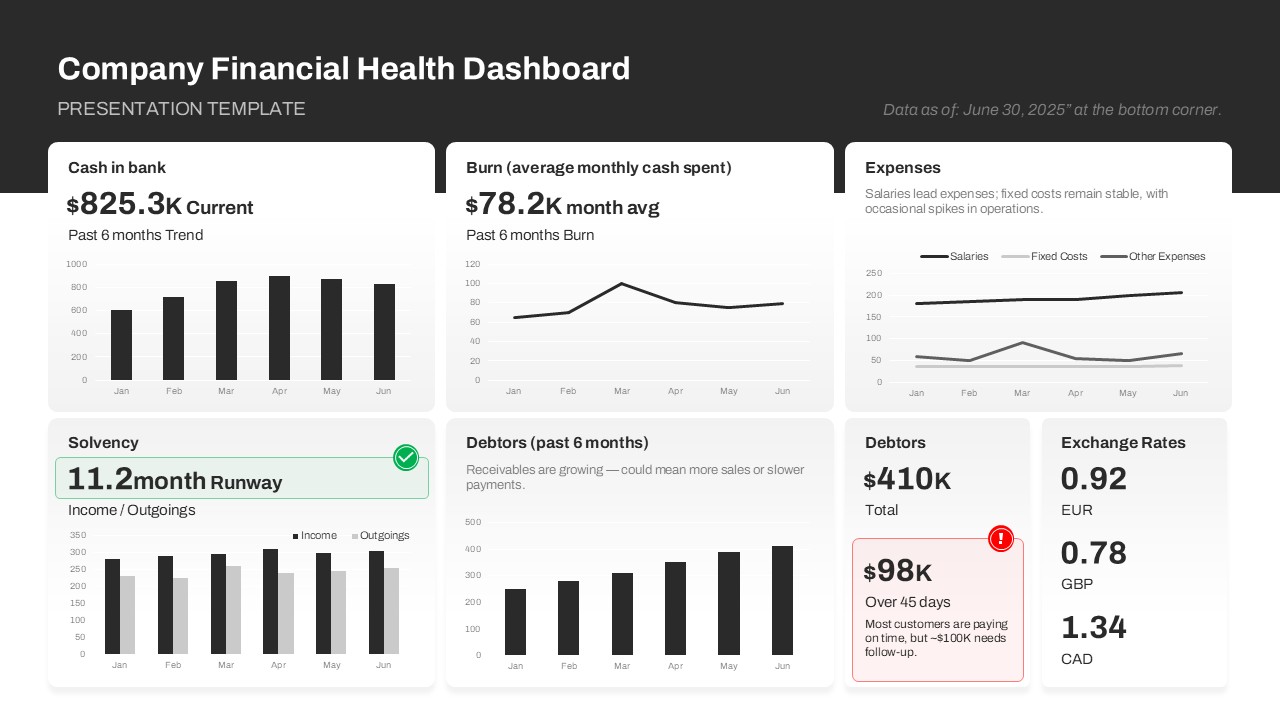
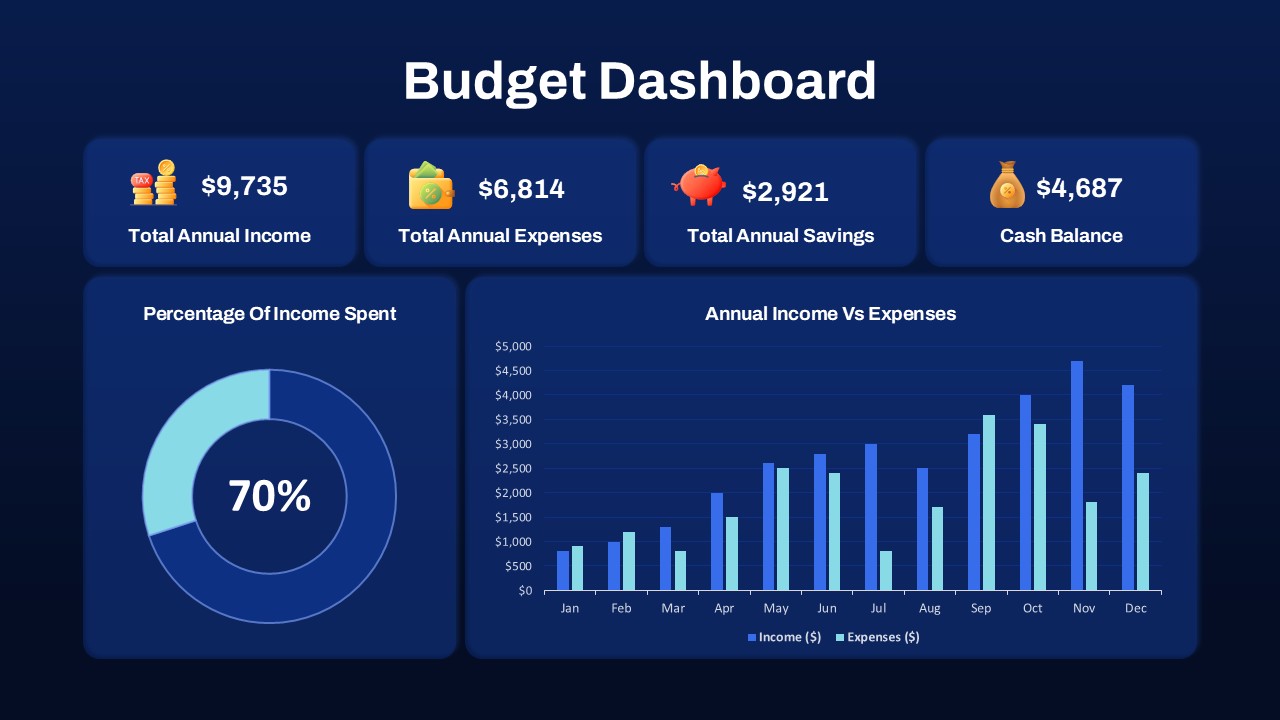
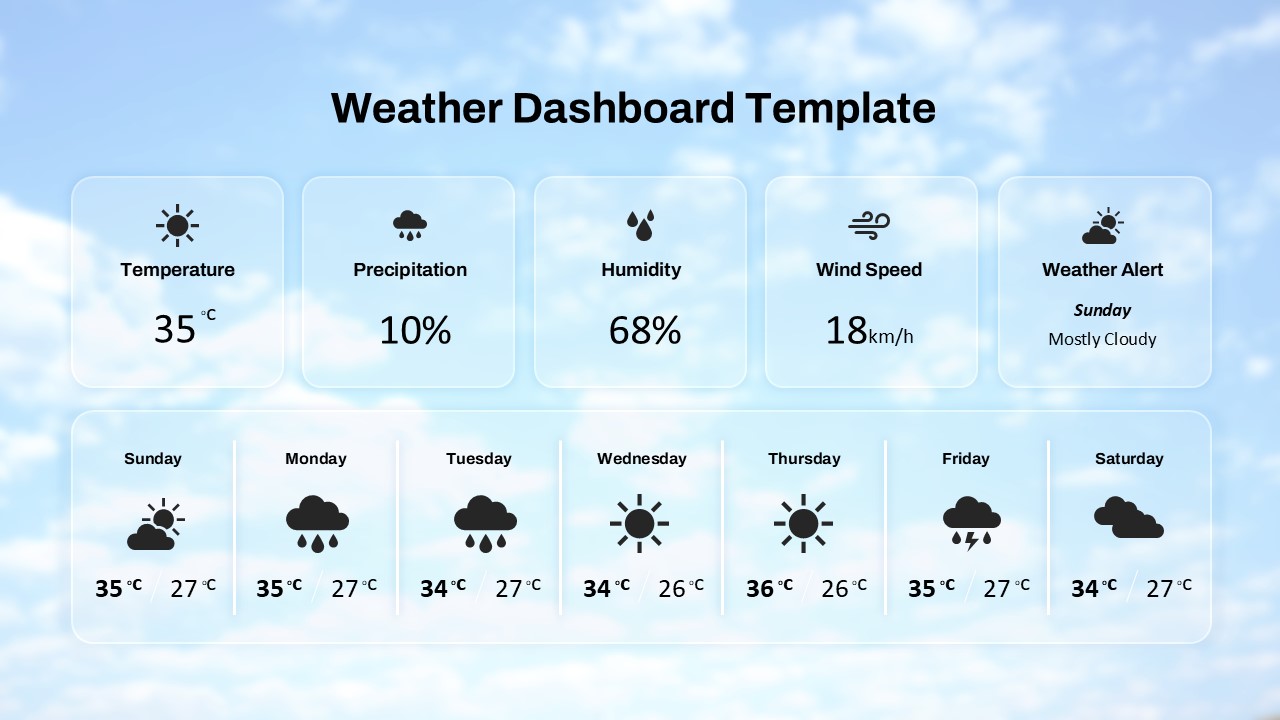
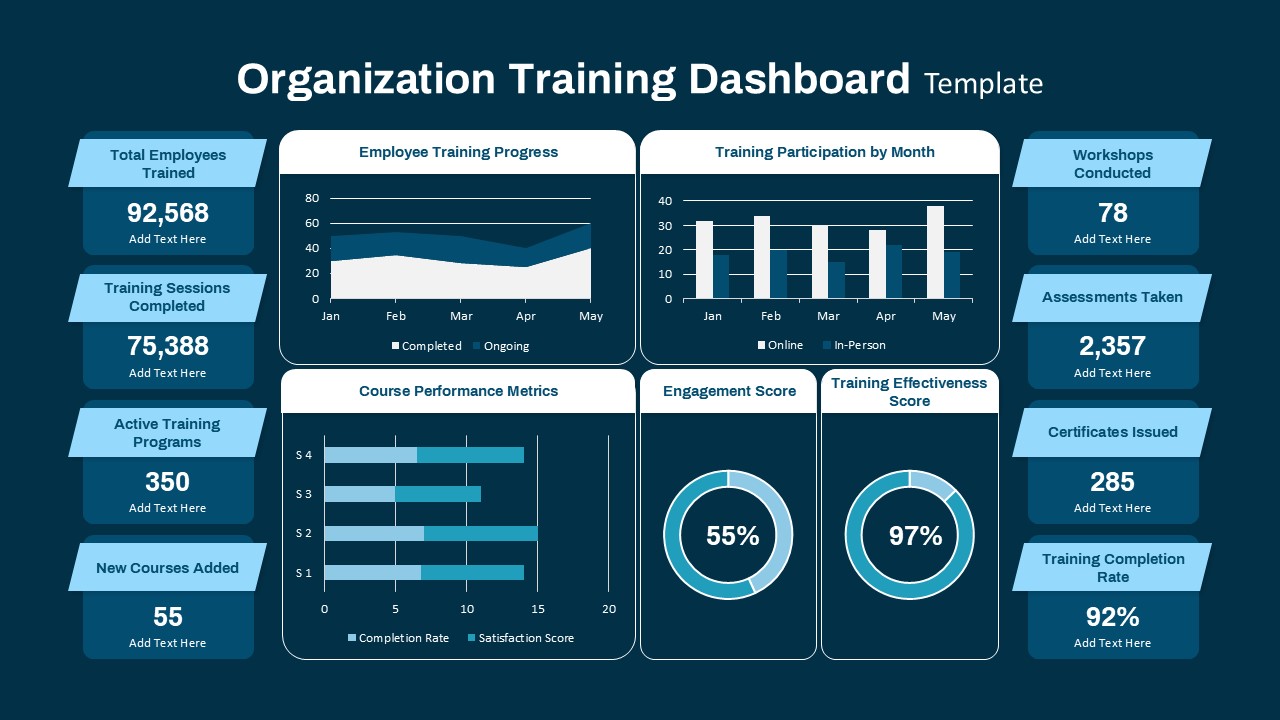
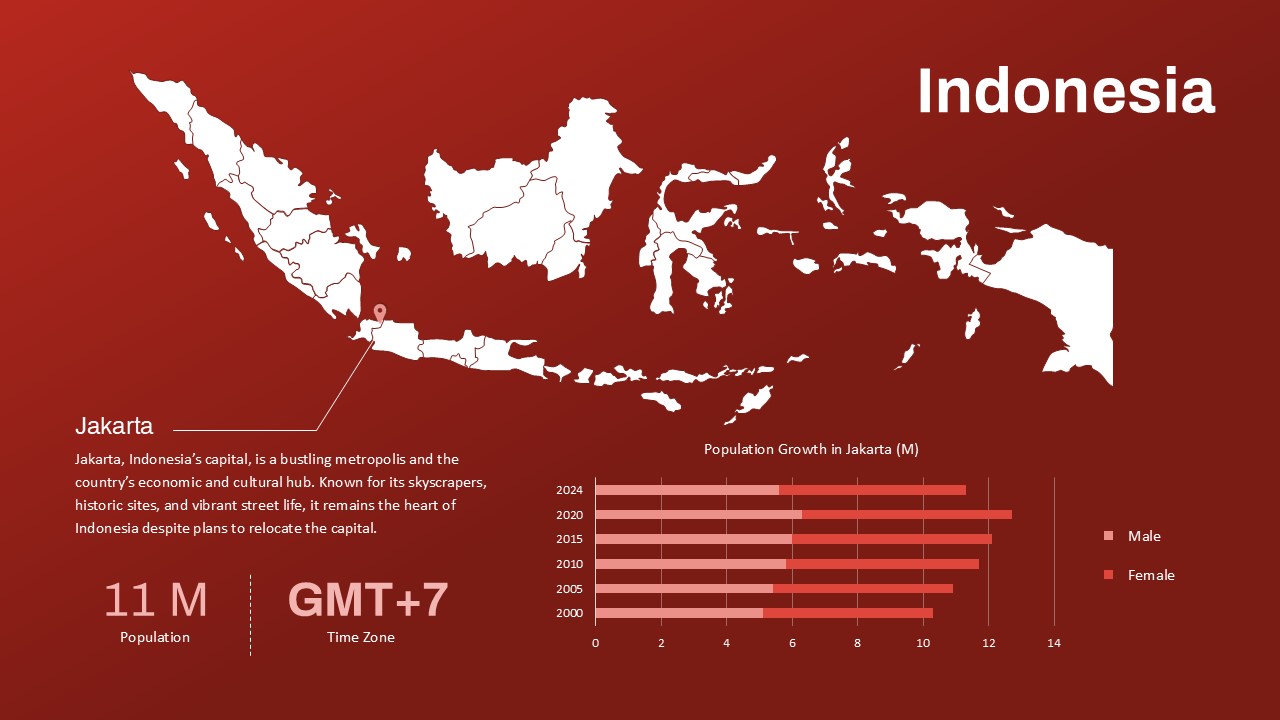
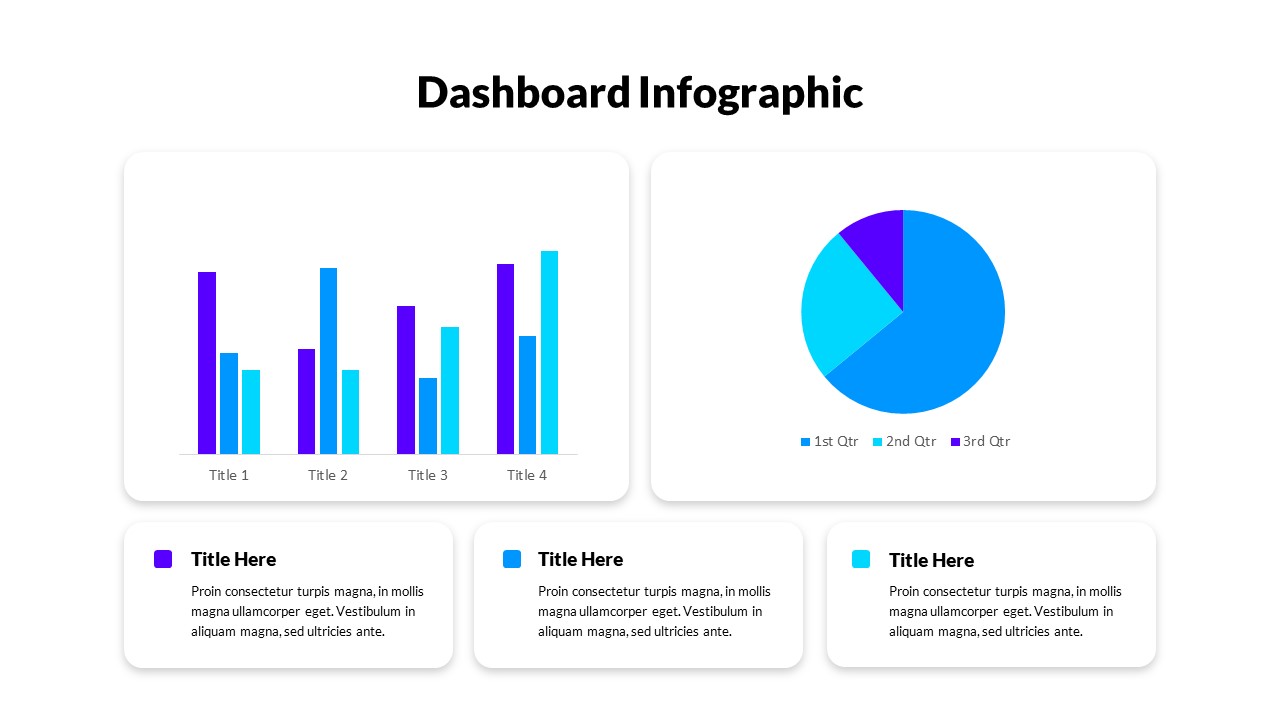
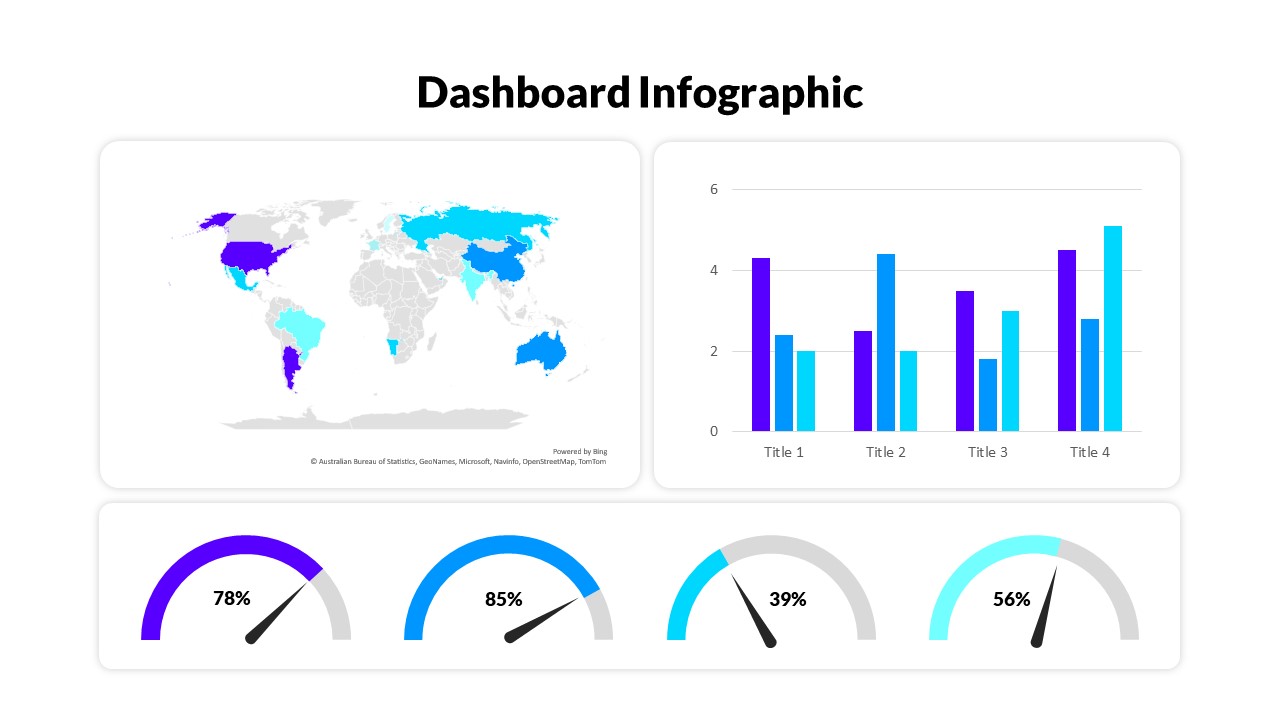
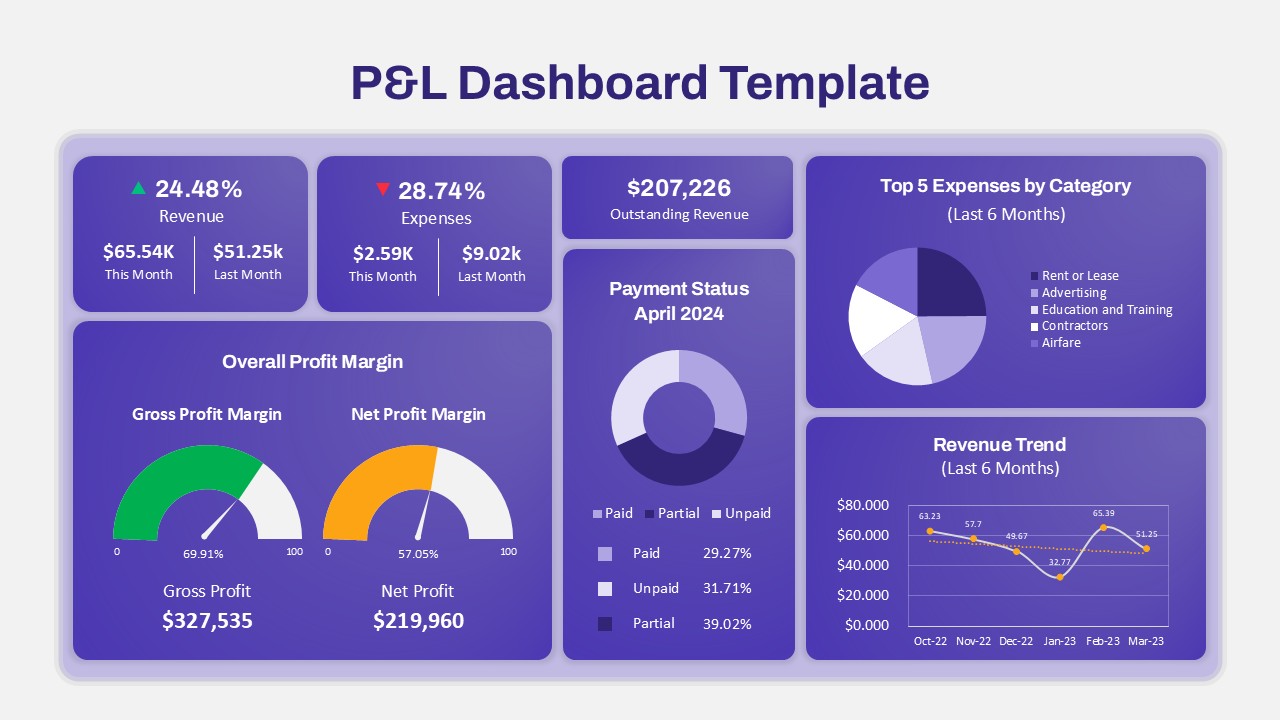
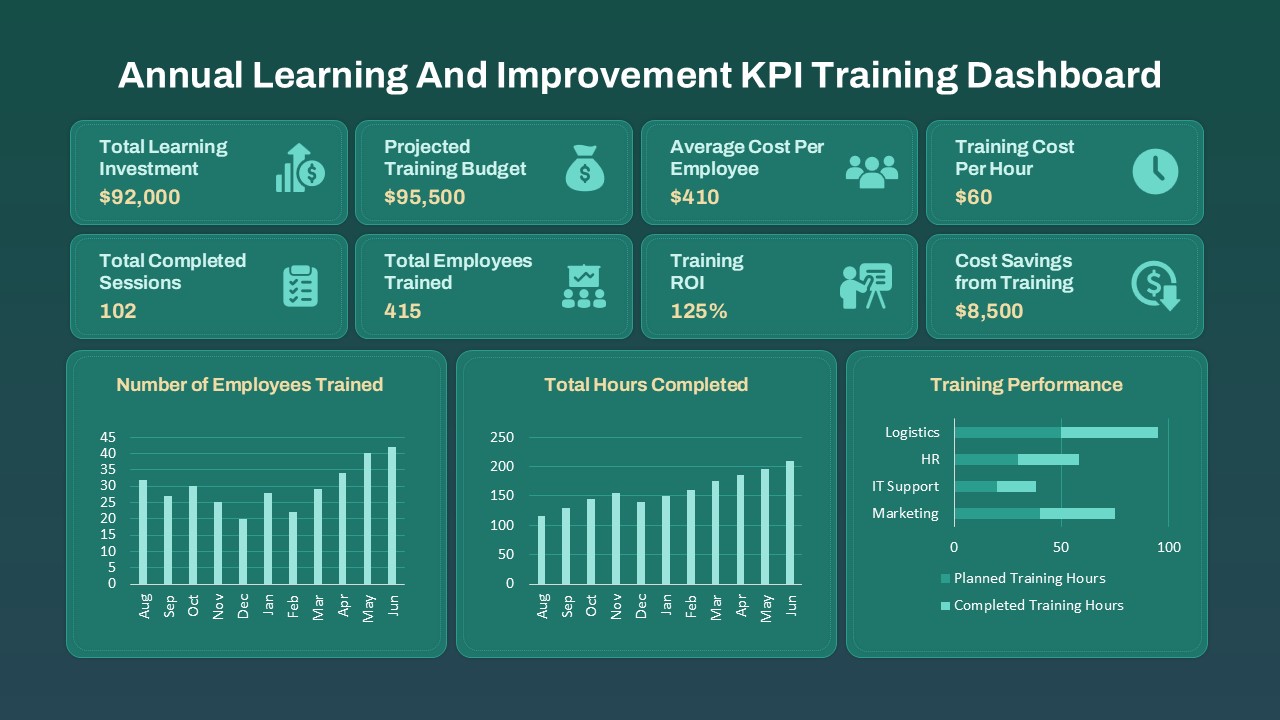
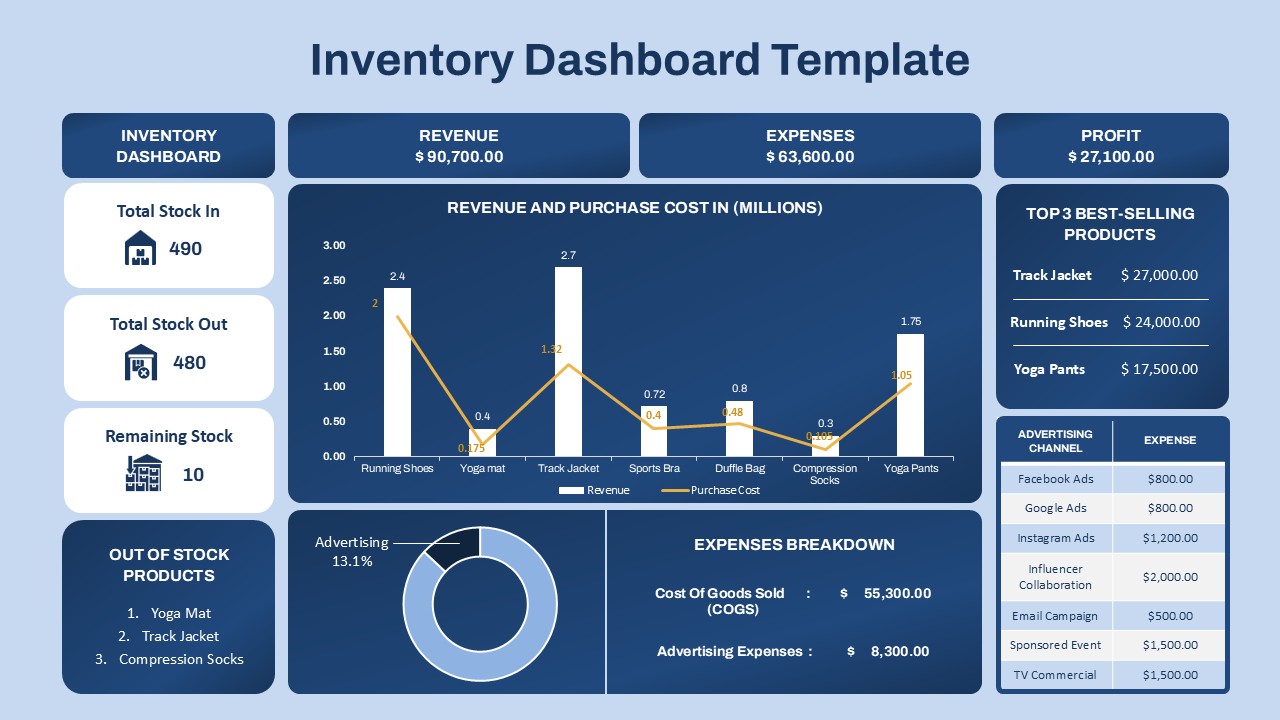
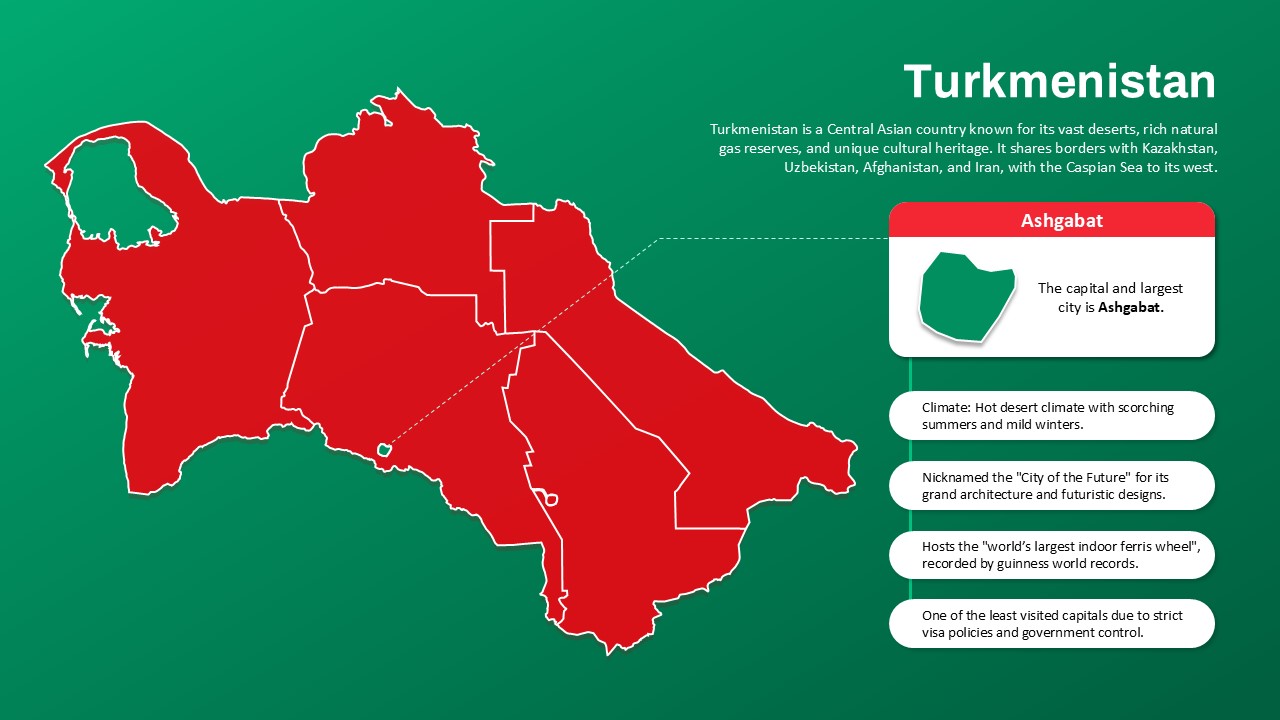
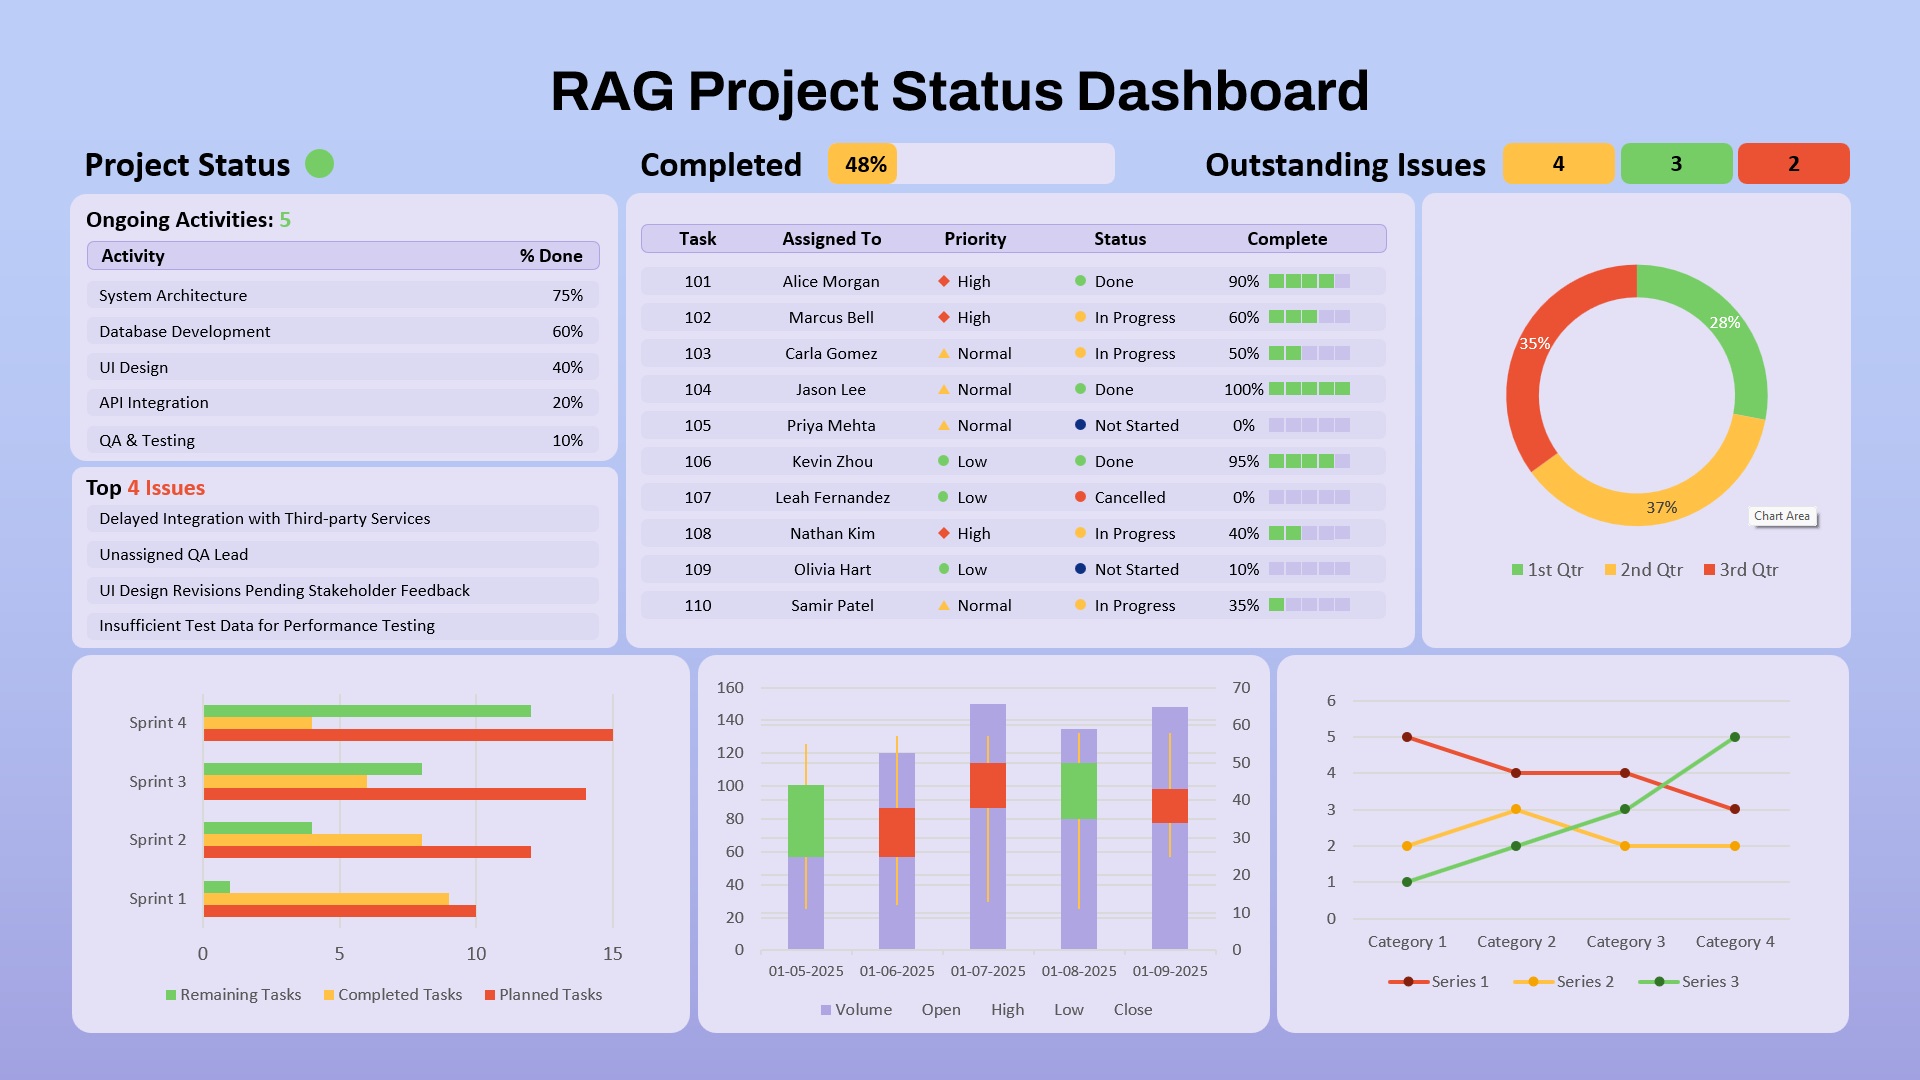
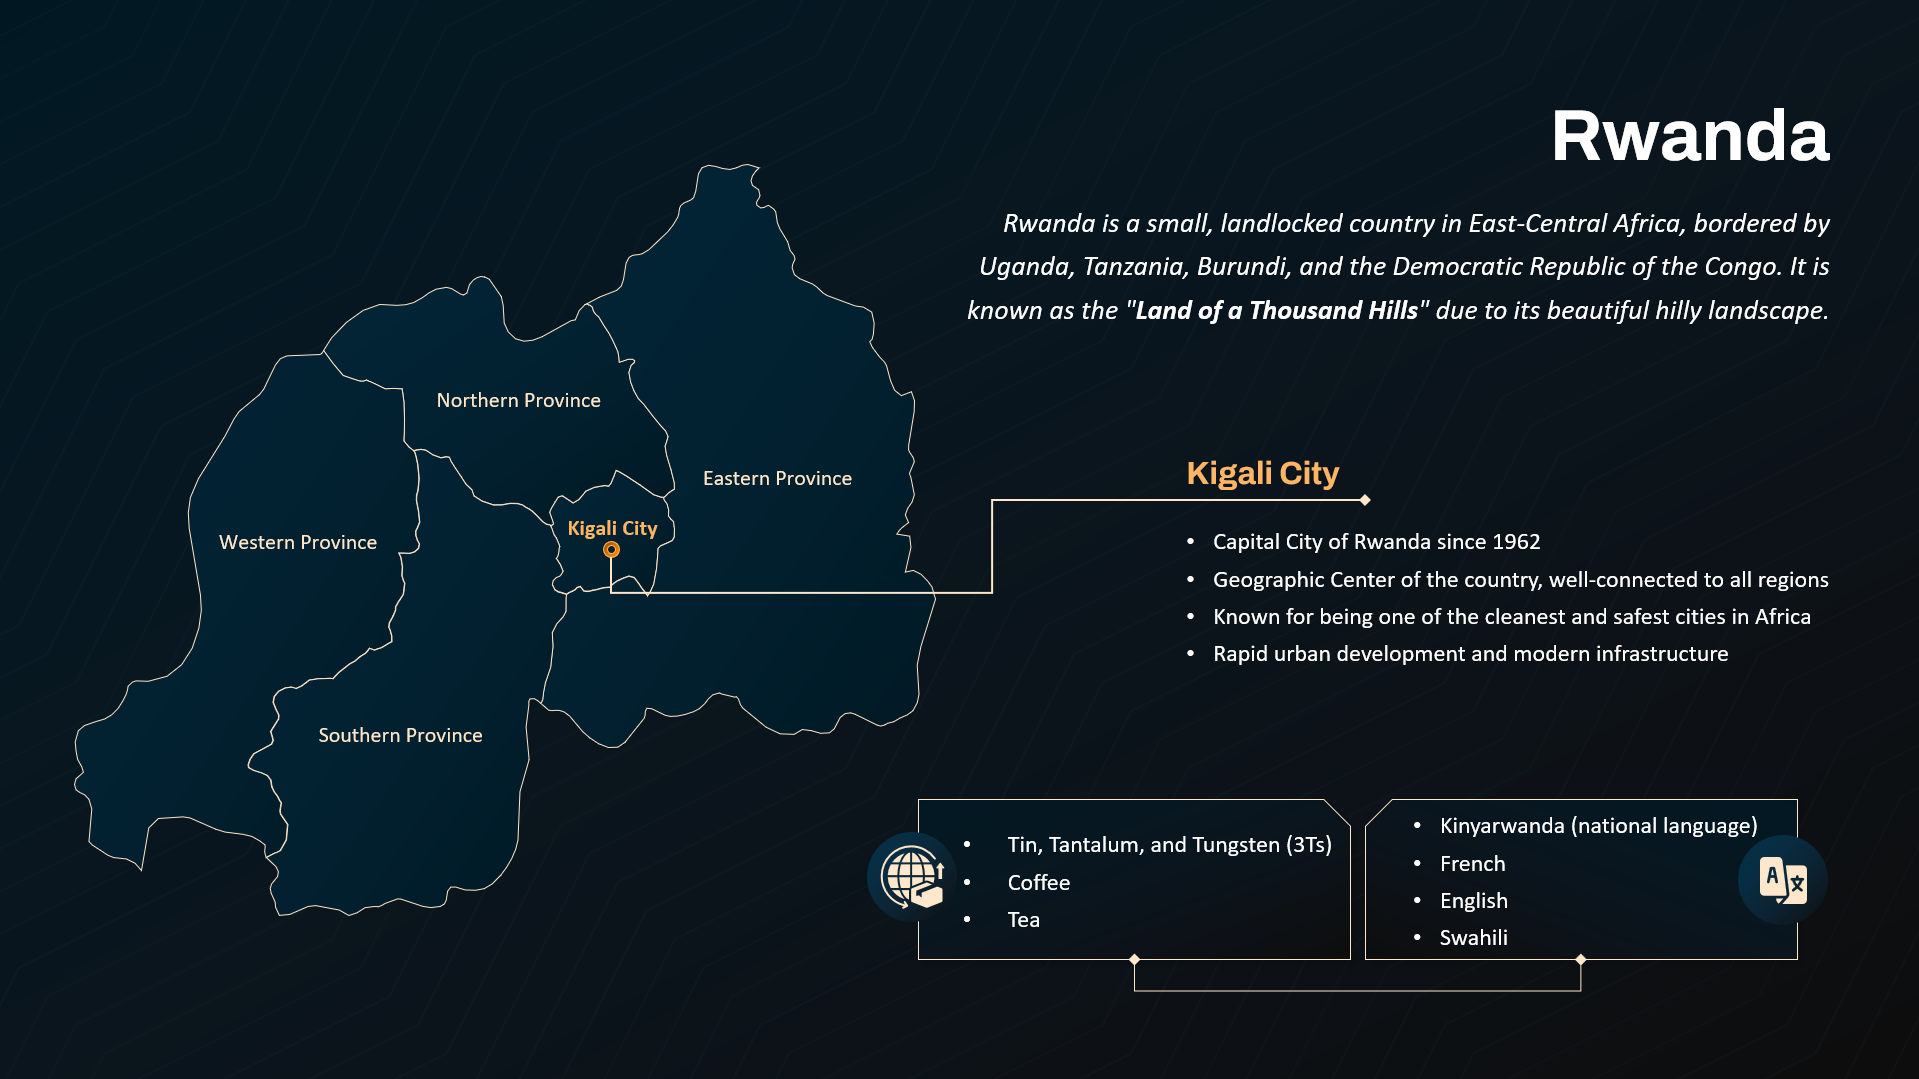
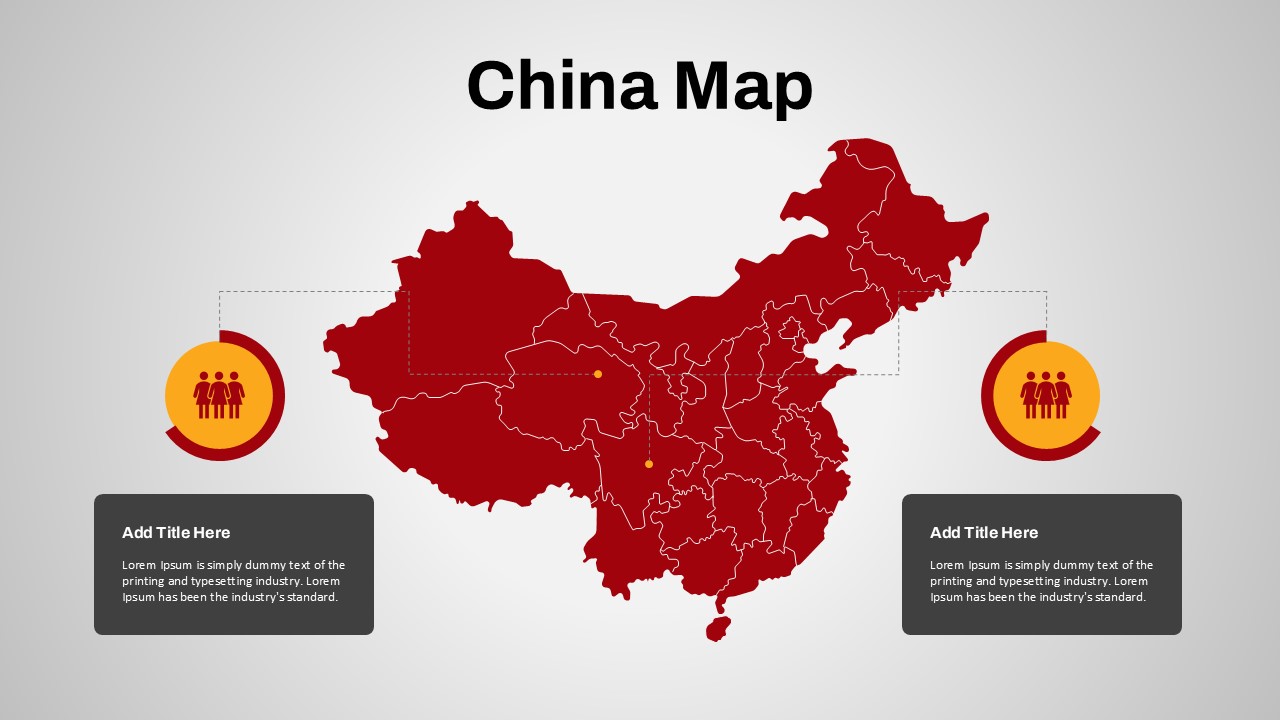
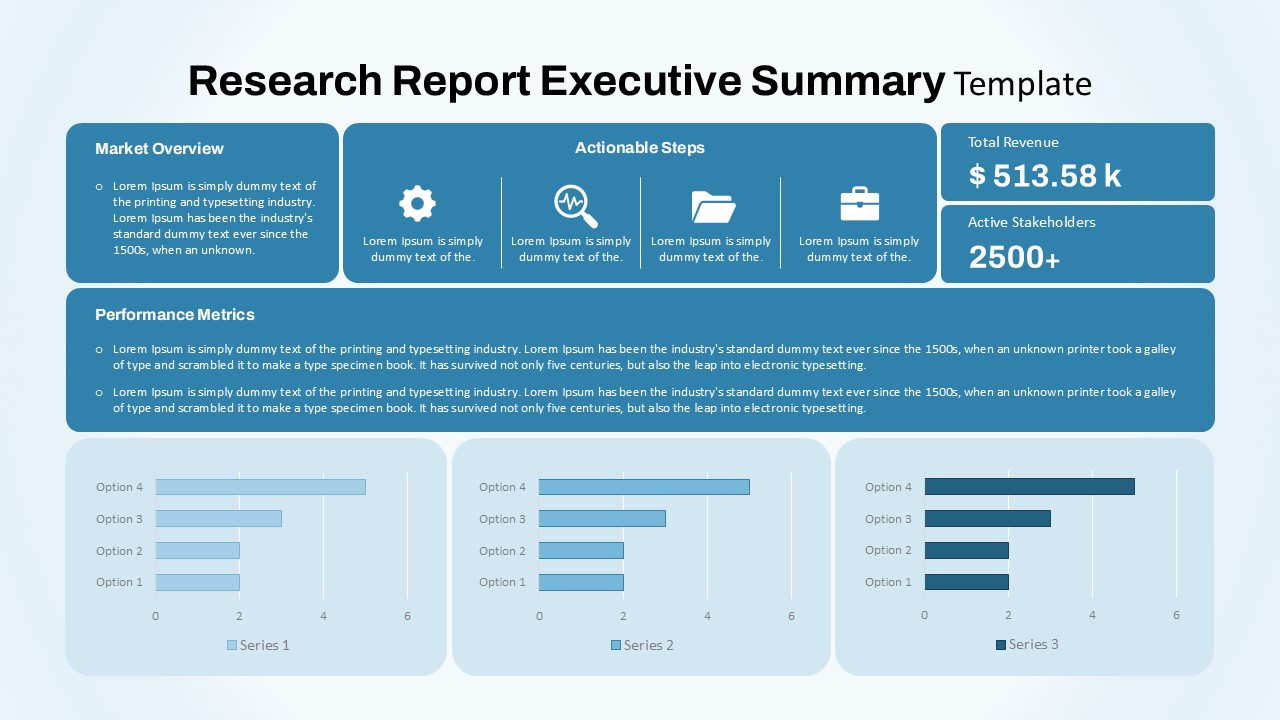
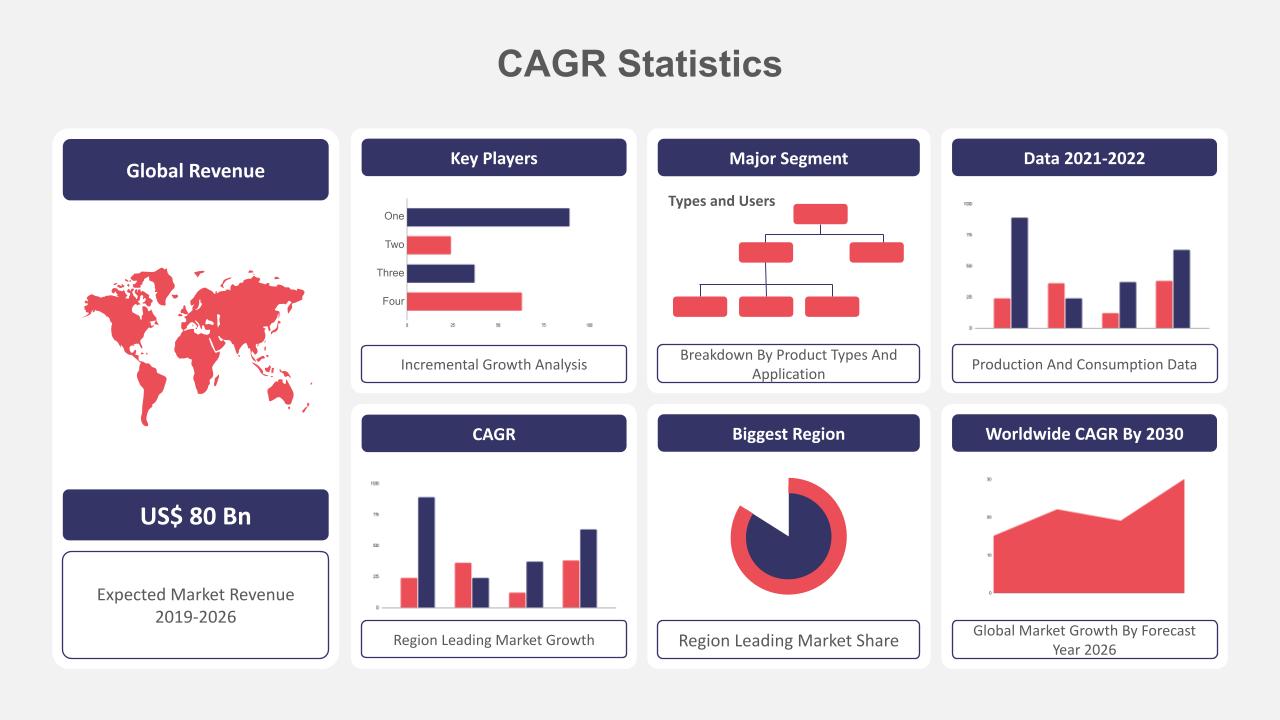
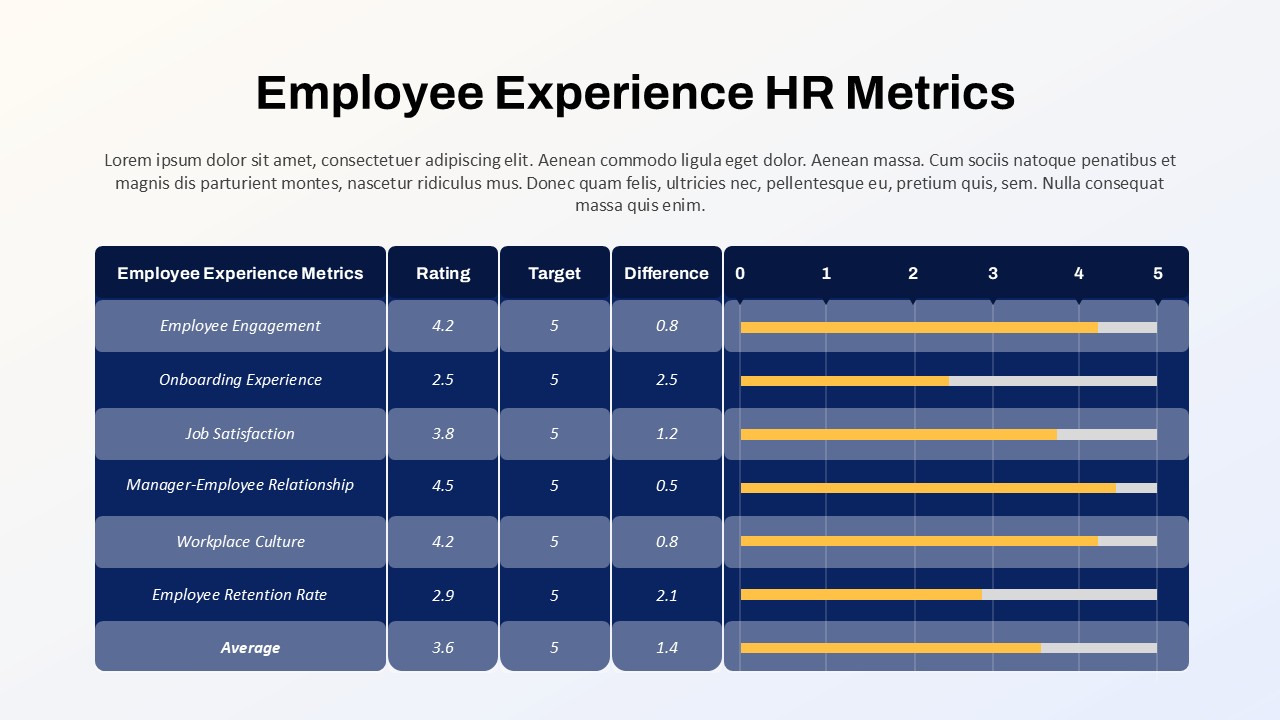
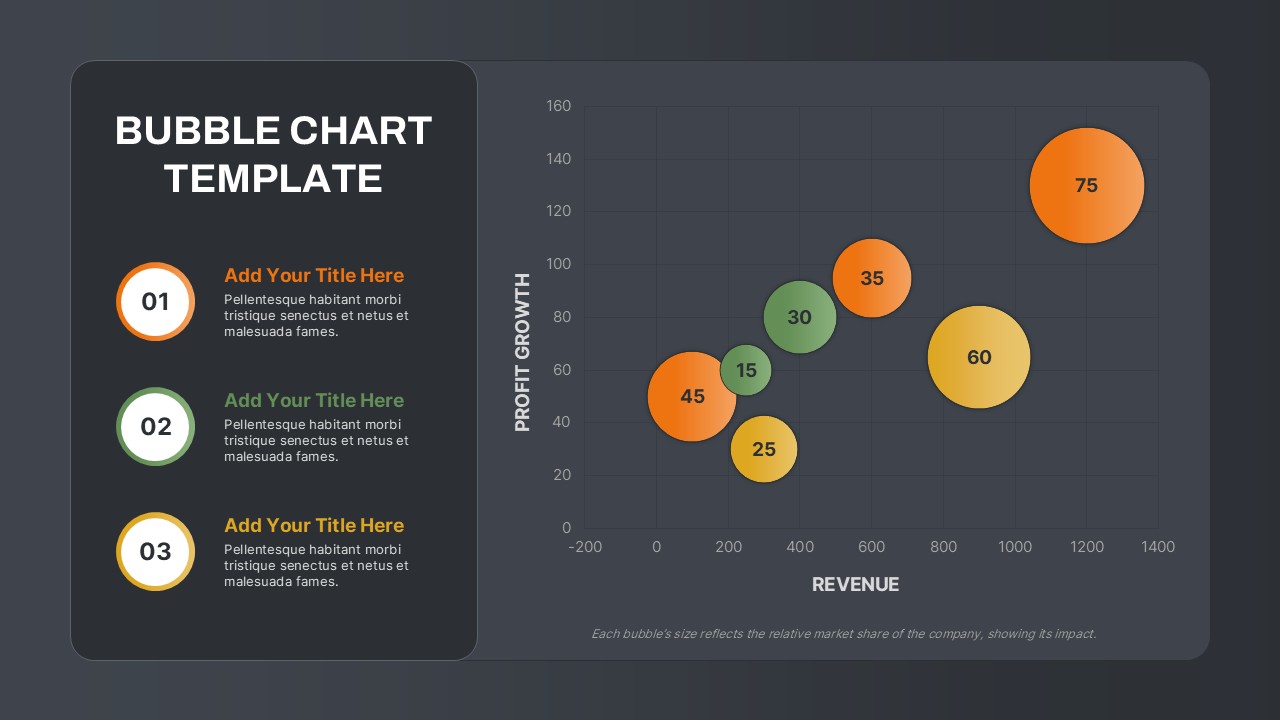
This smart city dashboard slide delivers a visually dynamic overview of urban data metrics, integrating real-time statistics, geographic insights, and environmental indicators. Designed with a sleek dark theme and vibrant data visuals, the layout includes 12 customizable widgets: numerical KPIs, pie charts, maps, temperature indicators, line graphs, and bar charts. Each section is cleanly partitioned for modular editing, making it easy to track infrastructure performance, population activity, environmental data, and civic engagement.
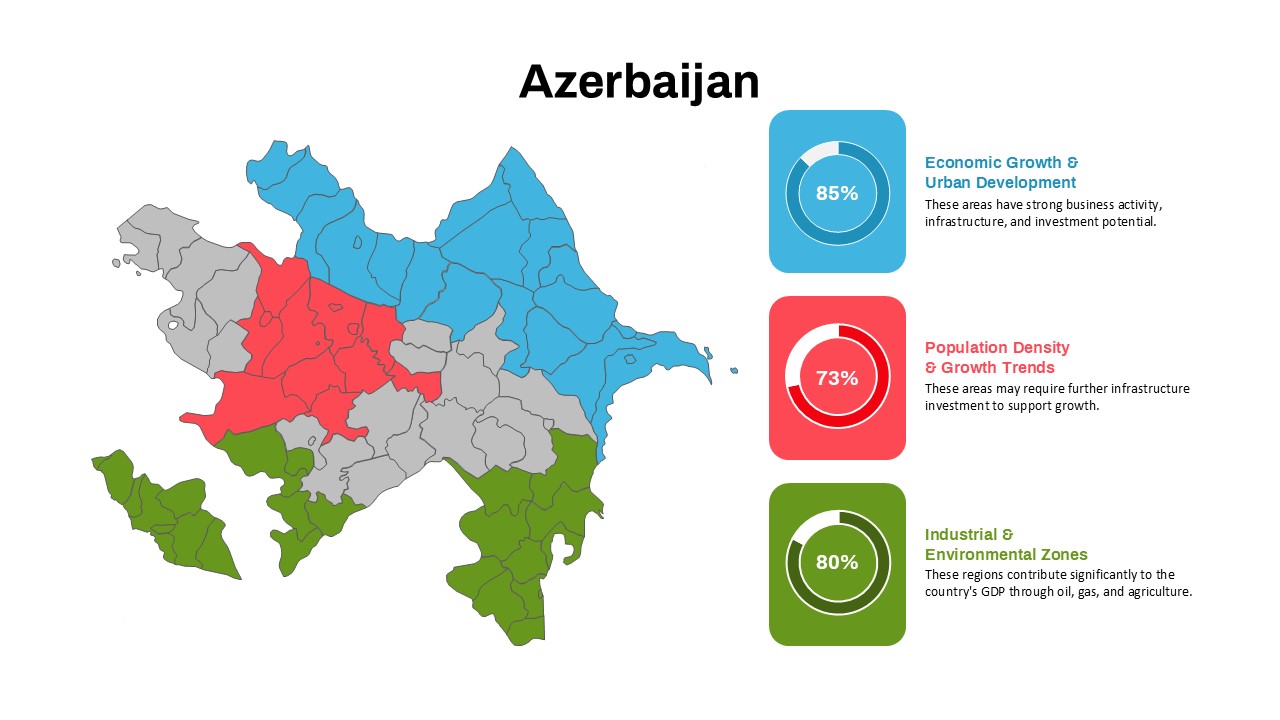
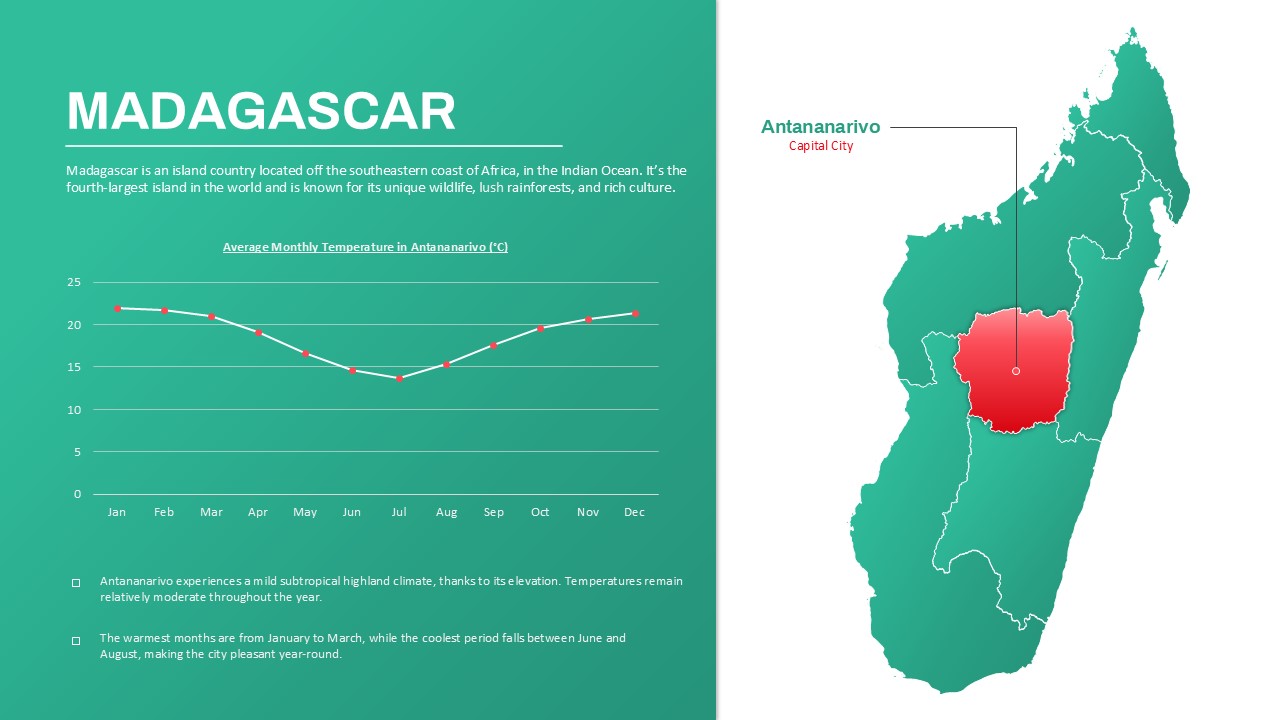
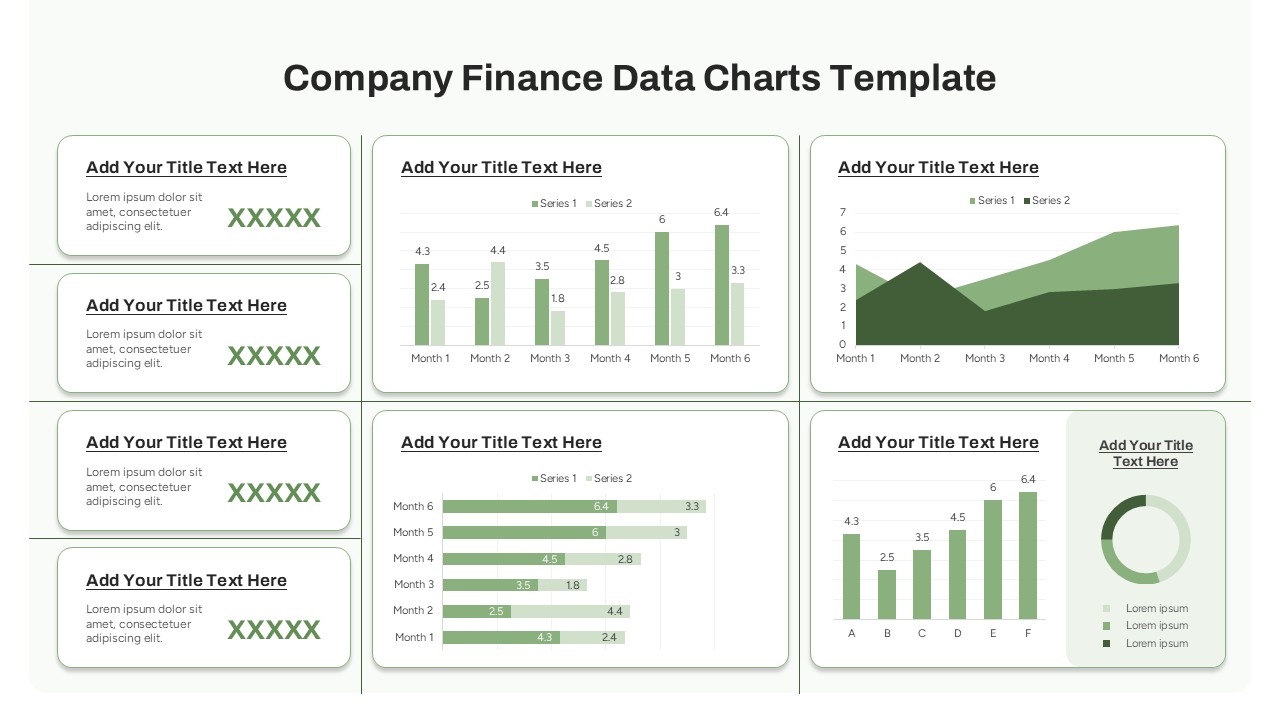
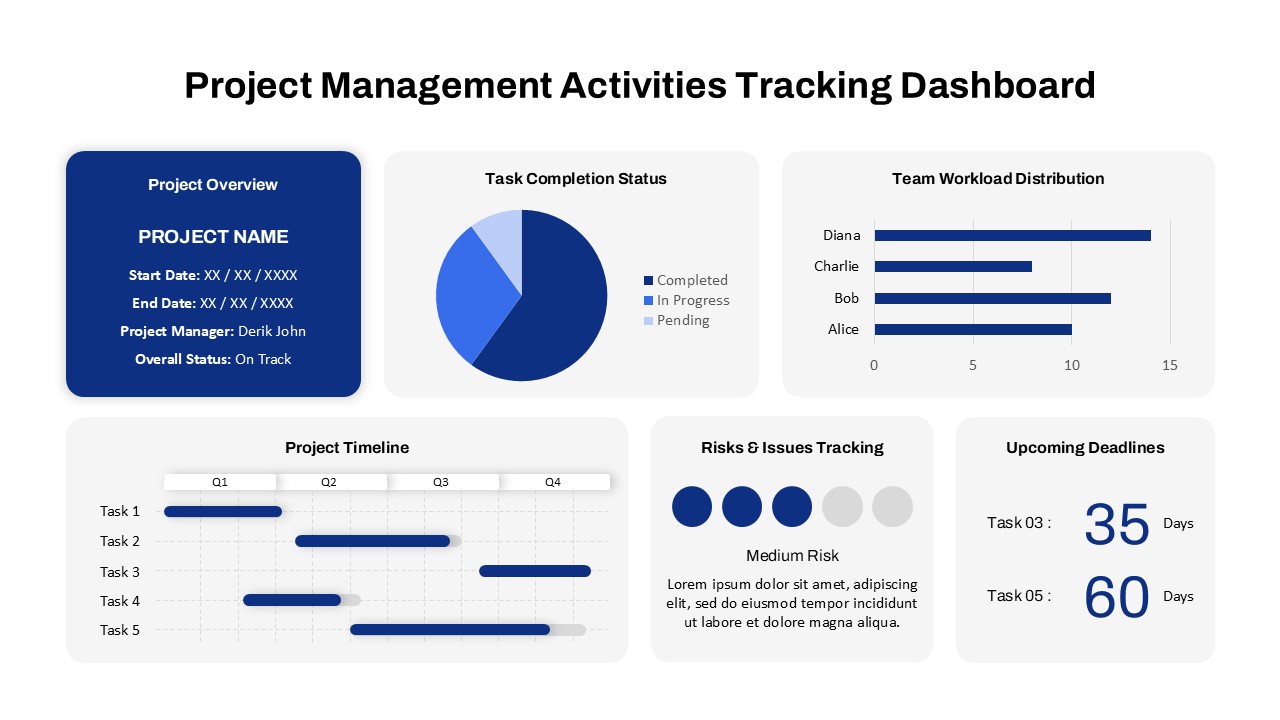
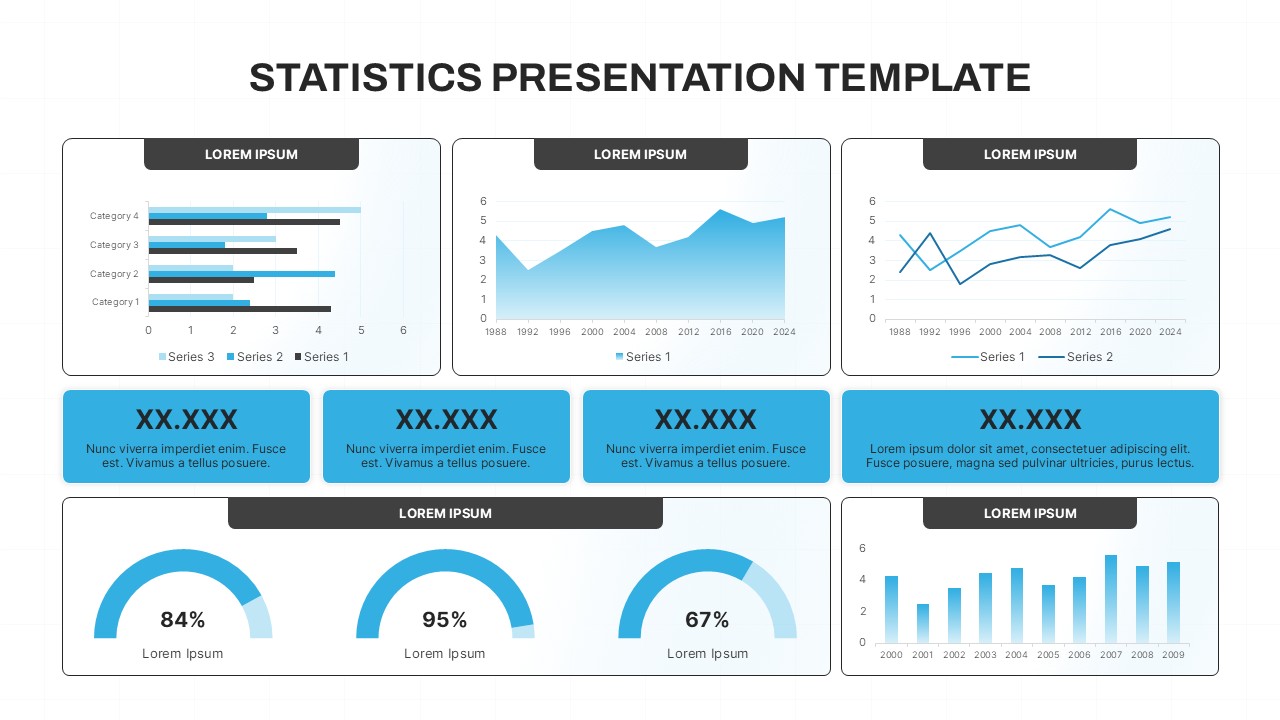
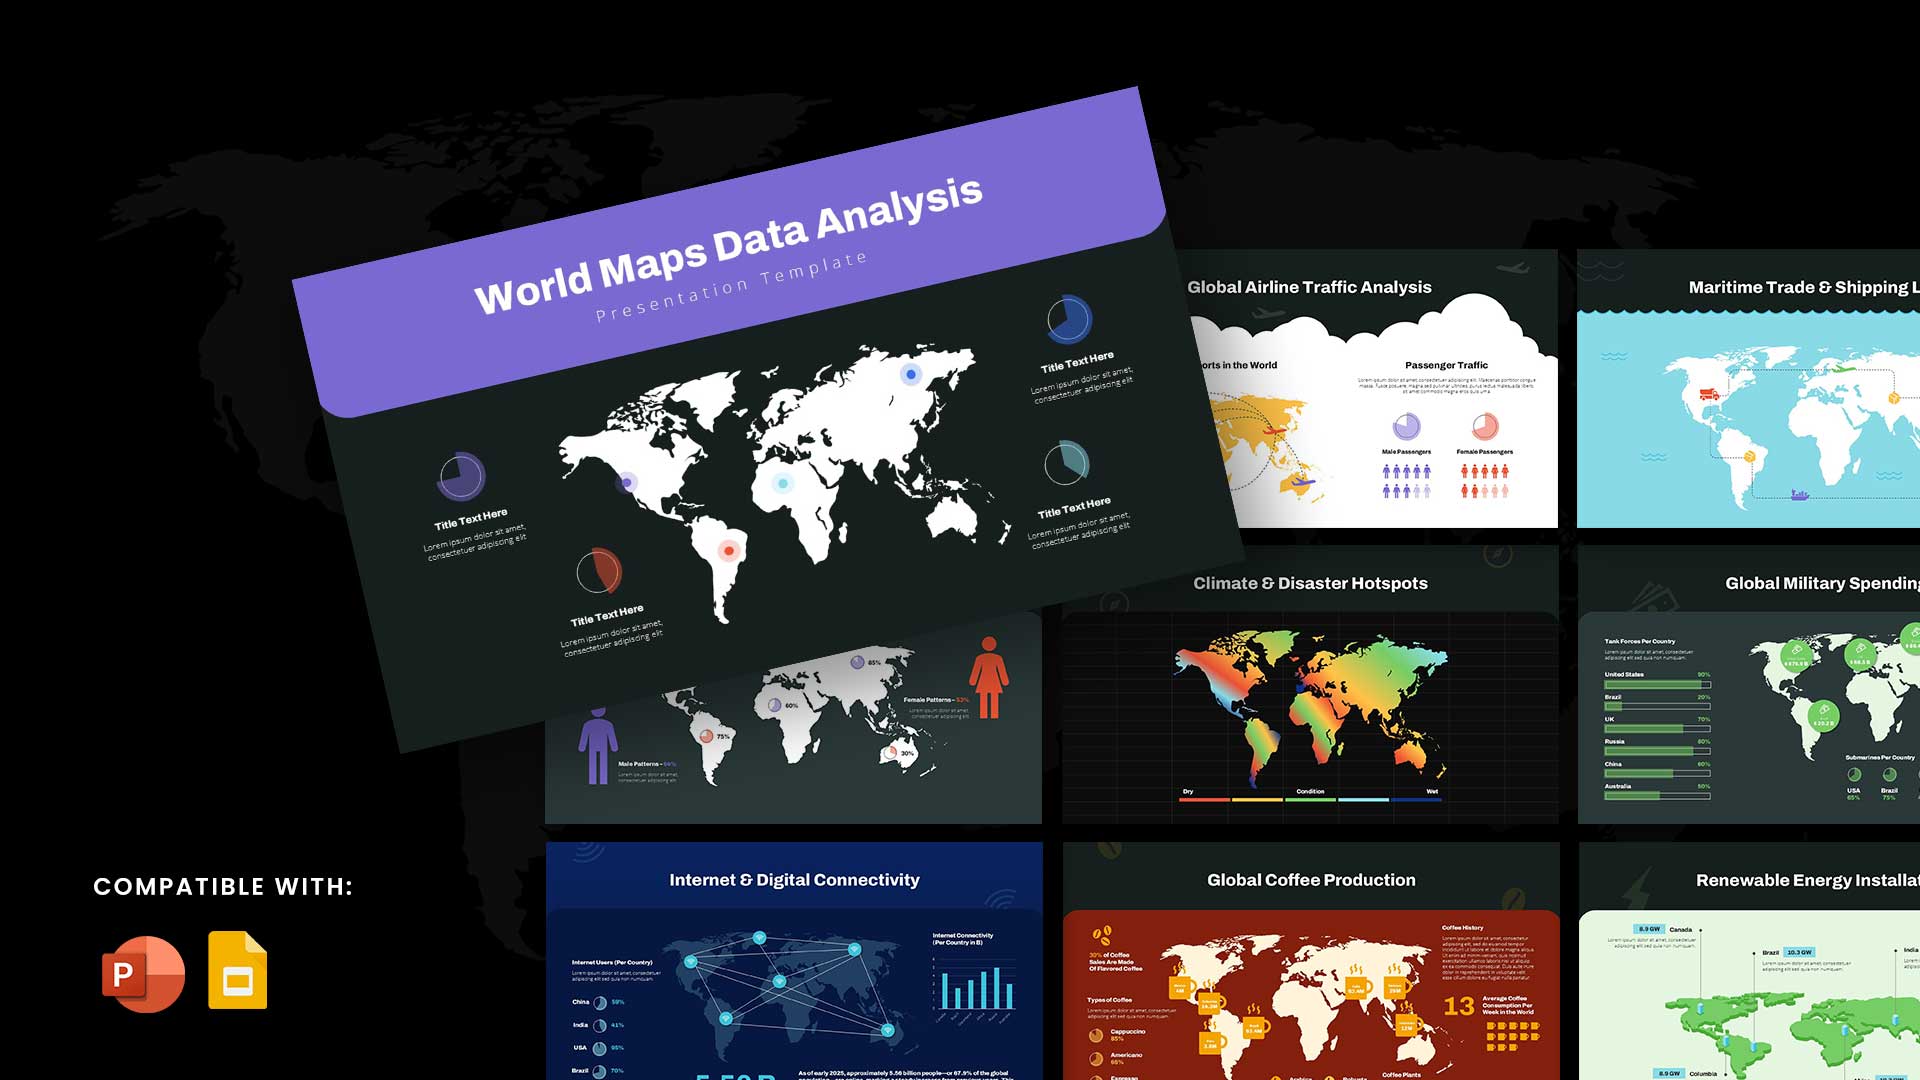
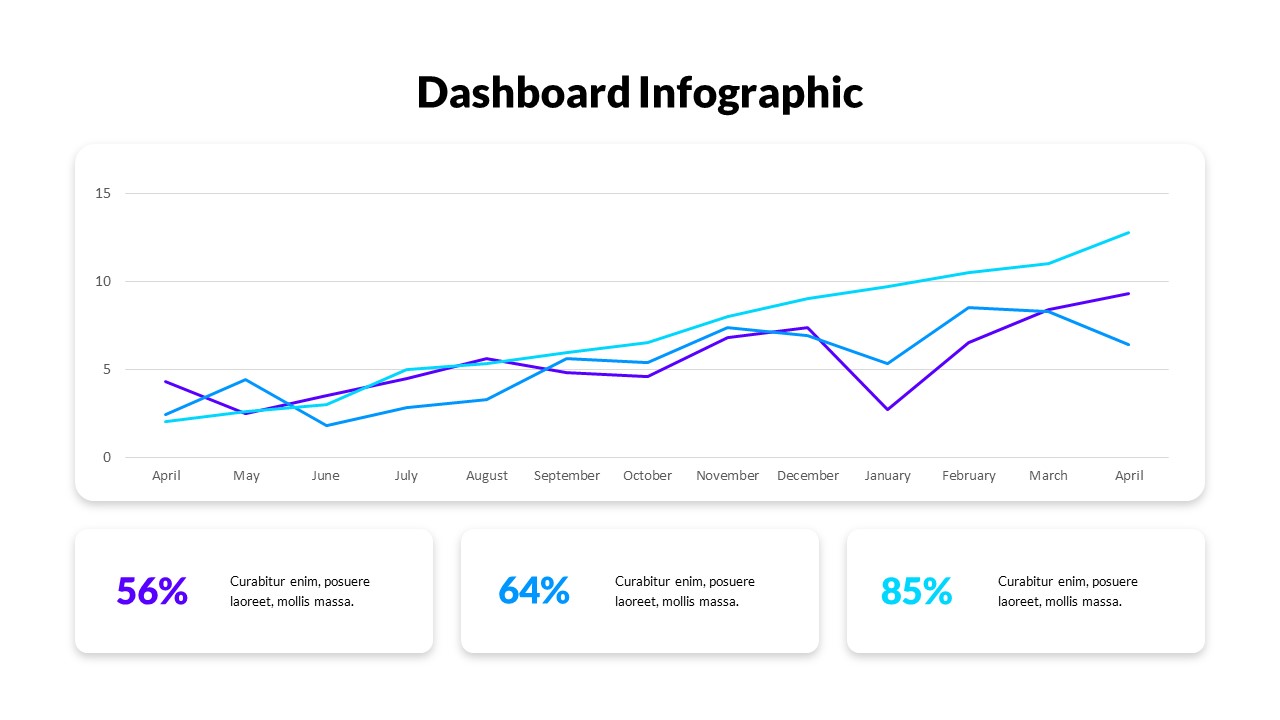
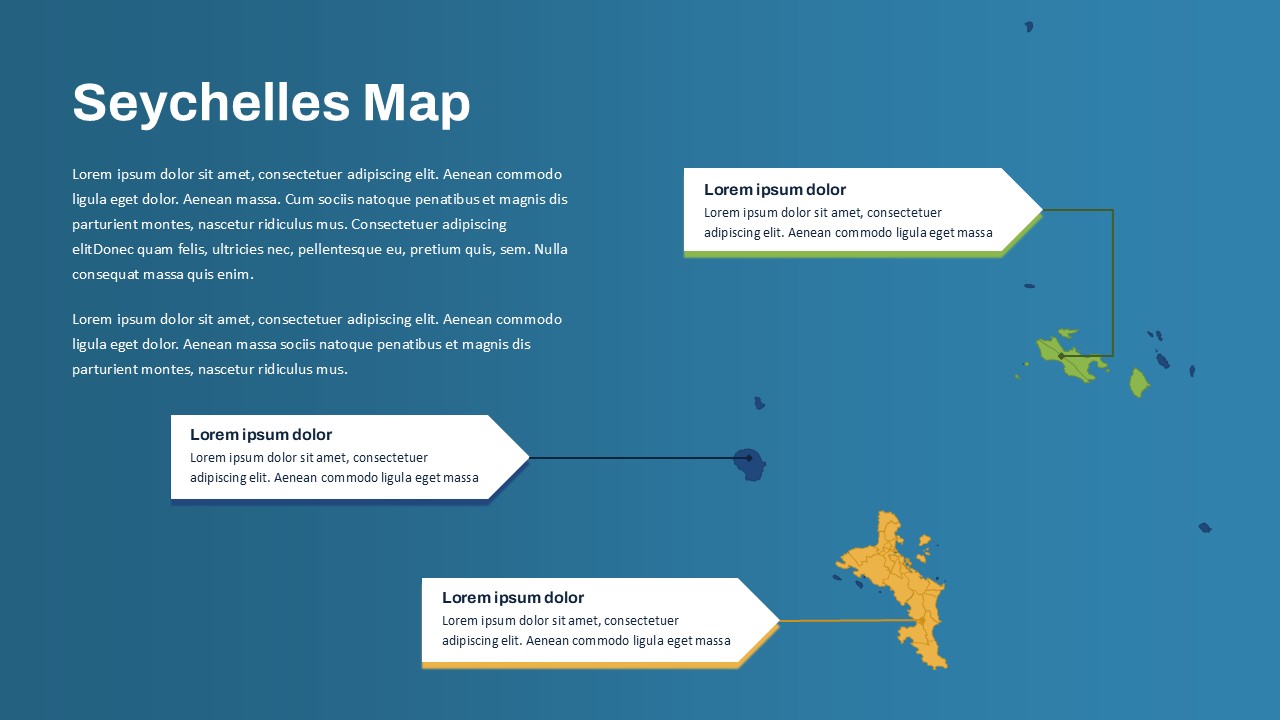
The design balances clarity and sophistication using iconography (location, people, buildings), intuitive color coding, and a grid-based structure. Geo maps offer spatial analysis while the line and bar graphs reveal trends over time, enabling effective data storytelling. A circular progress chart and climate widget enhance real-time monitoring for urban planners, sustainability officers, and city administrators.
This template is optimized for PowerPoint and Google Slides, allowing seamless data updates, icon swaps, and layout modifications. It’s ideal for presenting to stakeholders, government agencies, or smart city consortiums.
See more

Aspect Ratio
16:9Item ID
SKT04108
Features of this template
Other Uses
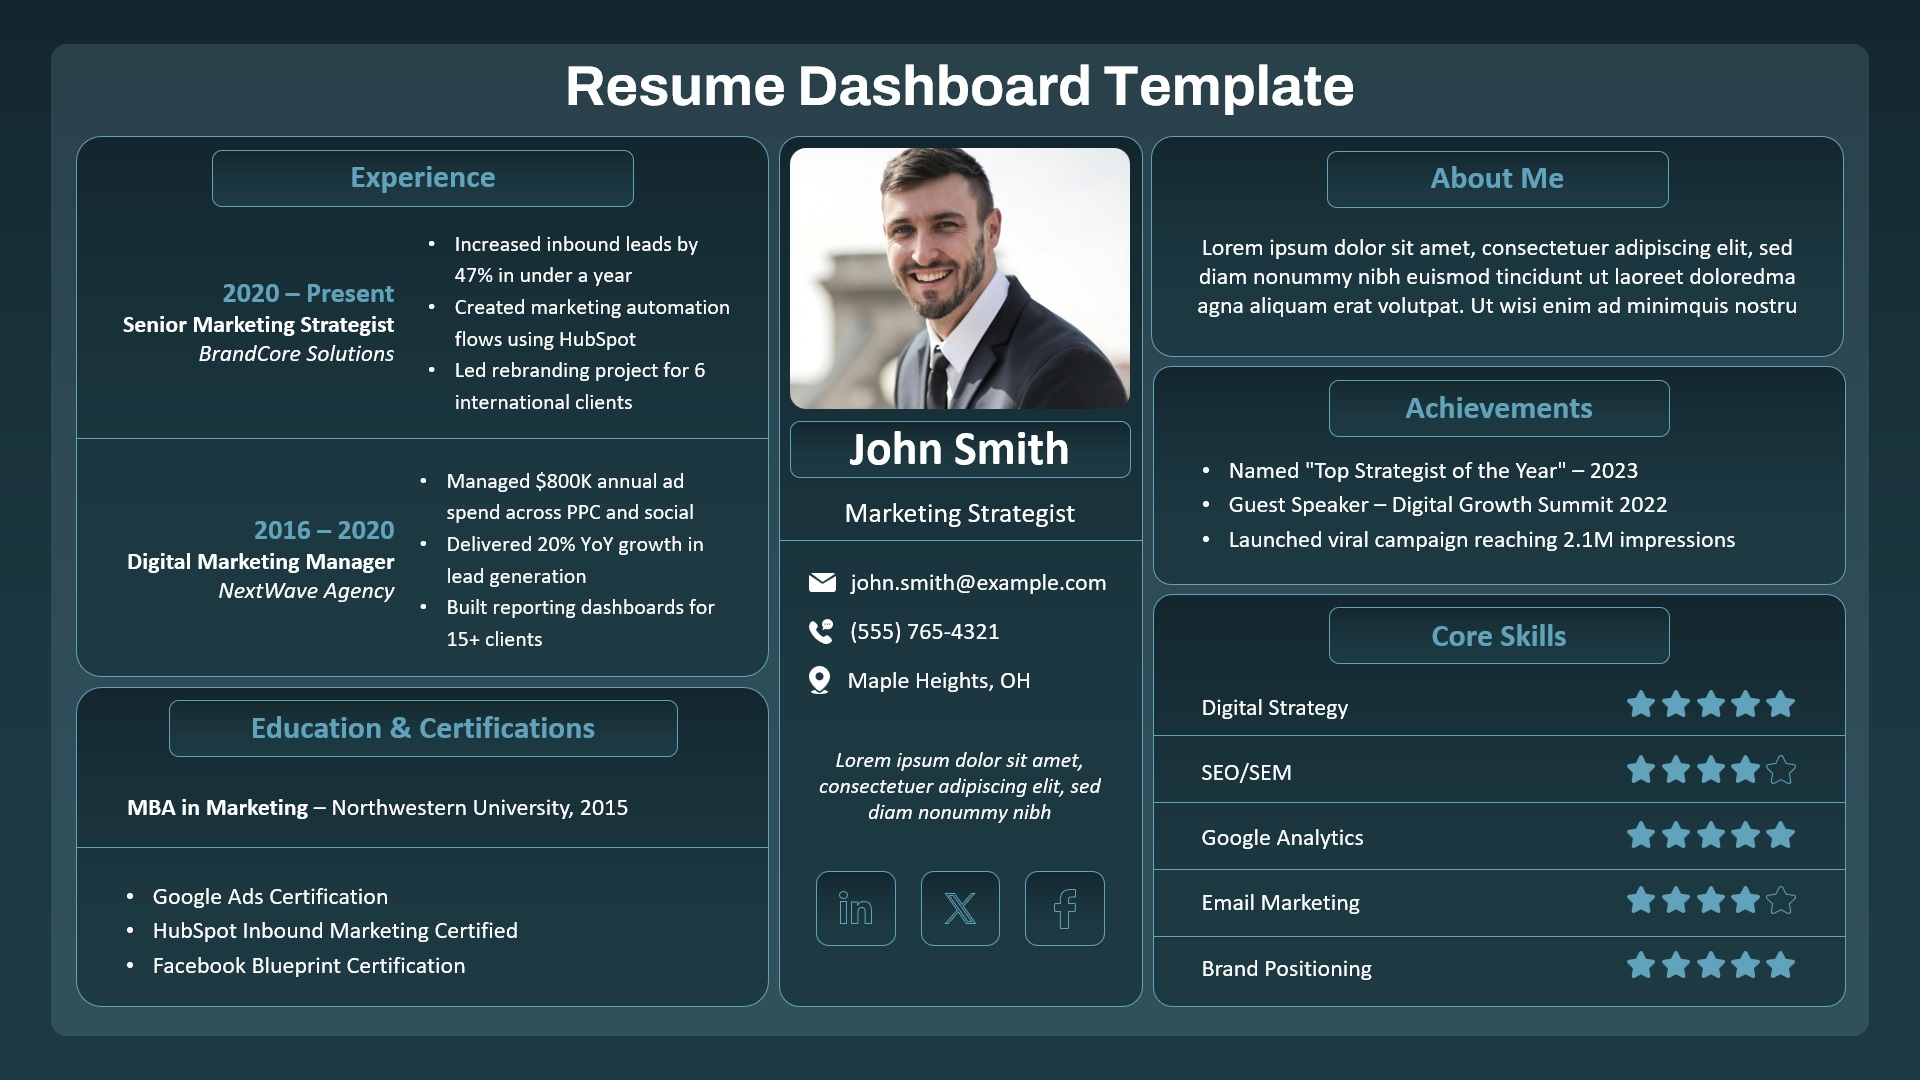
Beyond city planning, this dashboard can be adapted for enterprise monitoring, smart campus analytics, or logistics operations. Replace icons and graphs to track energy usage, fleet management, or facility metrics in other industries such as utilities or transportation.
FAQs
You May Also Like These Presentation Templates


- Free
- Free
- Free

- Free

- Free
- Free
- Free
- Free
- Free
- Free

- Free

- Free
- Free

- Free
- Free