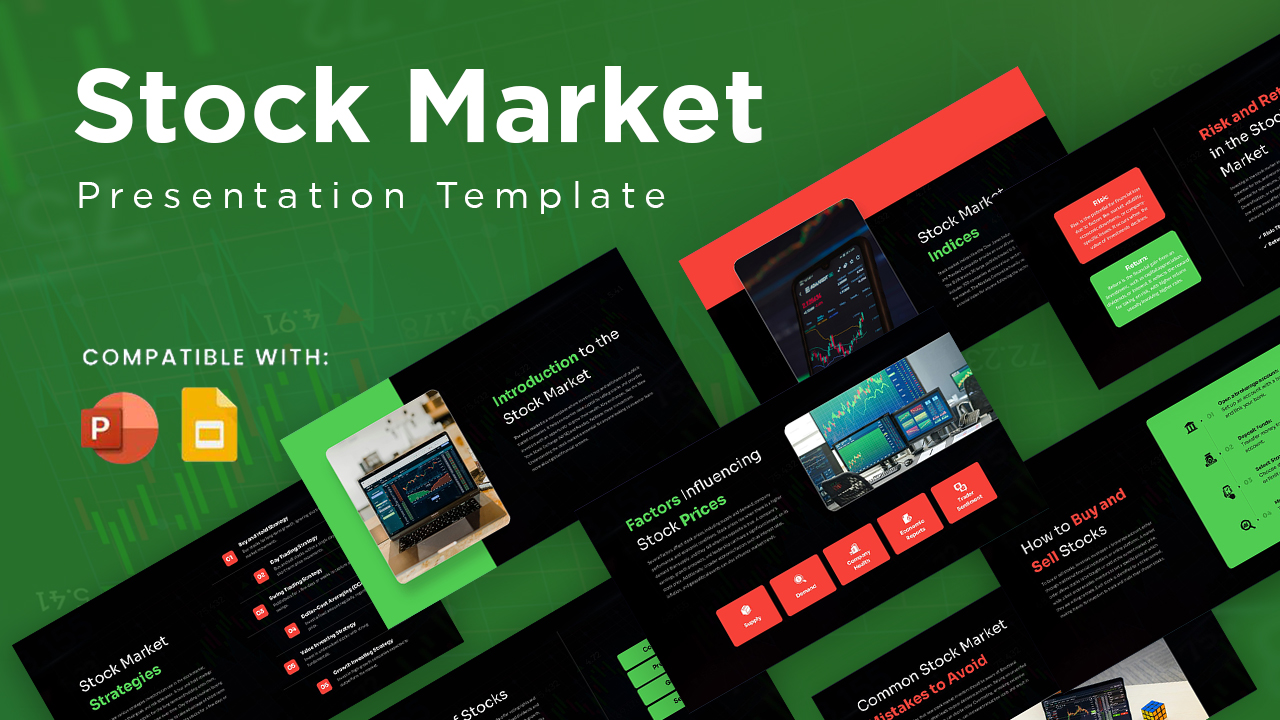
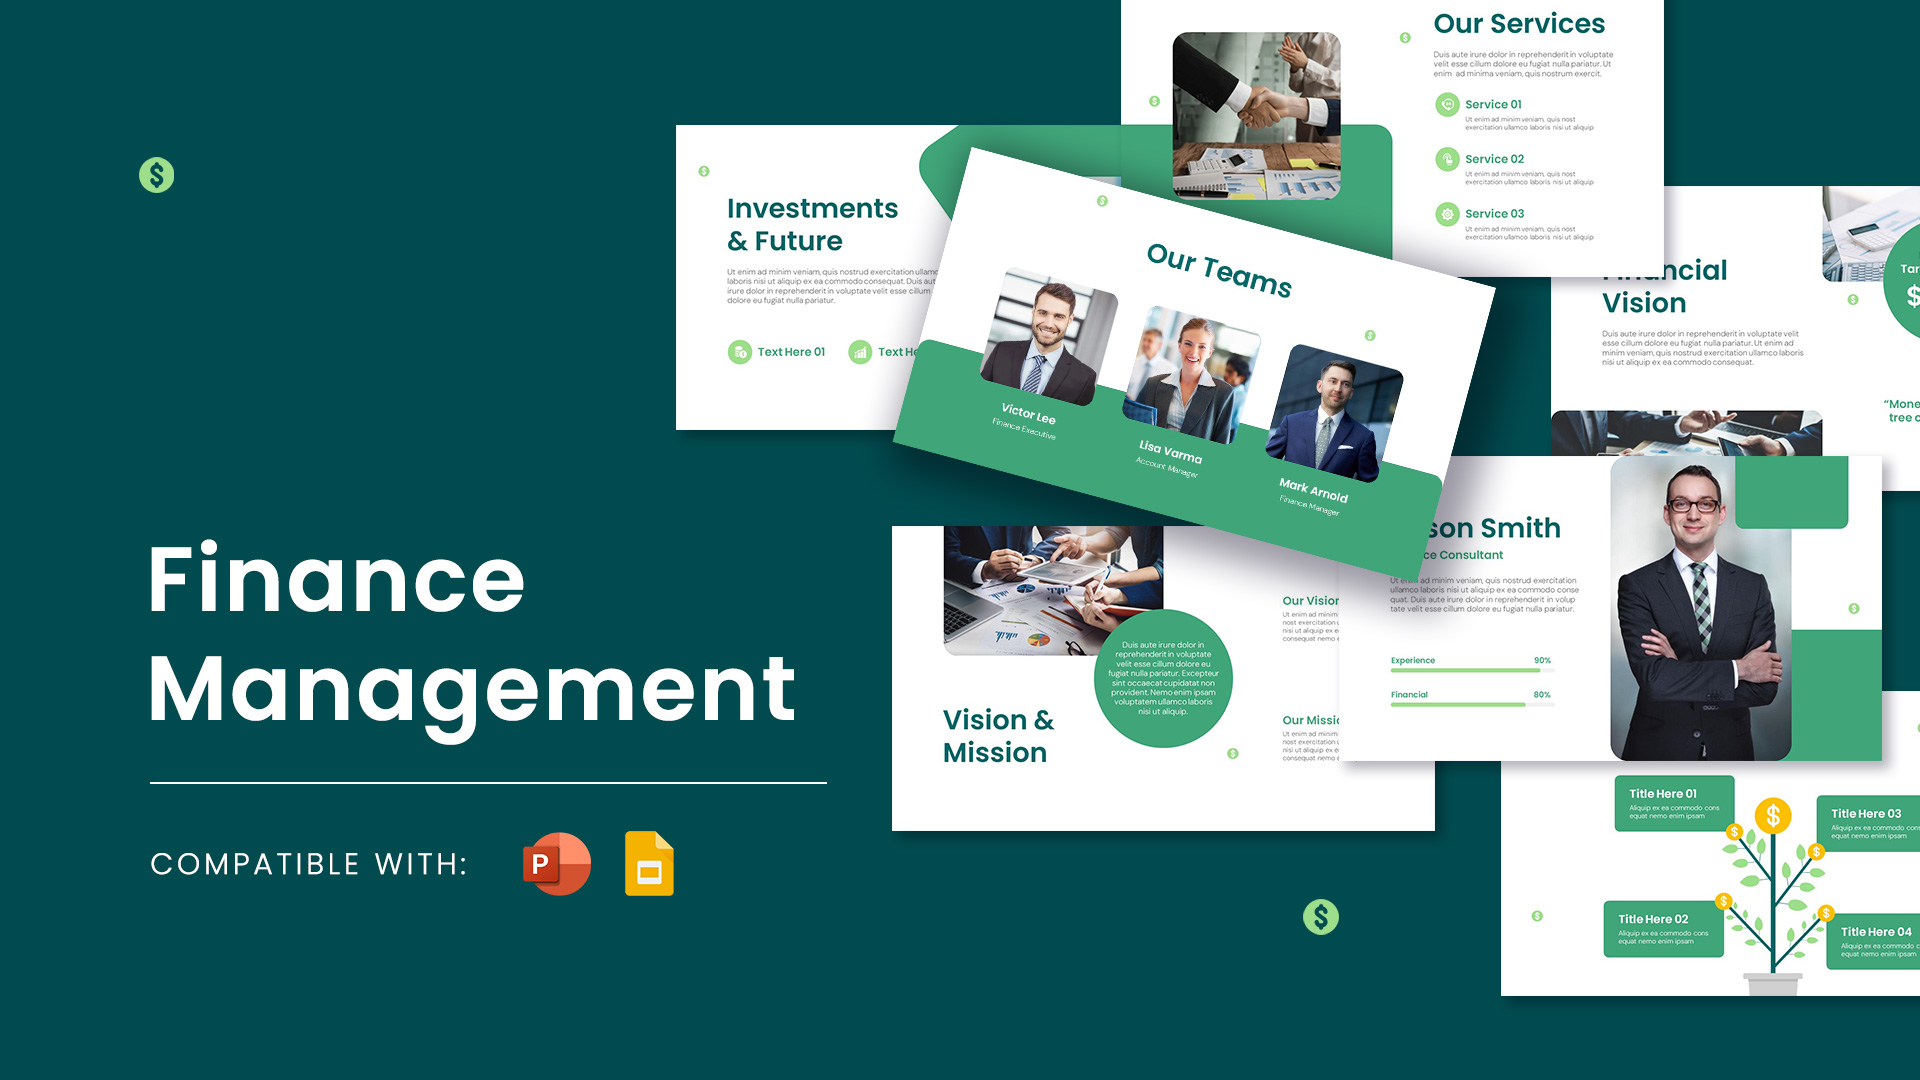
Candle Stock Chart PowerPoint Presentation Template
Present financial market trends with clarity using this Candle Stock Chart Presentation Template, designed for PowerPoint and Google Slides. This professional template helps analysts, investors, traders, and business professionals visualize stock price movements through a clean and modern candlestick chart layout. Whether you’re explaining historical market performance, comparing trading sessions, or presenting investment insights, this slide provides a structured and visually engaging way to communicate financial data.
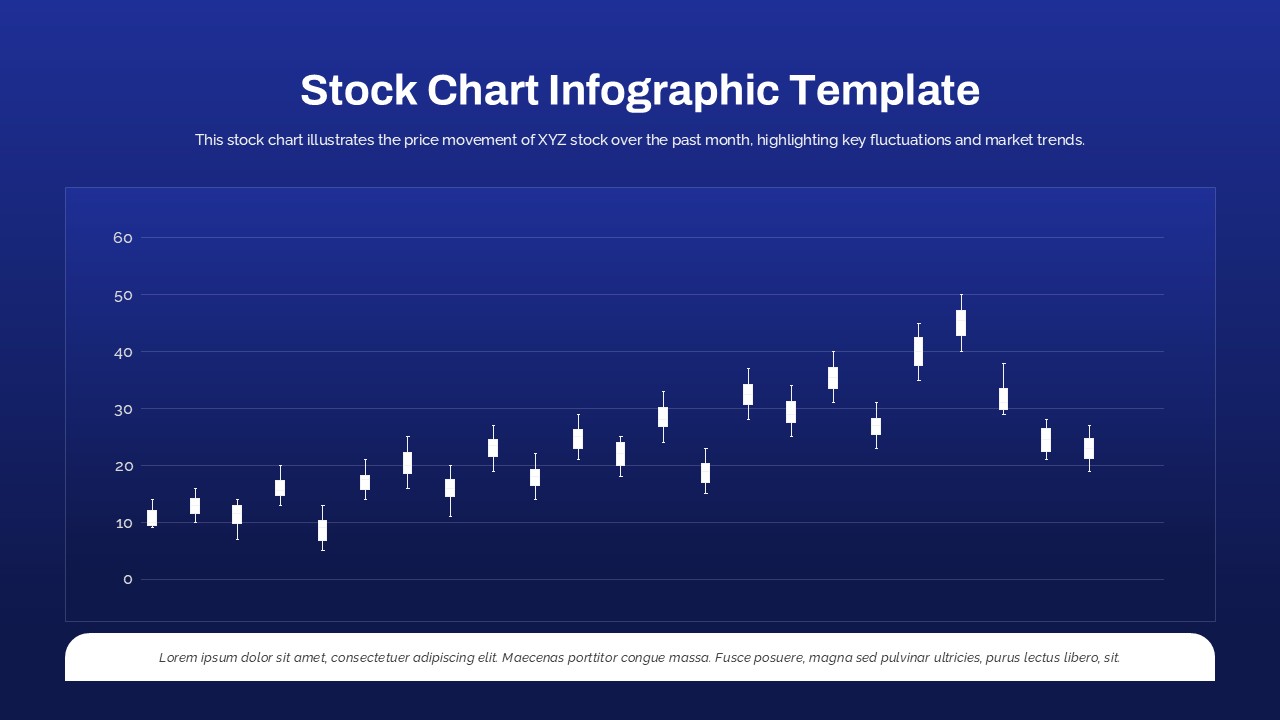
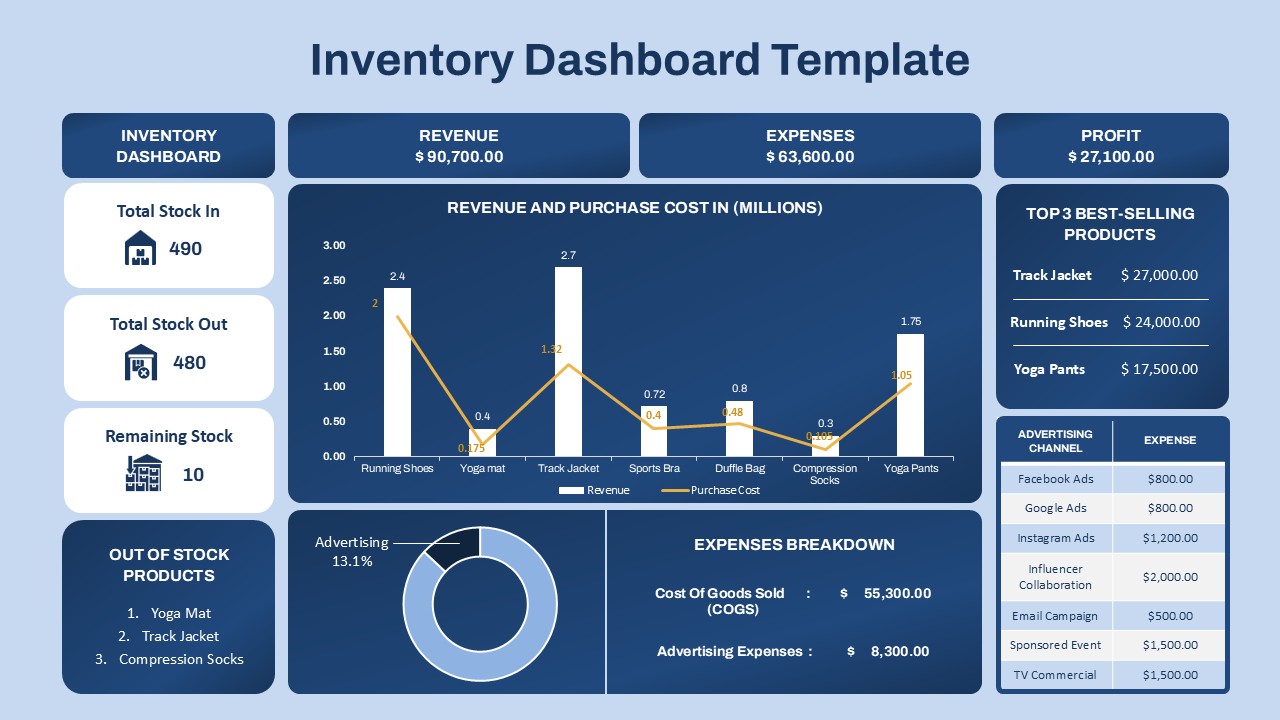
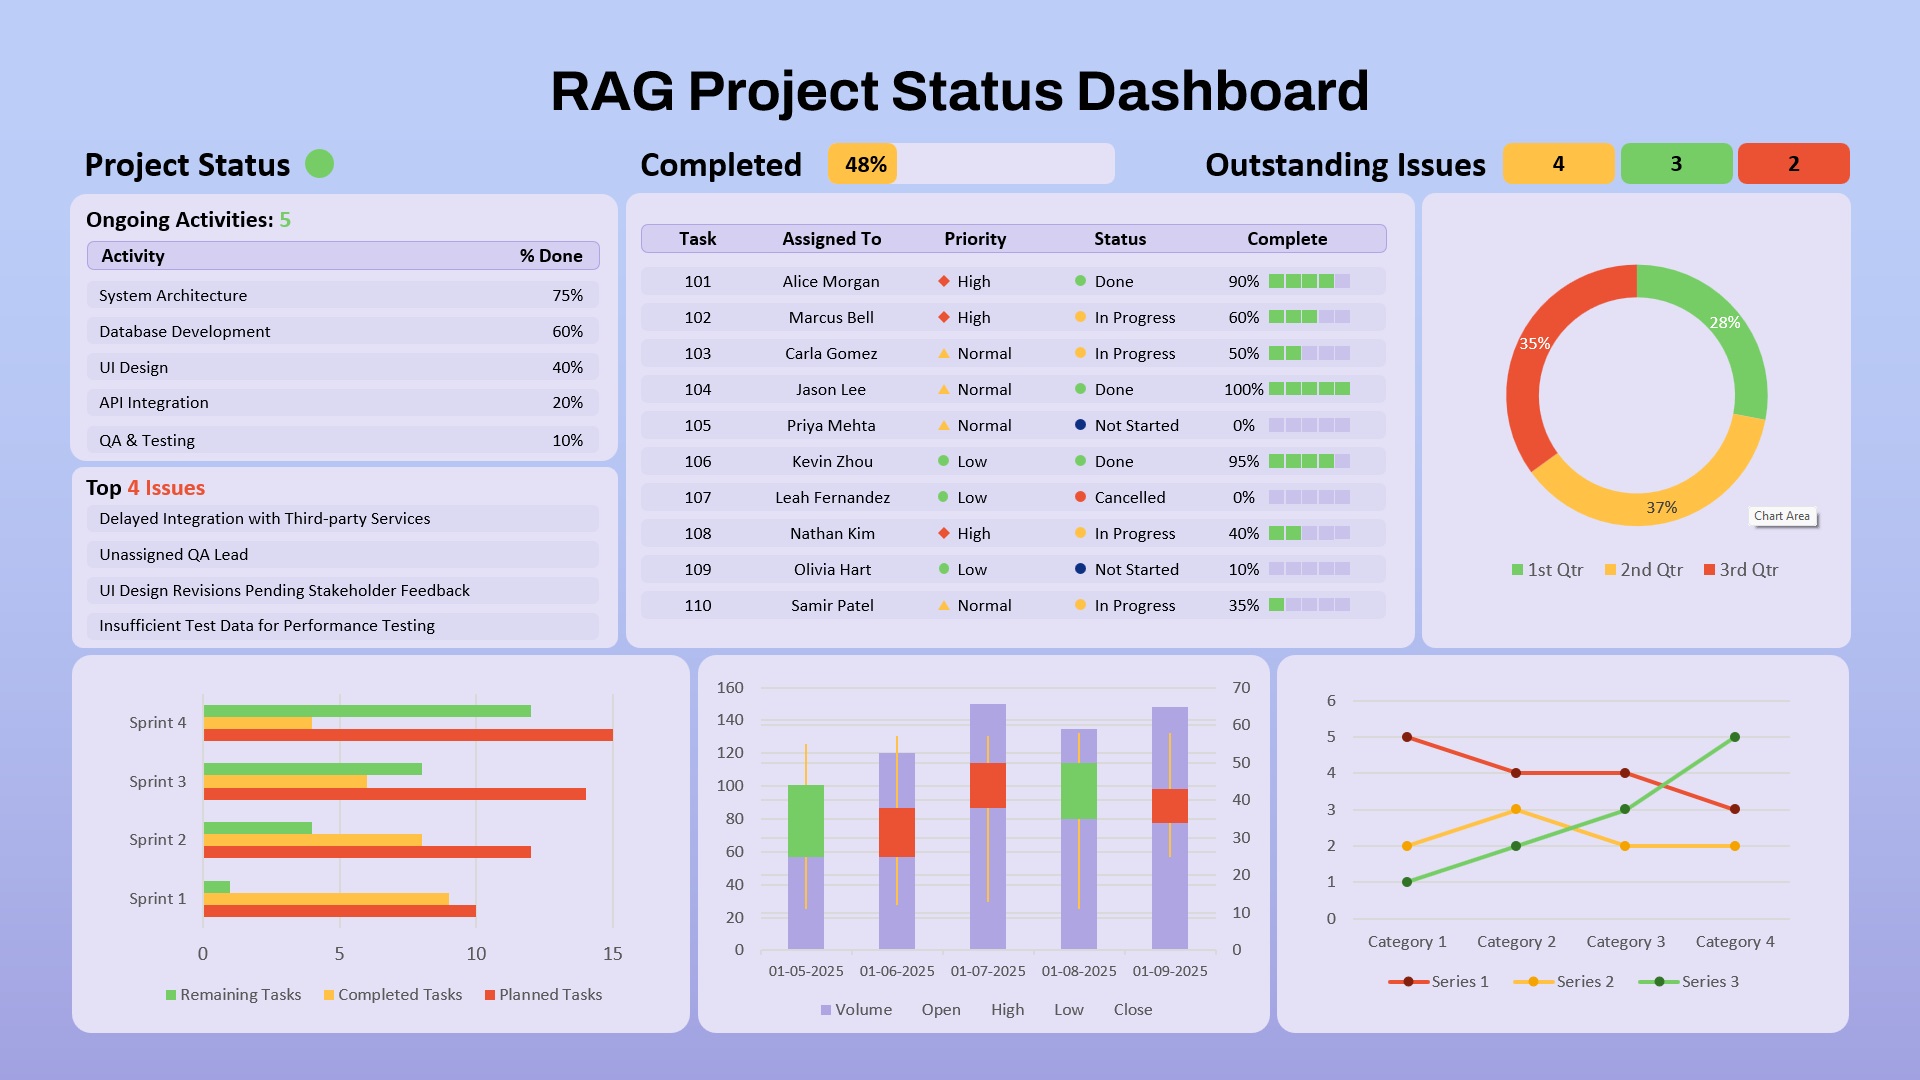
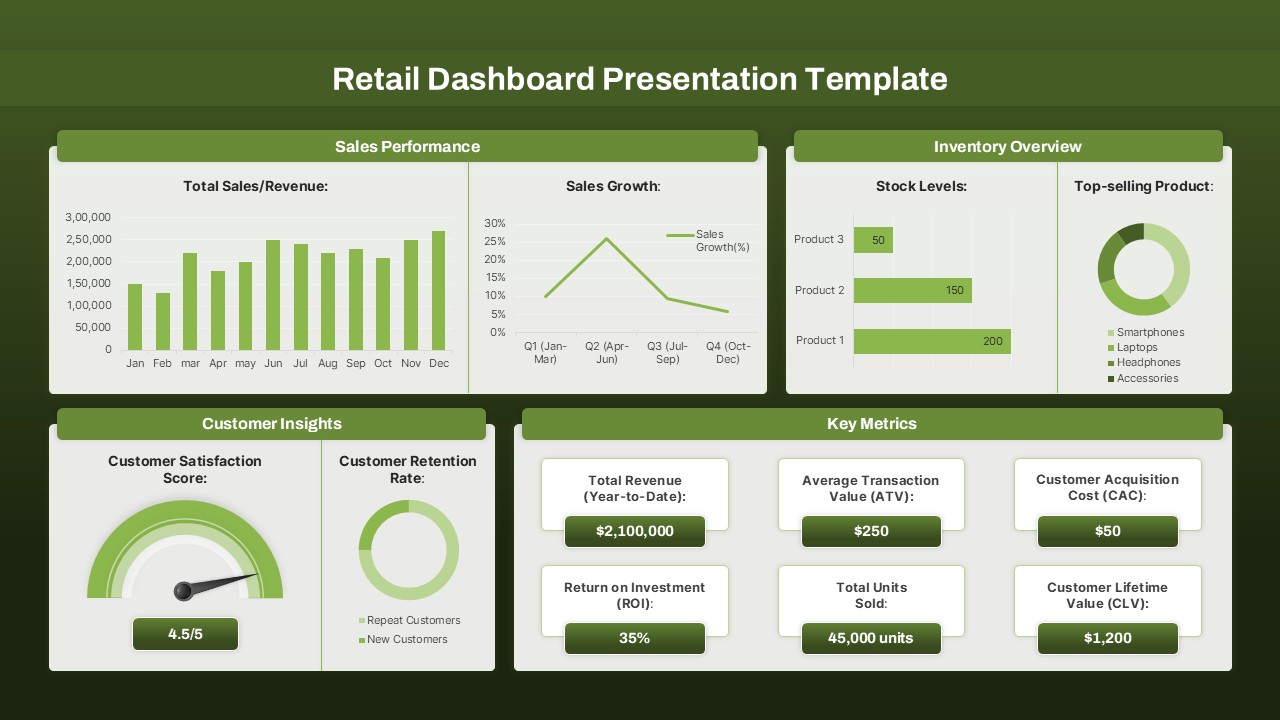
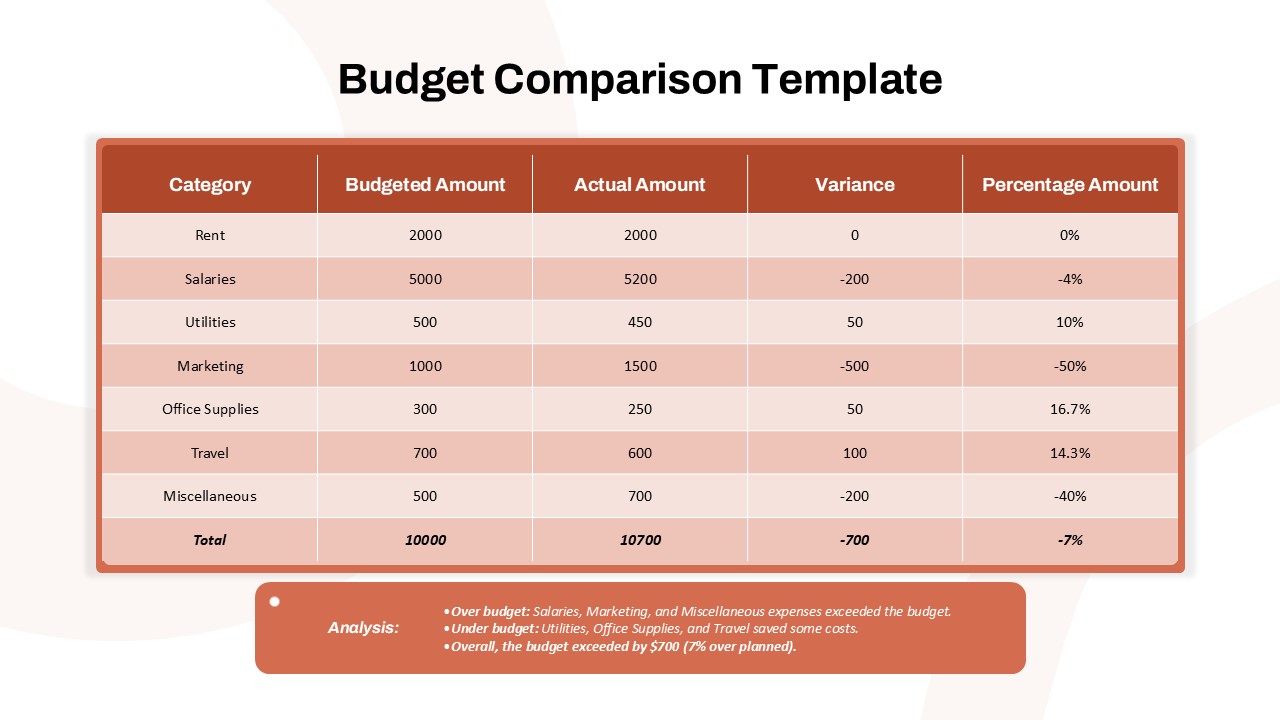
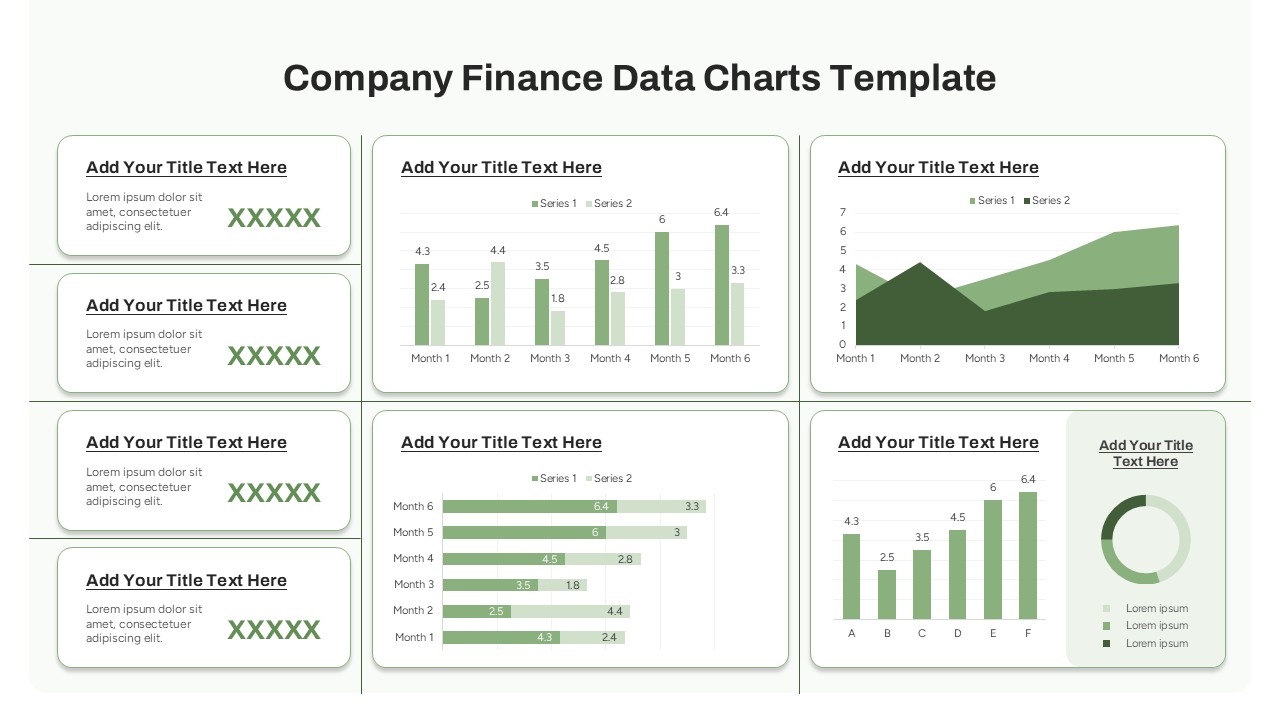
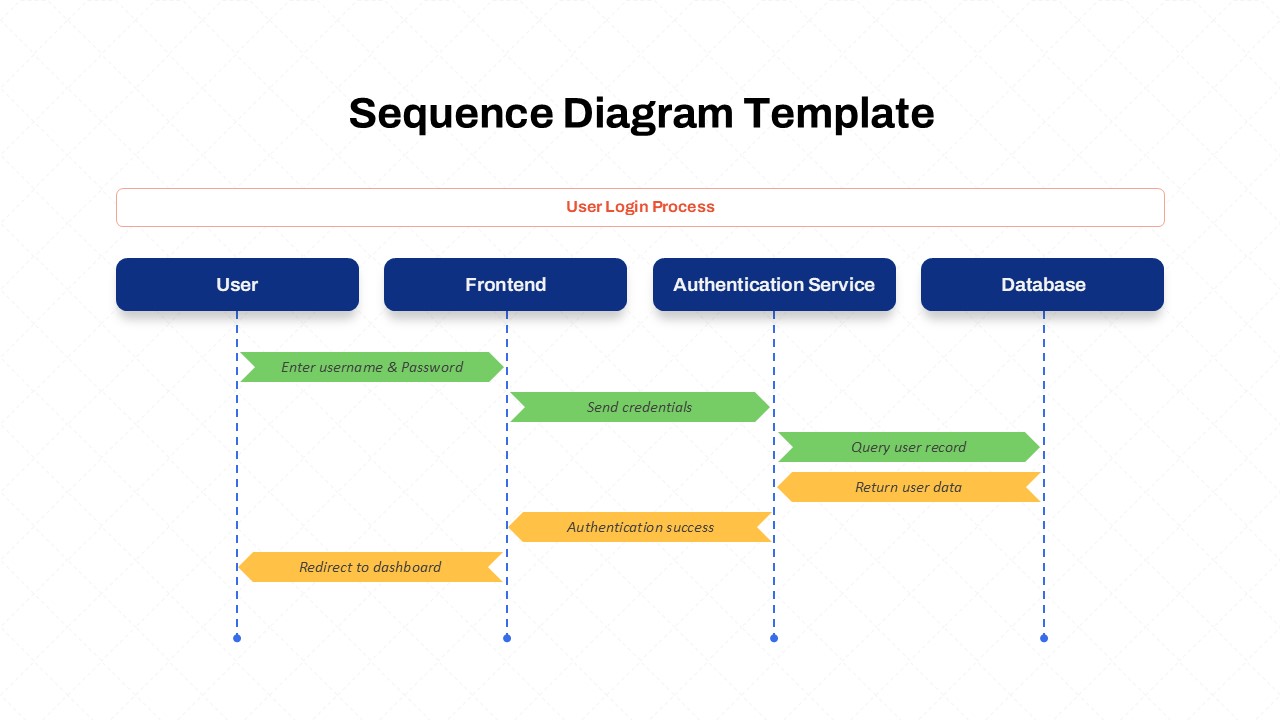
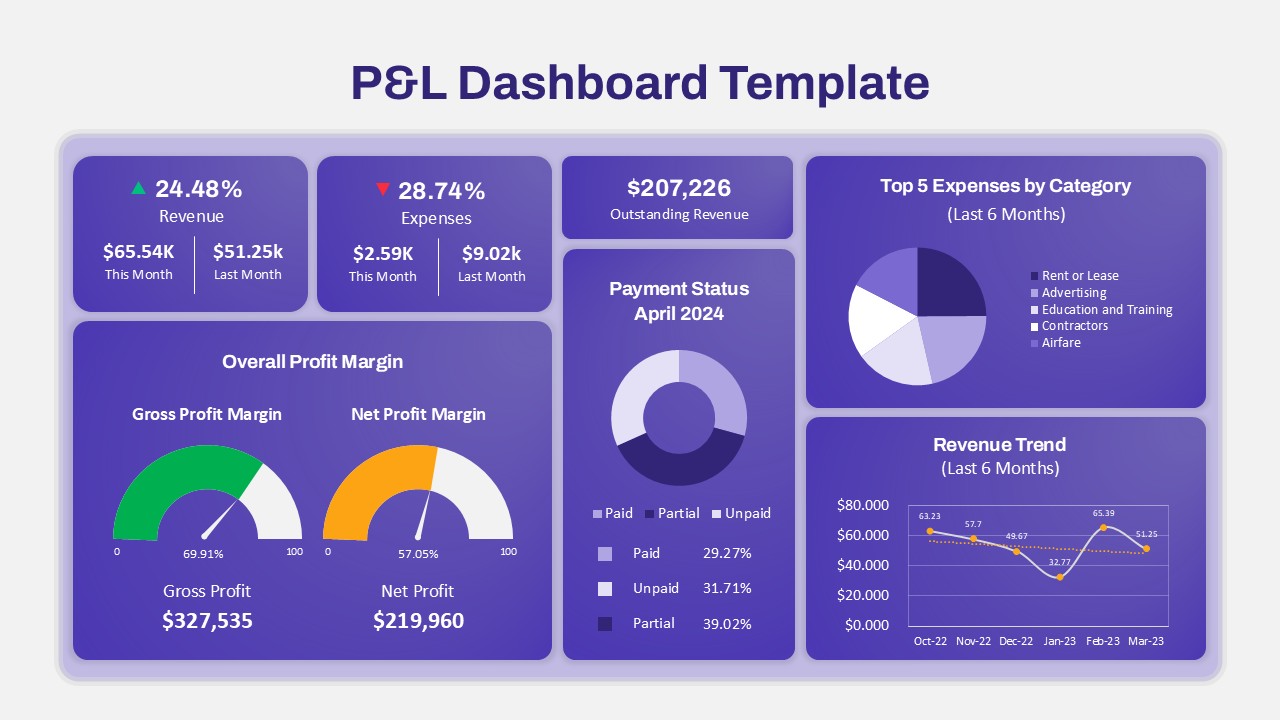
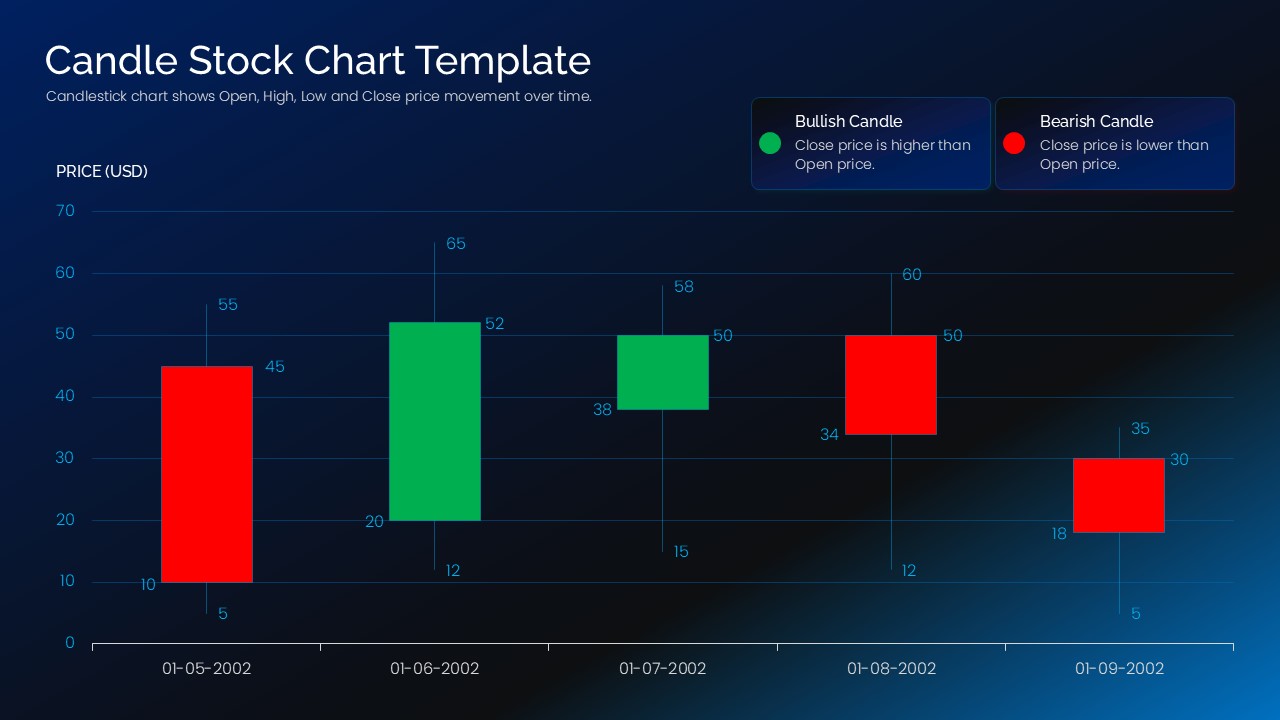
The template features a fully editable candlestick chart displaying the Open, High, Low, and Close (OHLC) values across multiple time periods. Distinct bullish (green) and bearish (red) candlesticks make it easy for audiences to identify upward and downward price movements at a glance. An integrated legend explains the meaning of each candle type, making the presentation accessible even for viewers who are unfamiliar with technical charting.
Designed with a sleek dark background and vibrant chart elements, the template emphasizes readability while maintaining a polished, corporate appearance. Every chart element, including candlesticks, labels, axes, colors, and text, can be customized to match your data, branding, or presentation style. This flexibility allows you to adapt the slide for daily stock updates, investment reports, portfolio reviews, market research presentations, or financial education.
The template is suitable for a wide range of industries, including finance, banking, investment management, fintech, consulting, and academic institutions. It can also be used to explain market volatility, trading strategies, price action, trend analysis, and technical indicators during client meetings, classroom lectures, or executive presentations.
Compatible with Microsoft PowerPoint , this template offers a professional solution for presenting financial information with confidence. Whether you’re preparing an investor pitch, conducting a trading workshop, delivering a quarterly financial review, or teaching technical analysis concepts, this editable candlestick chart helps transform complex market data into a presentation that is both informative and visually compelling.
See more

Aspect Ratio
16:9Item ID
SKT04623
Features of this template
Other User Cases of the Template
Stock market analysis, Technical analysis presentations, Investment portfolio reviews, Financial reporting, Trading strategy presentations, Market trend analysis, Equity research reports, Forex market analysis, Cryptocurrency price analysis, Commodity price tracking, Risk management presentations, Banking reports, Fintech presentations, Investor meetings, Quarterly business reviews, Financial education, Economics lectures, Capital market presentations, Wealth management reports, Trading workshops, Corporate finance presentations
FAQs
You May Also Like These Presentation Templates


- Free

- Free

- Free


- Free