Scope 1-2-3 Emissions Template for PowerPoint and Google Slides
Organizations across industries now need to report greenhouse gas emissions in a structured and transparent way. Clear visual communication helps leadership teams, sustainability officers, and investors understand where emissions occur across a business. The Scope 1-2-3 Emissions Template gives presenters a ready-to-use slide layout for mapping direct and indirect emission categories professionally.
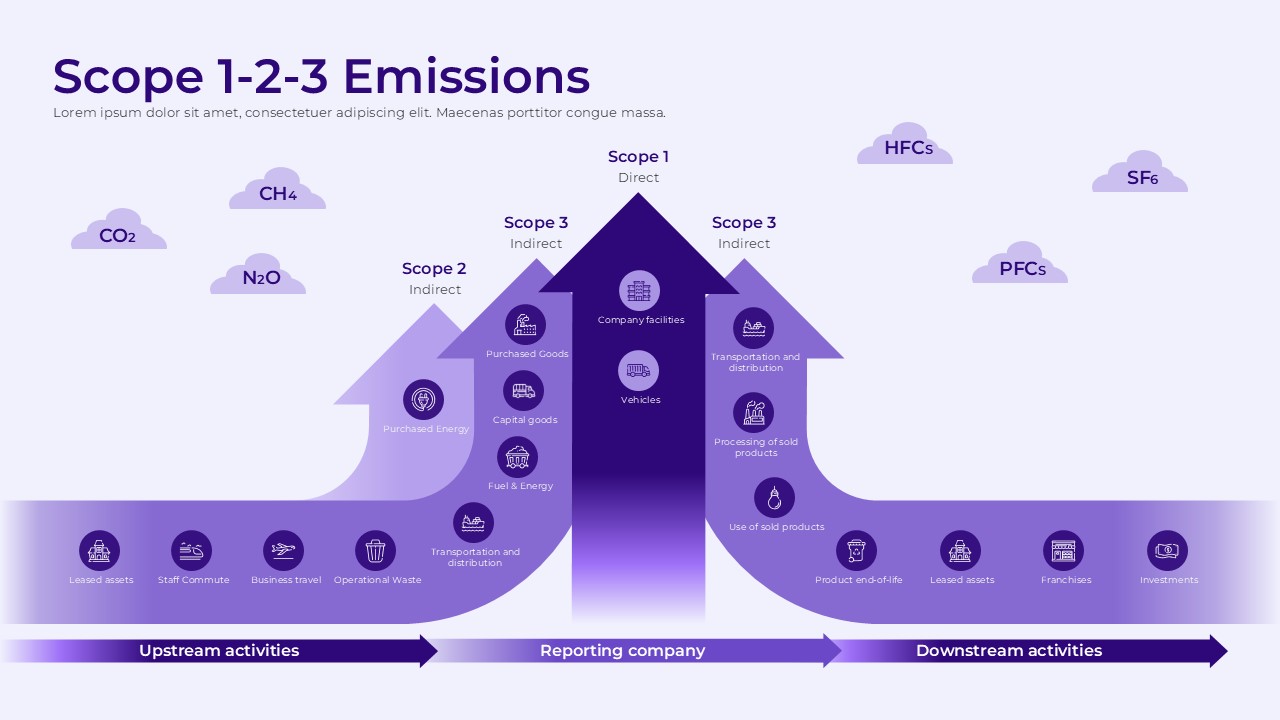
This template features a three-arrow upward diagram on a light purple background. Distinct arrow shapes in varying shades of purple and violet separate each emission scope. Scope 1 covers direct emissions from company facilities and vehicles. Scope 2 addresses indirect emissions from purchased energy. Meanwhile, Scope 3 covers indirect emissions across both upstream and downstream activities. Gas type labels including CO2, CH4, N2O, HFCs, PFCs, and SF6 appear as cloud icons across the slide. A horizontal flow at the bottom separates upstream activities, the reporting company, and downstream activities.
Both PowerPoint and Google Slides formats are available for this template. Sustainability teams, ESG consultants, corporate strategists, and environmental reporting professionals will find it useful. Teams can use it to present emission scope structures, carbon reporting frameworks, and sustainability disclosures to internal and external audiences.
What Is This Scope 1-2-3 Emissions Template?
The Scope 1-2-3 Emissions Template is a single-slide presentation layout built around a layered arrow diagram. A clear visual hierarchy organizes greenhouse gas emission sources into three scope categories. The largest and darkest arrow at the center represents Scope 1 direct emissions. Behind it, a medium arrow represents Scope 2 indirect emissions. The widest arrow at the back represents Scope 3 indirect emissions on both sides.
Each arrow contains labeled icons representing specific emission sources. Scope 1 includes company facilities and vehicles. Scope 2 includes purchased energy. Furthermore, Scope 3 upstream includes purchased goods, capital goods, fuel and energy, and transportation and distribution. On the downstream side, Scope 3 includes transportation, processing of sold products, use of sold products, product end-of-life, leased assets, franchises, and investments.
A bottom strip with three directional labels divides the slide into upstream activities, the reporting company, and downstream activities. Together, these sections make this a complete layout for presenting a full emission scope overview in one structured visual.
When to Use This Template
This template works well when a team needs to present greenhouse gas emission categories to leadership, investors, or regulatory bodies. Corporate sustainability reports, ESG disclosure presentations, and environmental strategy briefings are strong use cases for this layout. The layered arrow diagram clearly separates direct and indirect emission sources across the full value chain. It is also a practical choice for carbon accounting workshops, climate strategy planning sessions, and sustainability team reviews where a structured visual overview delivers more clarity than a data table or text-heavy slide.
Customization and Editing Options
All text labels in this template are fully editable. The slide title, scope category labels, emission source labels inside each arrow, gas type cloud labels, and the bottom strip labels are all straightforward to update. Moreover, each icon label can be changed to reflect emission sources specific to any industry or organization.
The purple and violet color scheme across the three arrows can be adjusted using the shape fill option in PowerPoint or Google Slides. Brand colors or standard ESG color conventions can replace the defaults on each arrow individually. In addition, the gas type cloud icons and their labels can be added, removed, or repositioned without disrupting the central diagram structure.
The icon set inside each arrow is also replaceable. Users can swap or relabel icons to match specific emission categories relevant to their sector. Furthermore, the bottom directional strip labels can be updated to reflect a specific value chain structure. Font size, weight, and alignment remain adjustable throughout the slide.
PowerPoint and Google Slides Compatibility
The Scope 1-2-3 Emissions Template works fully with Microsoft PowerPoint and Google Slides. Both formats are available for immediate download without requiring additional plugins, fonts, or software installations. The light purple background, layered arrow diagram, icon elements, and gas cloud labels render consistently across both platforms.
Google Slides users can open and edit the file directly in a browser and share it with team members for real-time collaboration. In contrast, the PowerPoint version supports offline editing and allows further customization of shapes, colors, and transitions. The widescreen 16:9 format shown in the template image carries over to both versions, making it suitable for screen presentations, projector displays, and digital sharing.
See more

Aspect Ratio
16:9Item ID
SKT04576
Features of this template
Other Use Cases of This Template
Corporate ESG and sustainability report presentations, Carbon footprint disclosure decks for investors and regulators, Climate strategy and net-zero roadmap presentations, Environmental compliance and regulatory reporting decks, Supply chain sustainability assessment presentations, Scope 3 emission mapping and supplier engagement decks, Green finance and sustainable investment strategy presentations, Internal sustainability team training and onboarding slides, Annual sustainability report summary decks for board meetings, Carbon accounting and emission inventory presentationsFAQs
You May Also Like These Presentation Templates


- Free
- Free
- Free
- Free
- Free
- Free
- Free
- Free
- Free
- Free
- Free
- Free
- Free
- Free
- Free
- Free
- Free