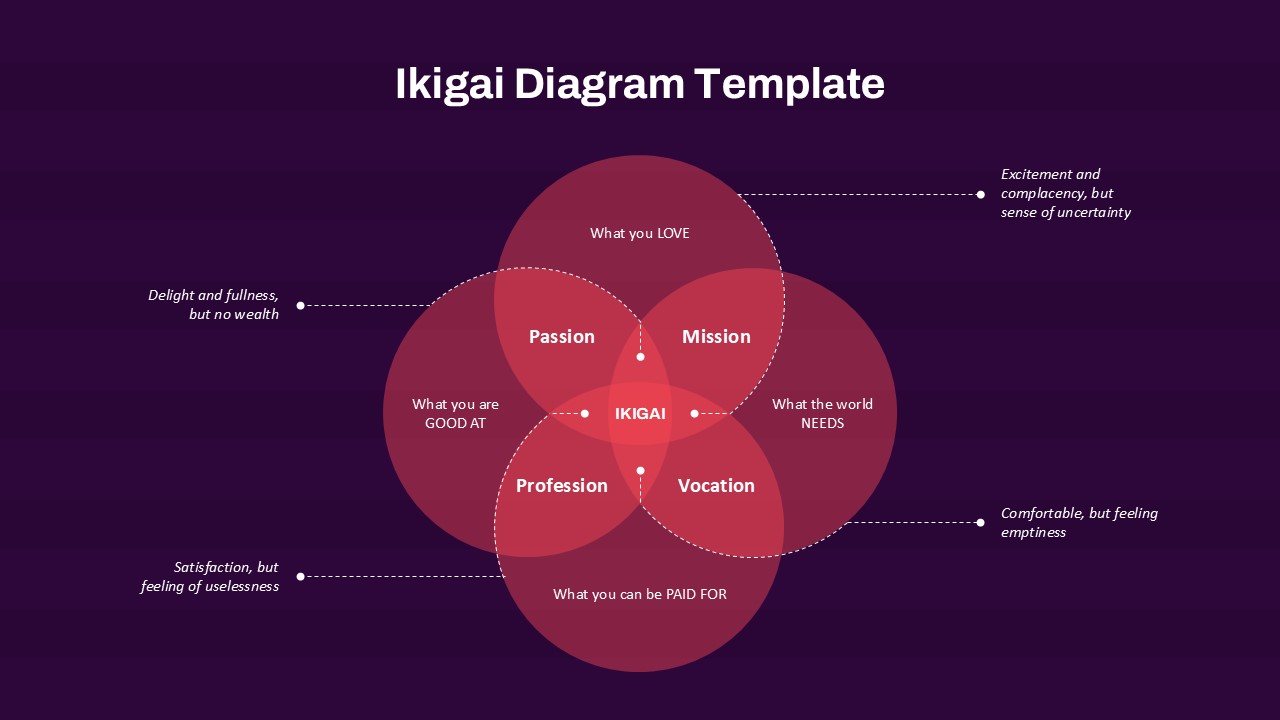
6-Way Venn Diagram Template for PowerPoint & Google Slides
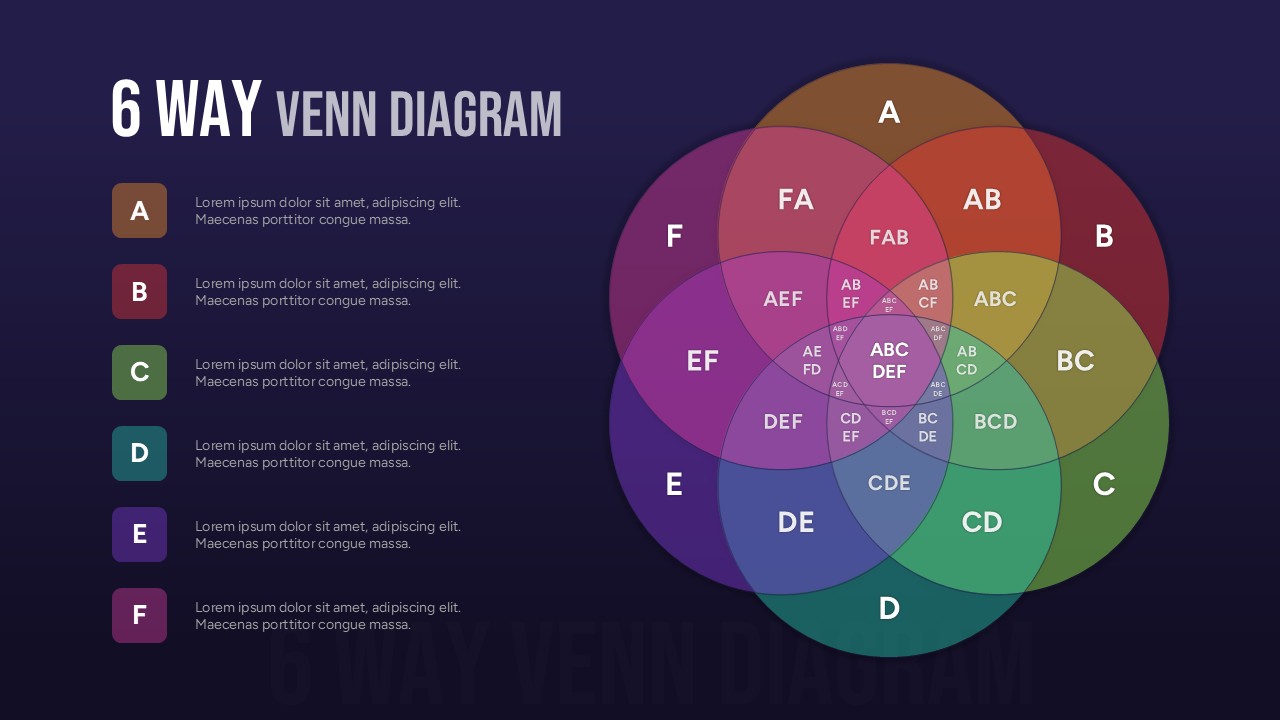
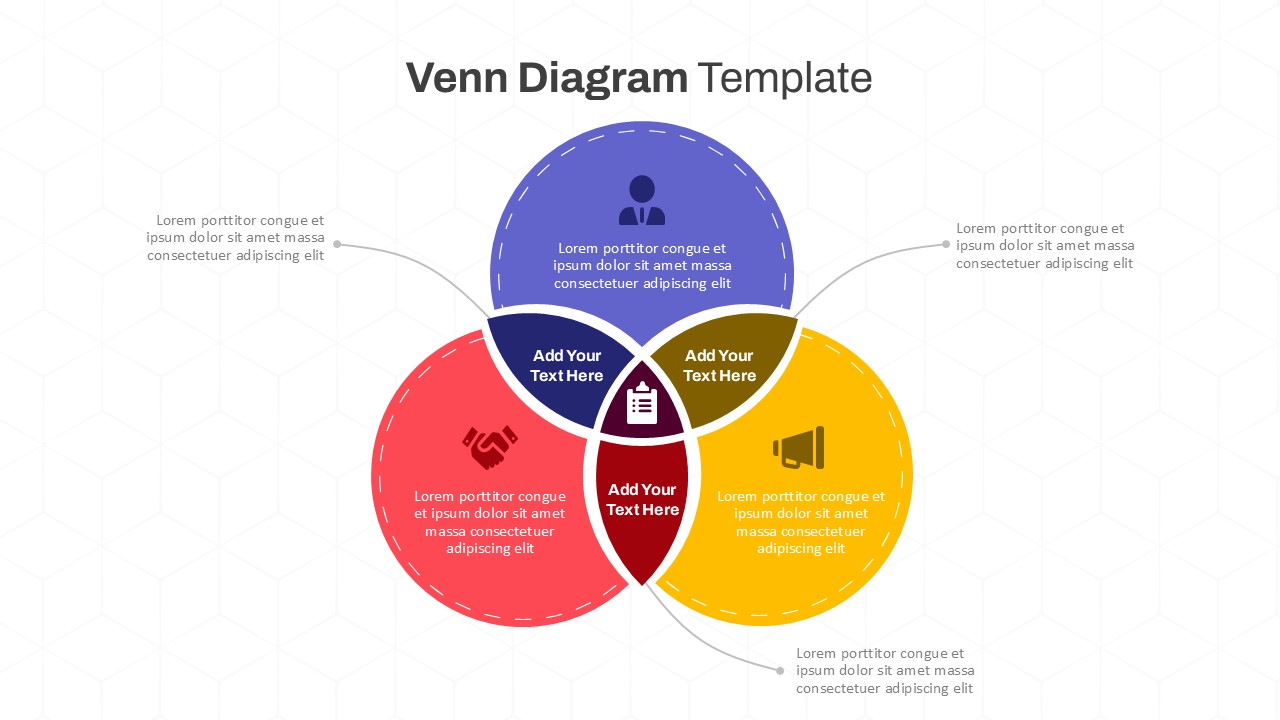
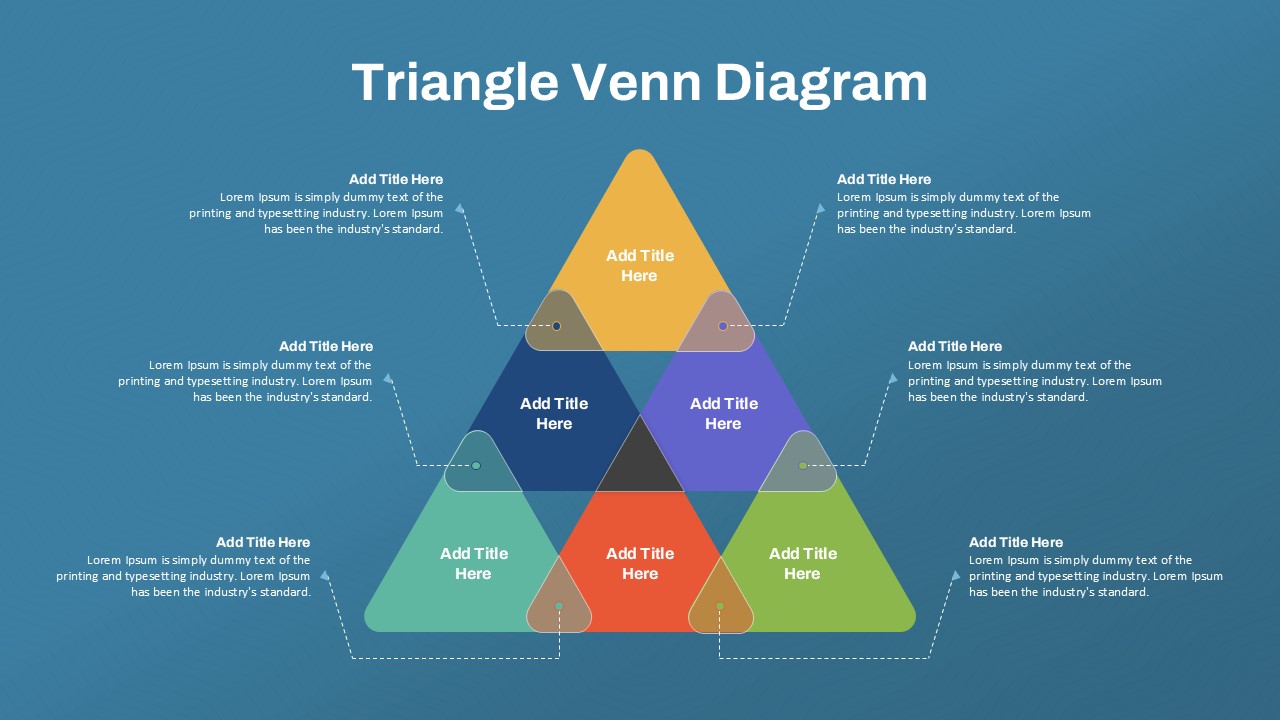
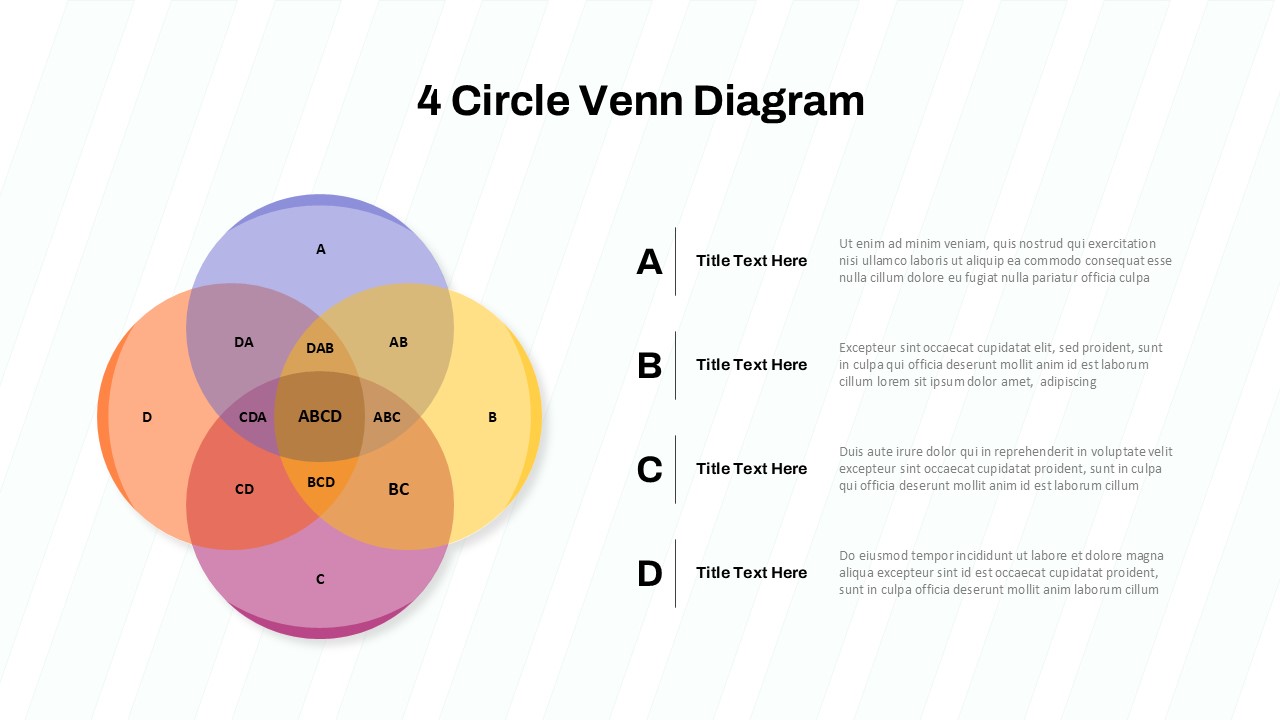
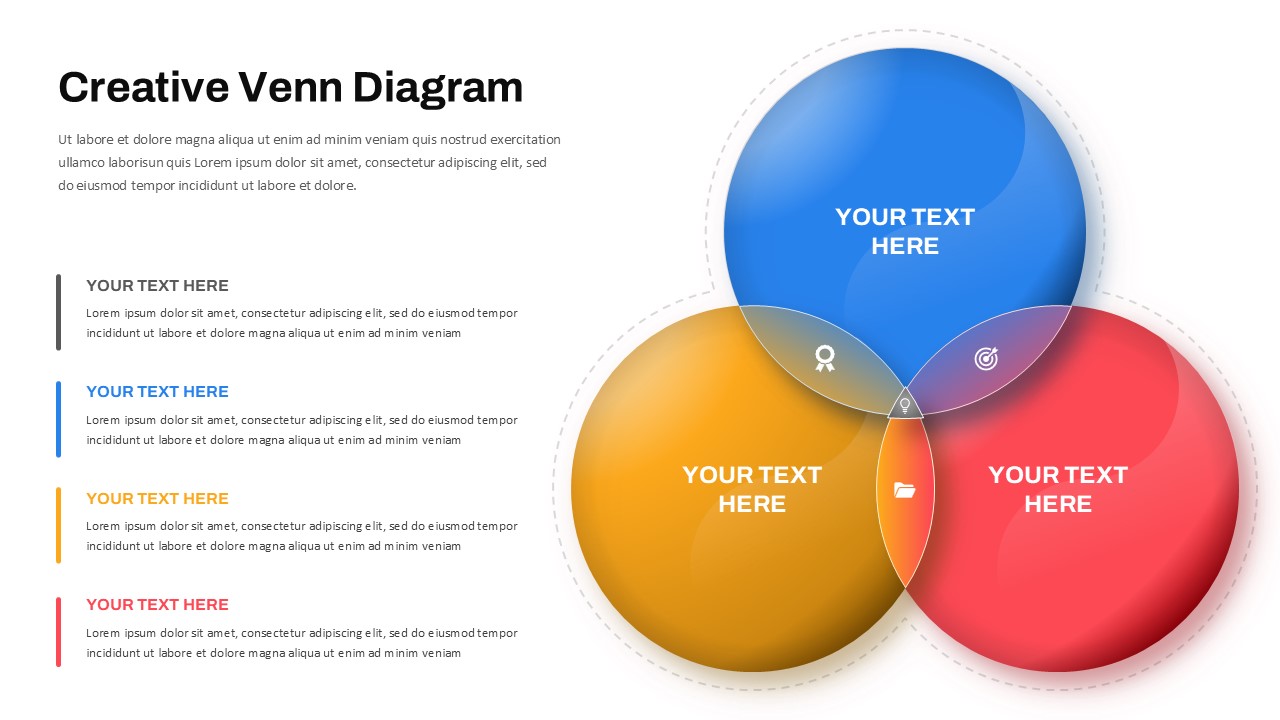
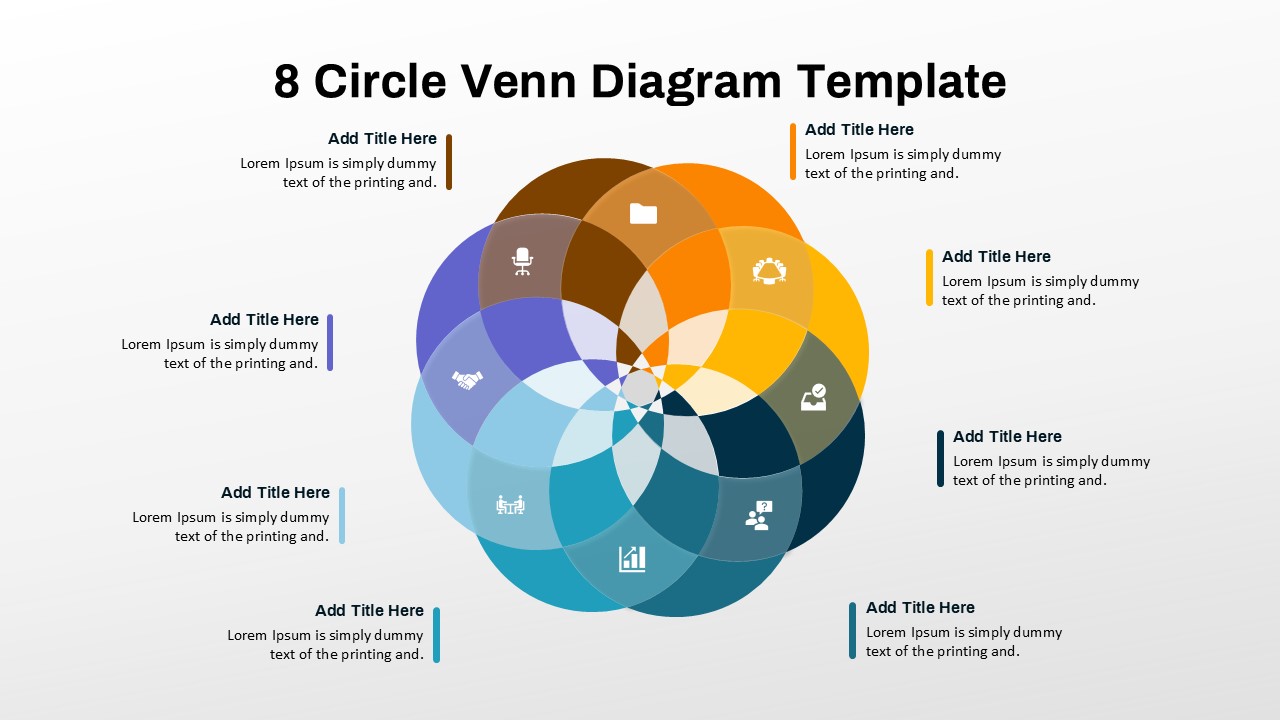
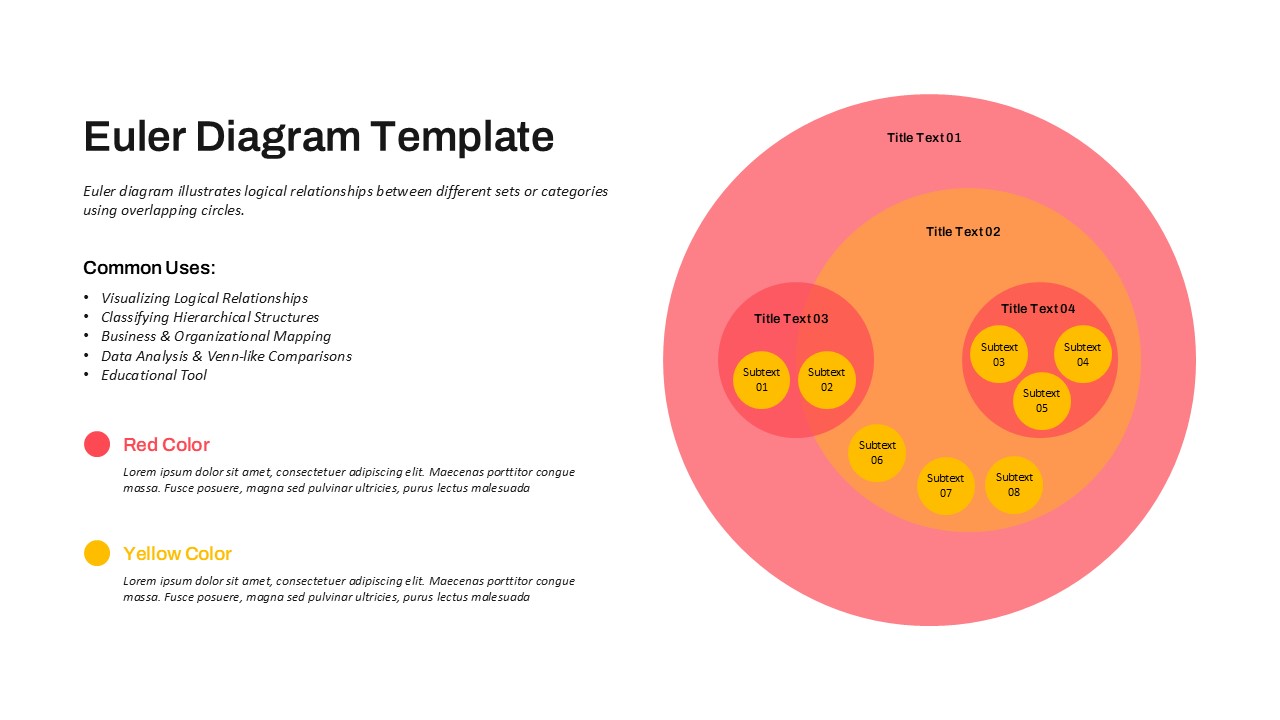
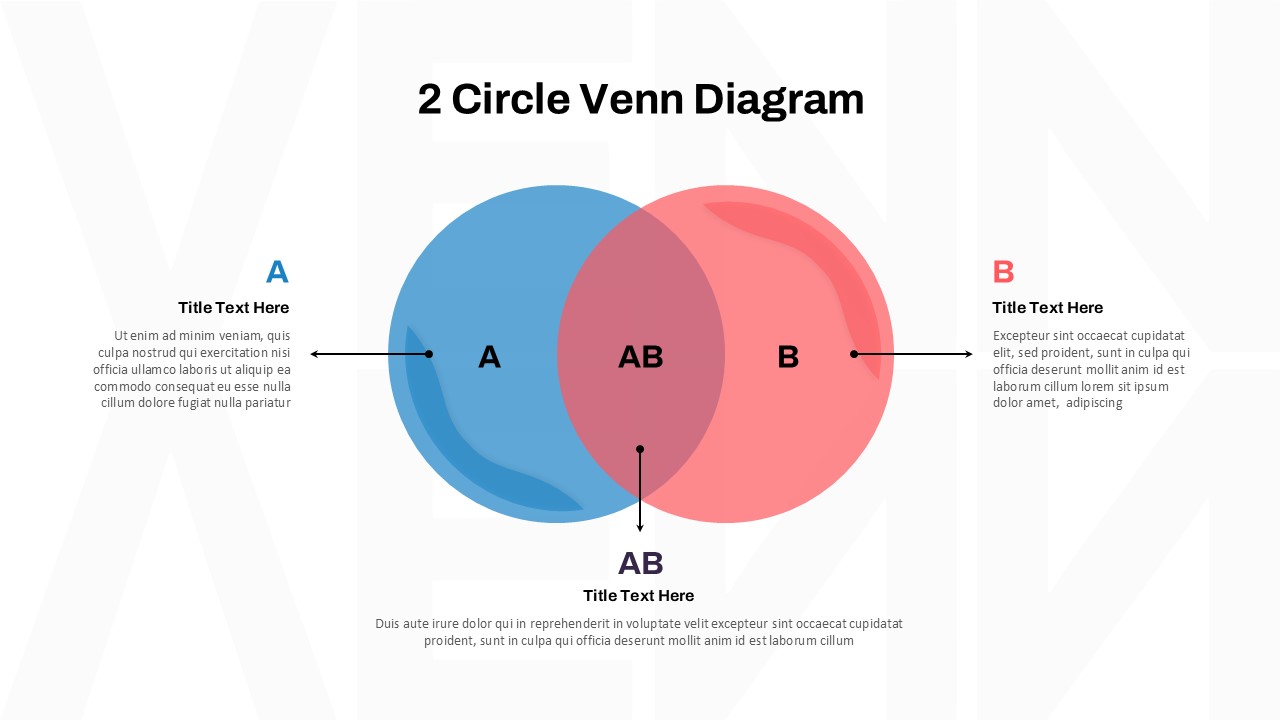
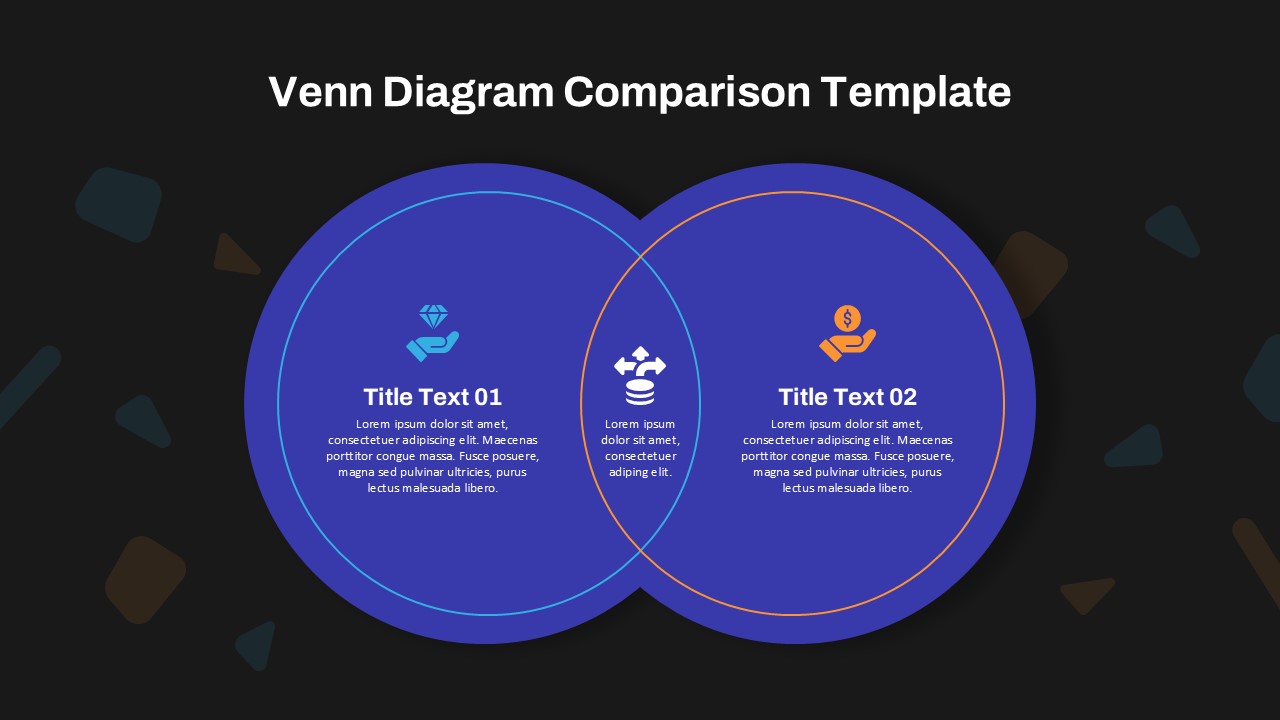
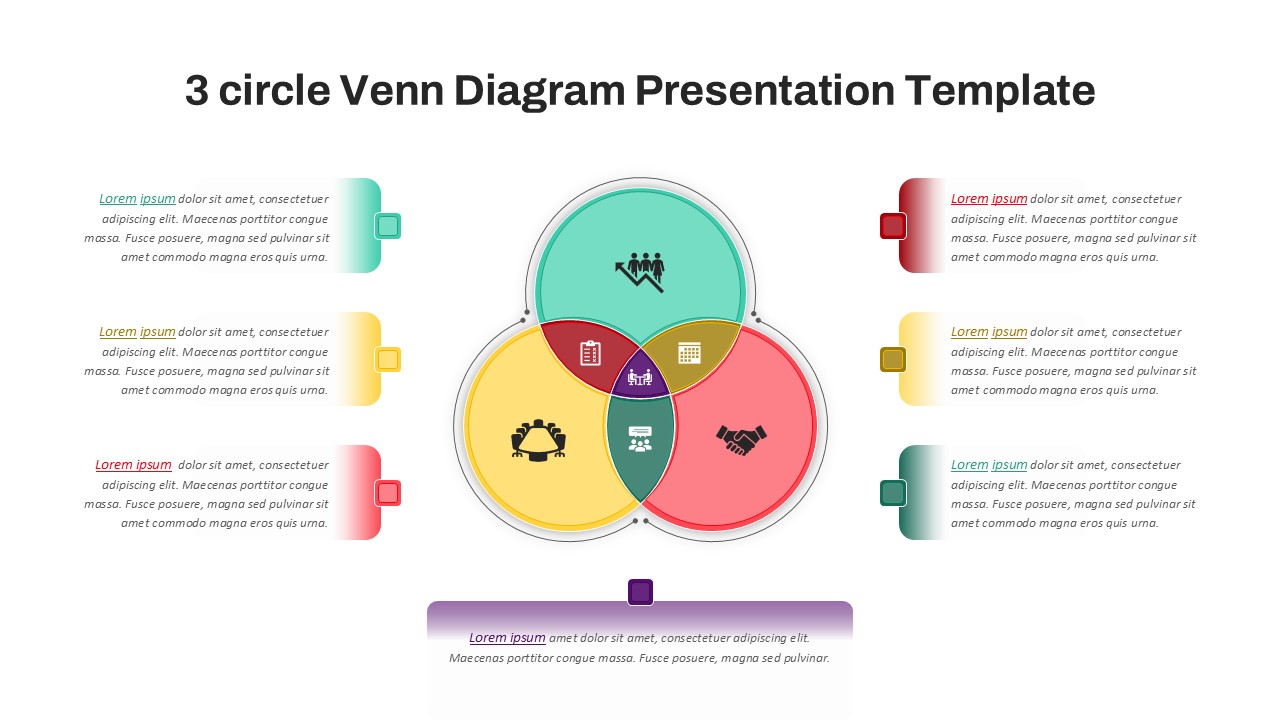
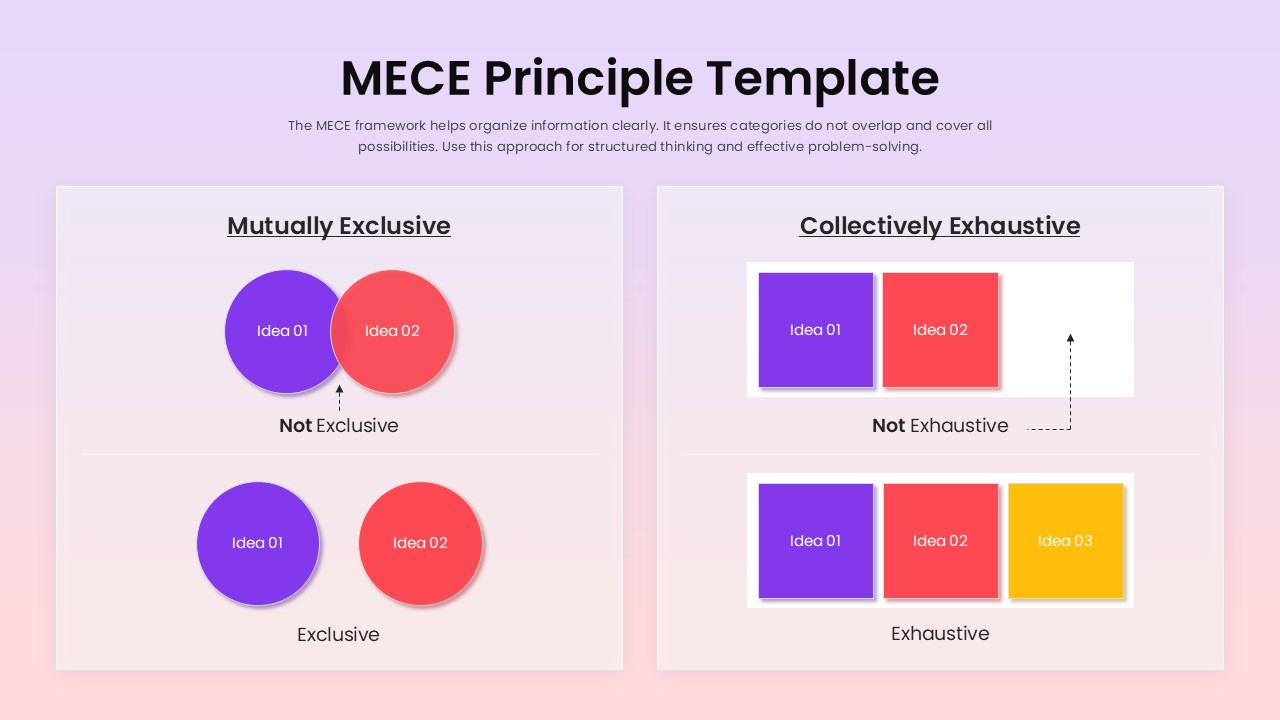
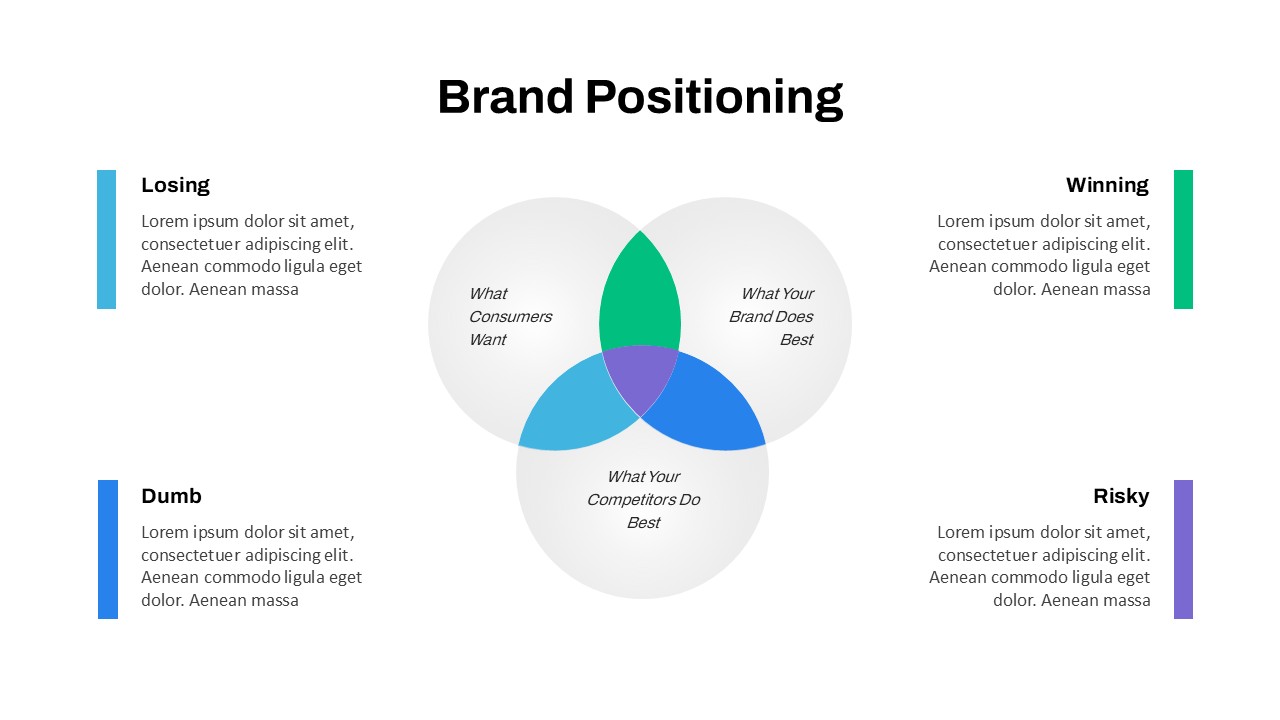
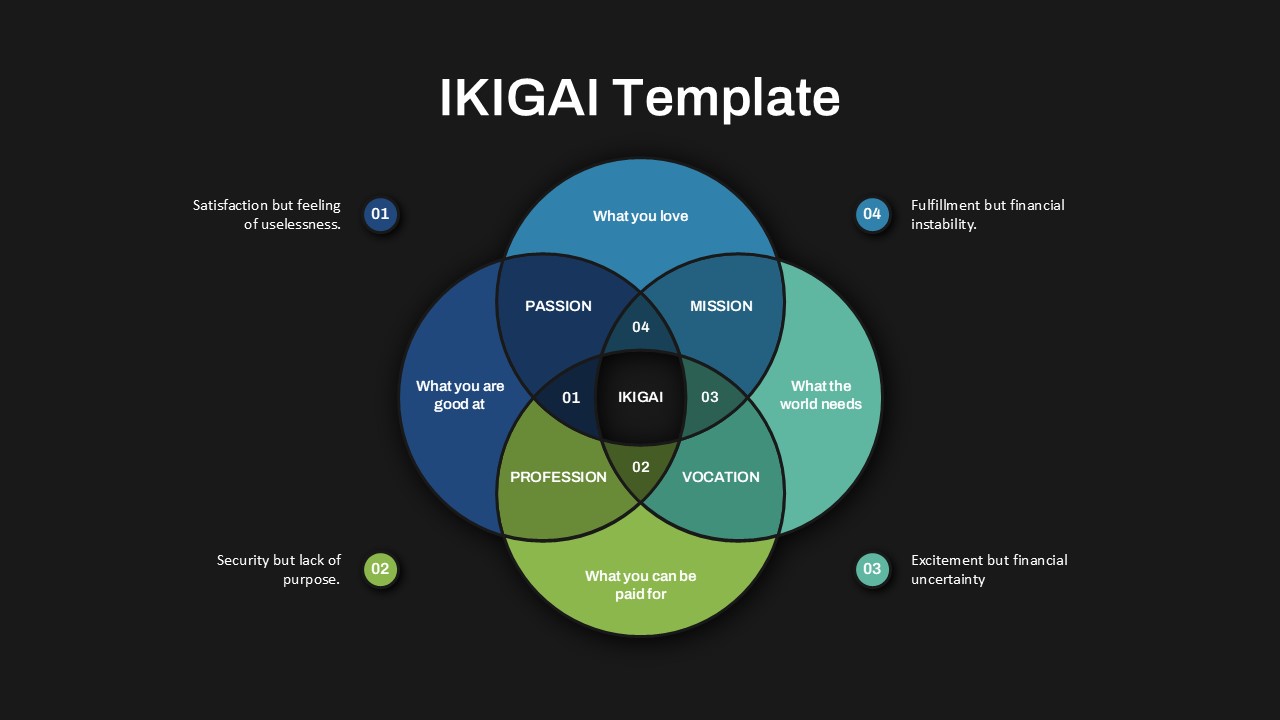
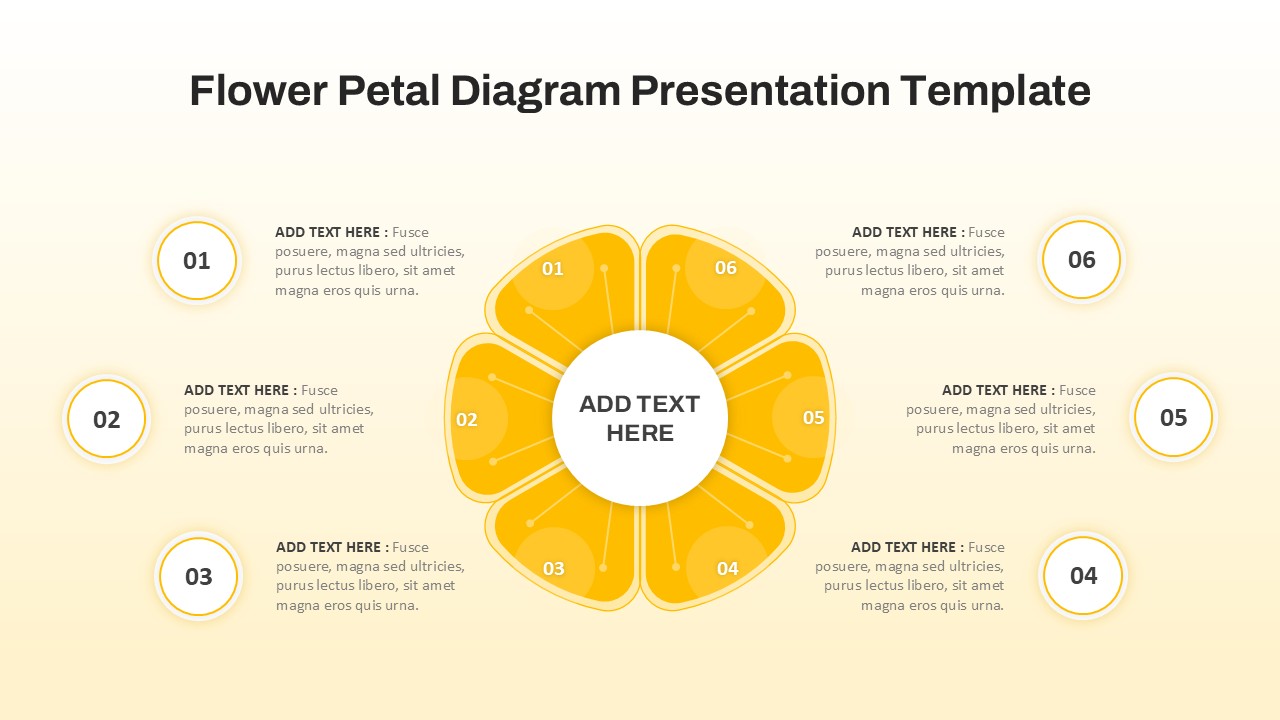
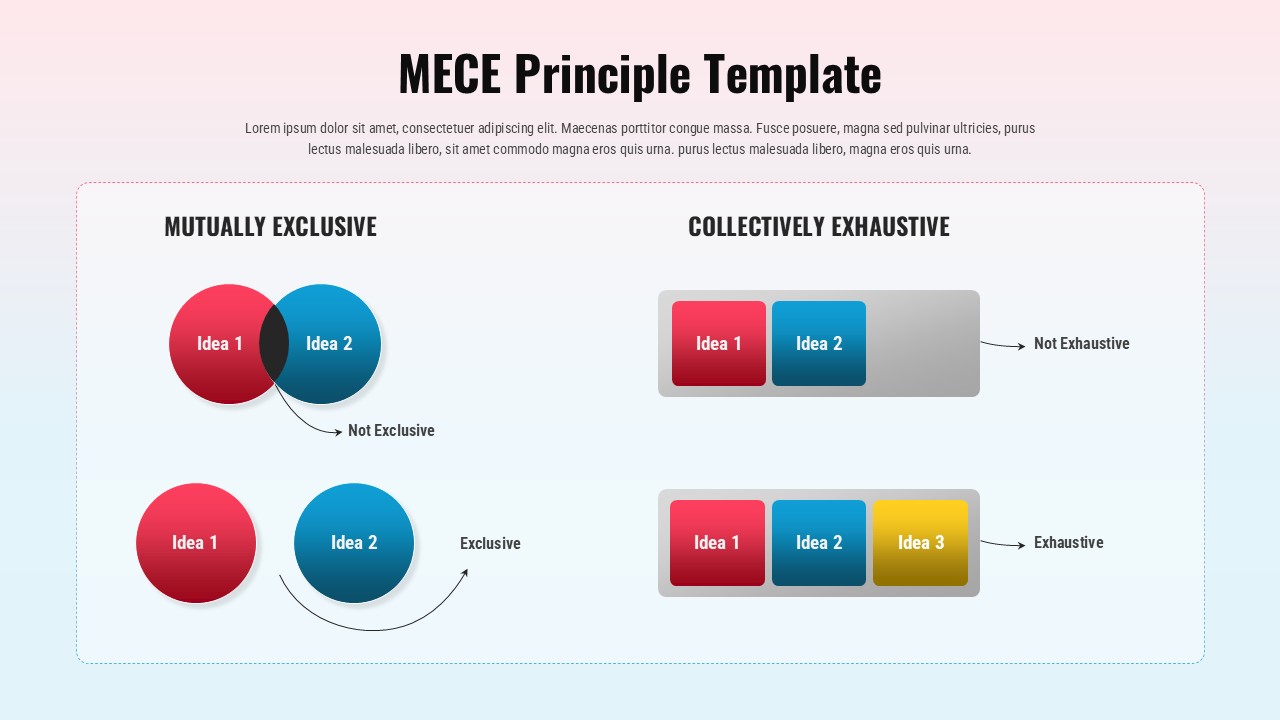
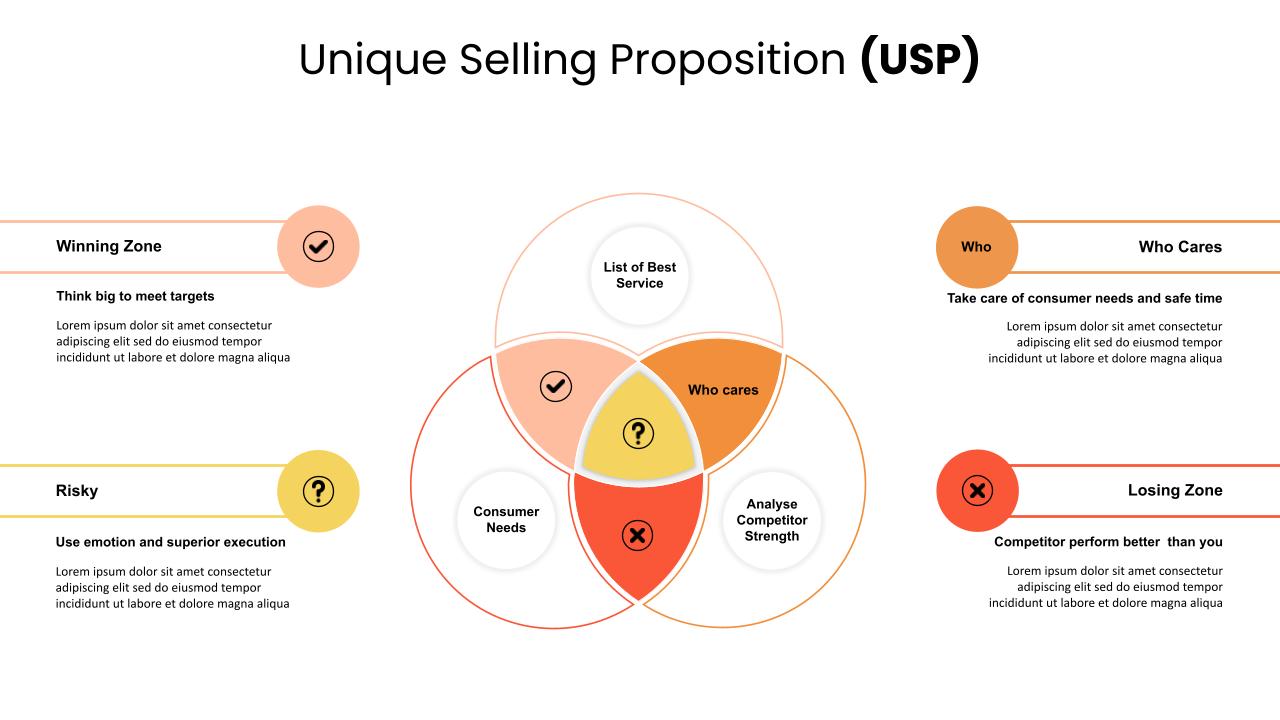
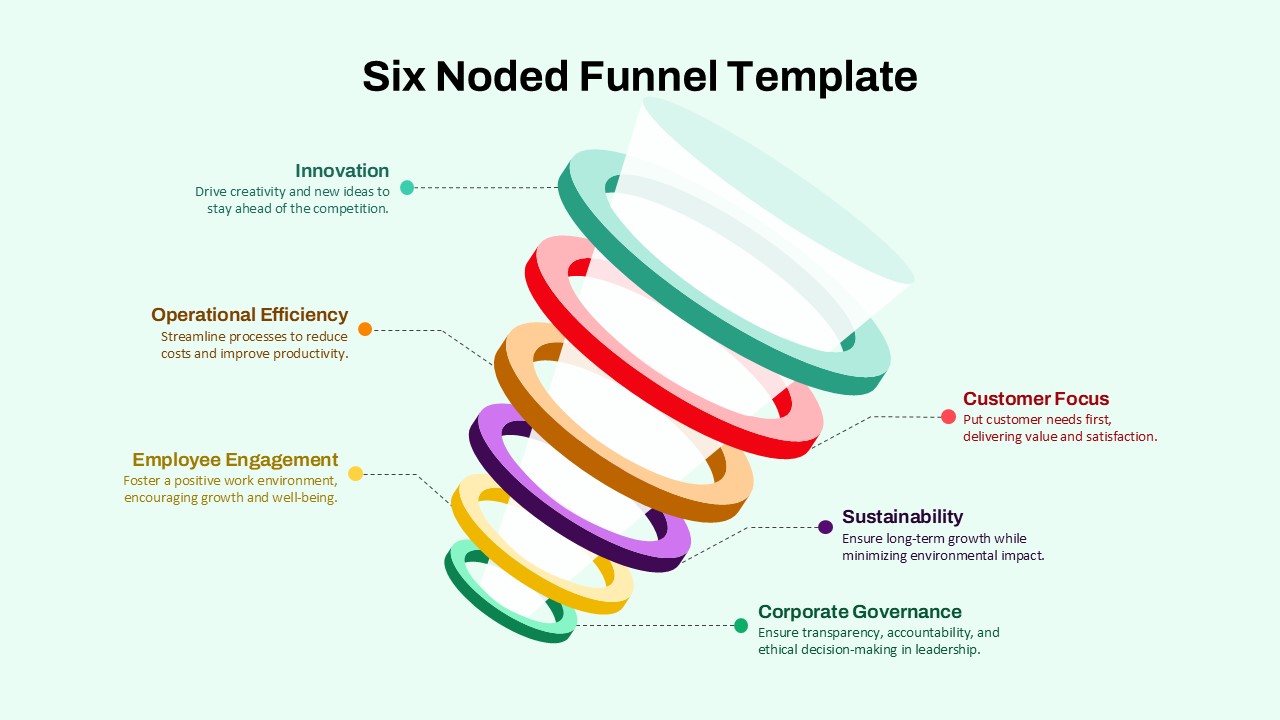
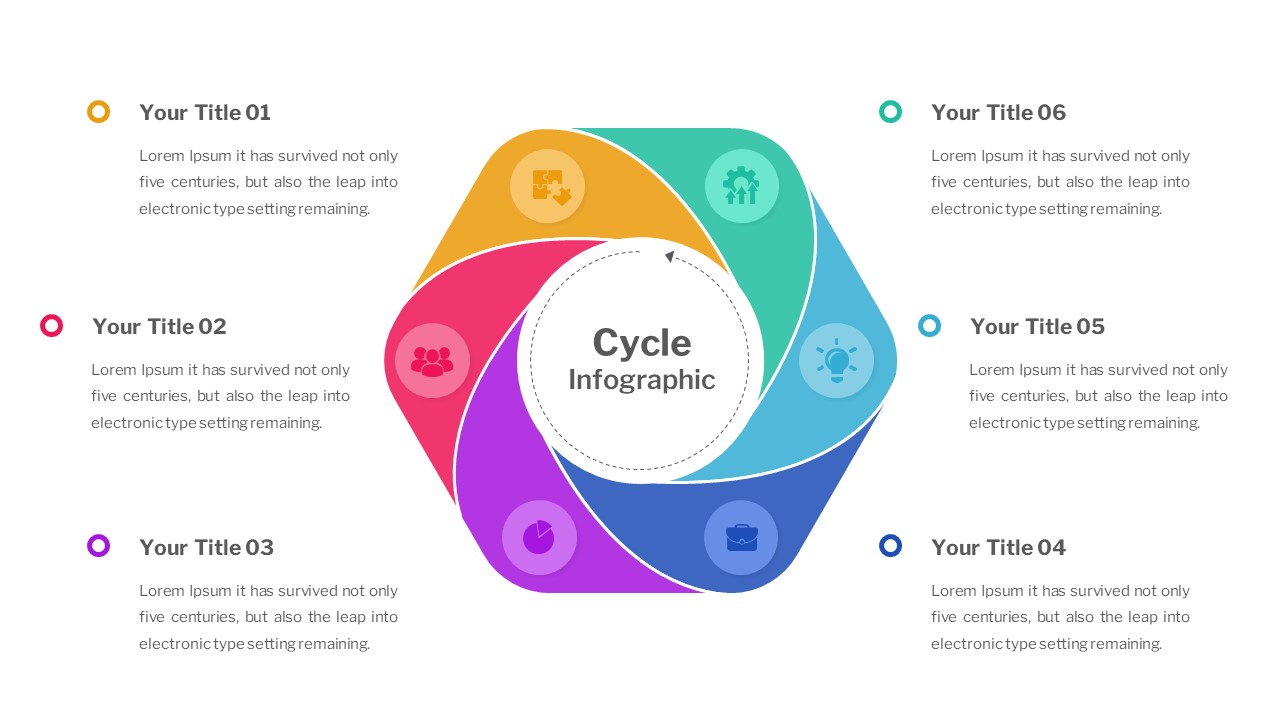
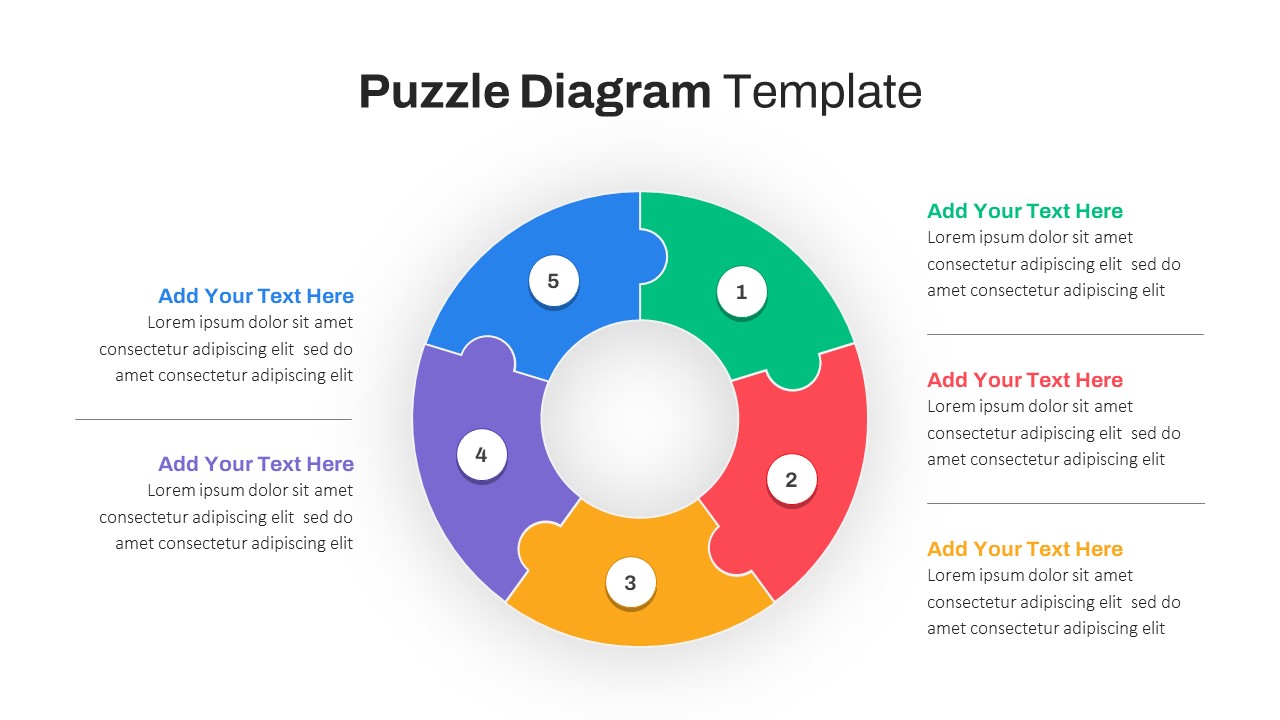
The 6-Way Venn Diagram Template is a dynamic and visually captivating presentation tool designed to illustrate complex relationships between six different data sets or categories. Featuring a multi-colored overlapping circular layout, this diagram allows presenters to explore intersections, correlations, and dependencies in a clear and engaging manner. Each section of the Venn diagram can be customized with text, icons, or numbers, enabling effortless representation of overlapping concepts across multiple dimensions.
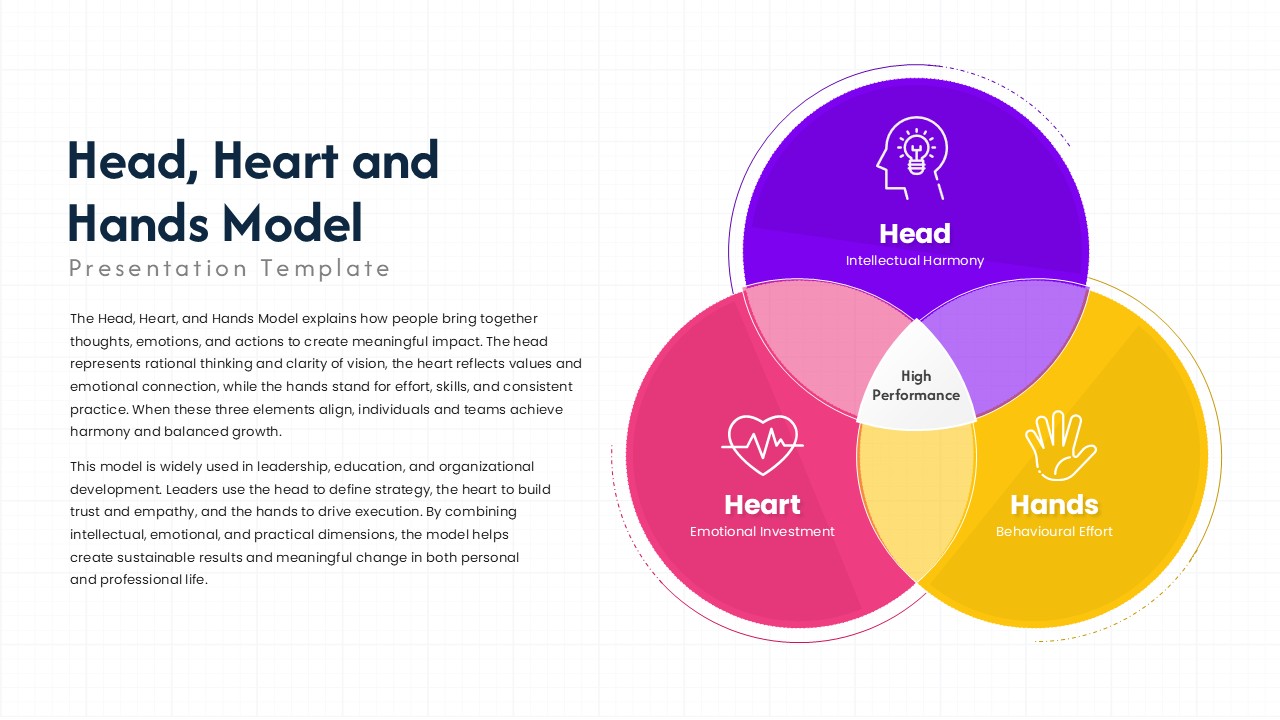
This template is ideal for professionals and educators who wish to visualize multifaceted ideas such as market segmentation, data classification, research comparisons, or organizational structures. Its gradient background and refined color contrast ensure that the information remains visually balanced and easy to interpret. The design can be adjusted to match brand colors or thematic requirements, making it suitable for both corporate and academic presentations.
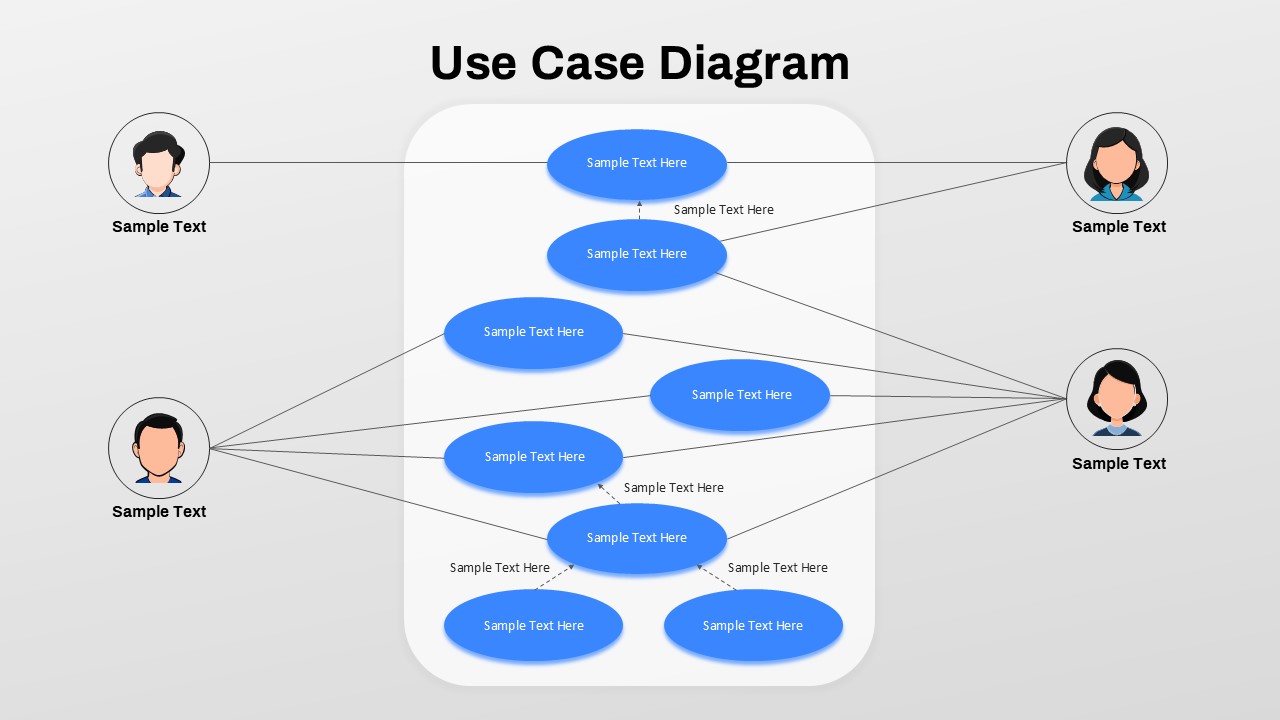
Whether you’re presenting analytical data, illustrating strategic alignments, or mapping relationships between entities, this 6-way Venn diagram ensures clarity and impact. Available for both PowerPoint and Google Slides, it’s fully editable, allowing users to adapt font styles, color palettes, and layout compositions effortlessly. The intuitive design supports storytelling through data, empowering presenters to convey insights that resonate with their audience.
See more

Aspect Ratio
16:9Item ID
SKT04393
Features of this template
Other User Cases of the Template:
Market segmentation analysis, business strategy visualization, academic research presentation, data relationship mapping, competitive analysis, organizational structure mapping, process comparison, team collaboration analysis, cross-functional project planning, concept overlap illustration.FAQs
You May Also Like These Presentation Templates


- Free
- Free


- Free

- Free
- Free
- Free