Progress Bar Google Slides
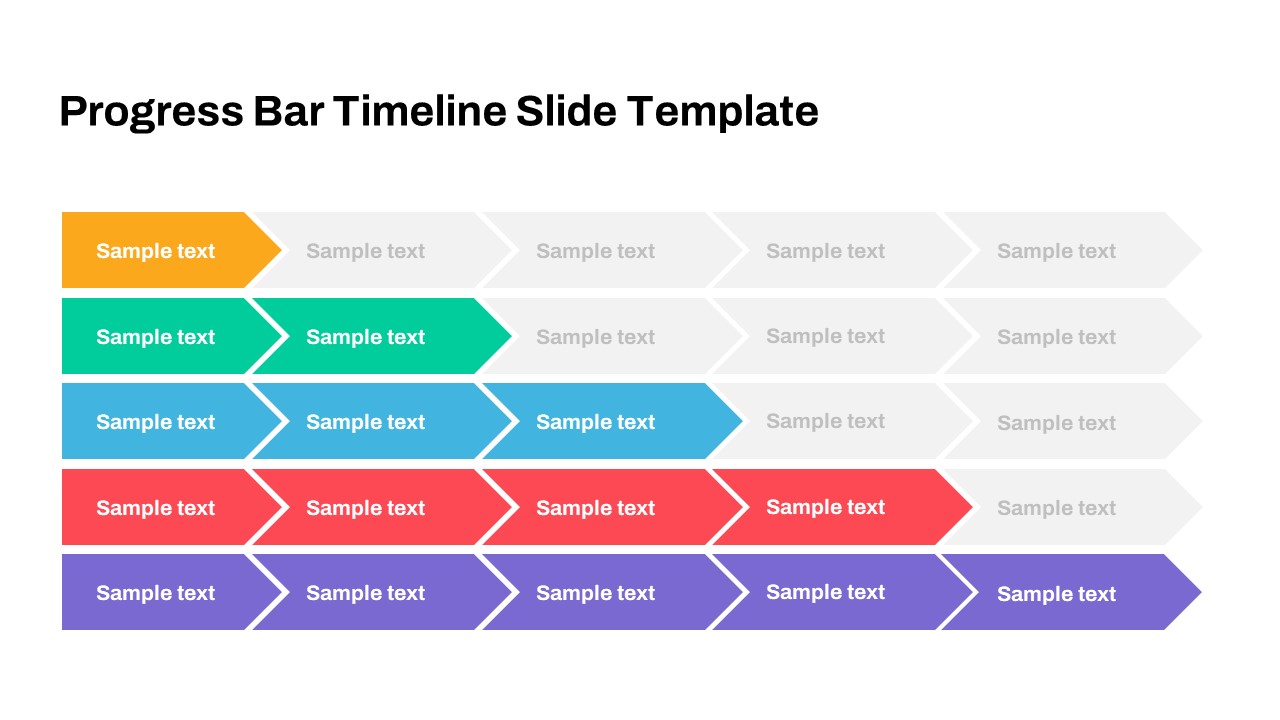


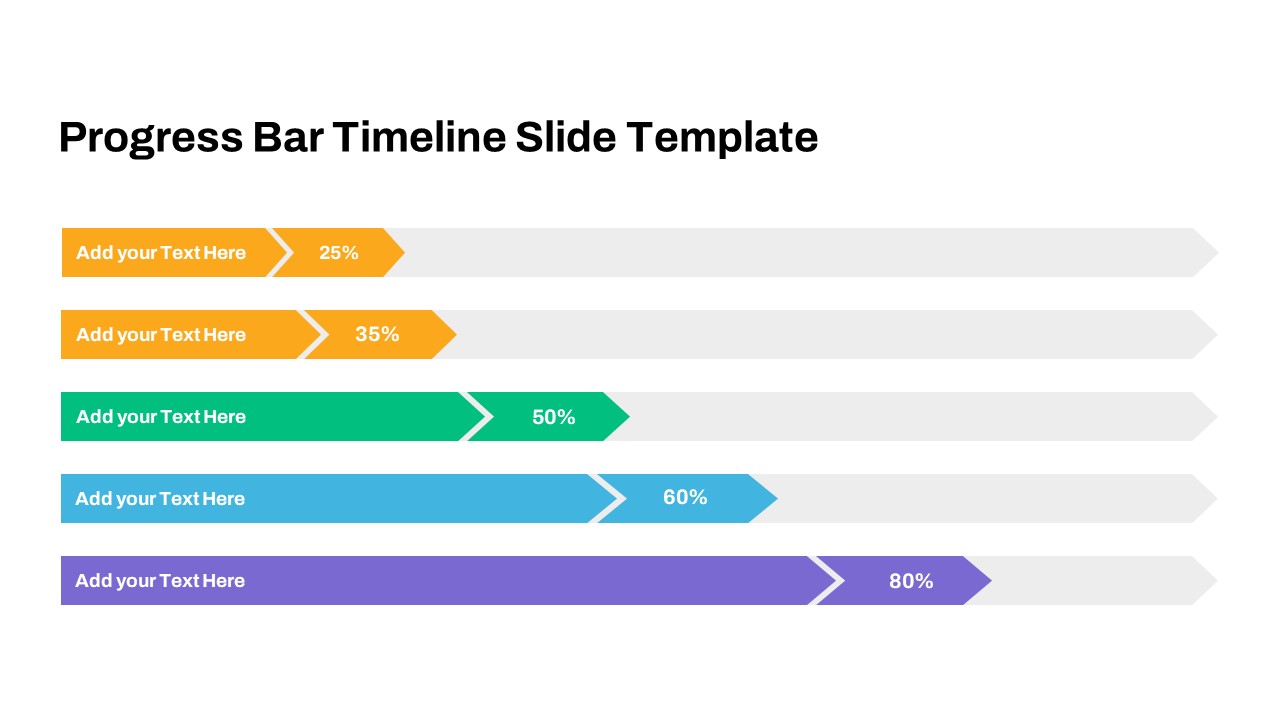
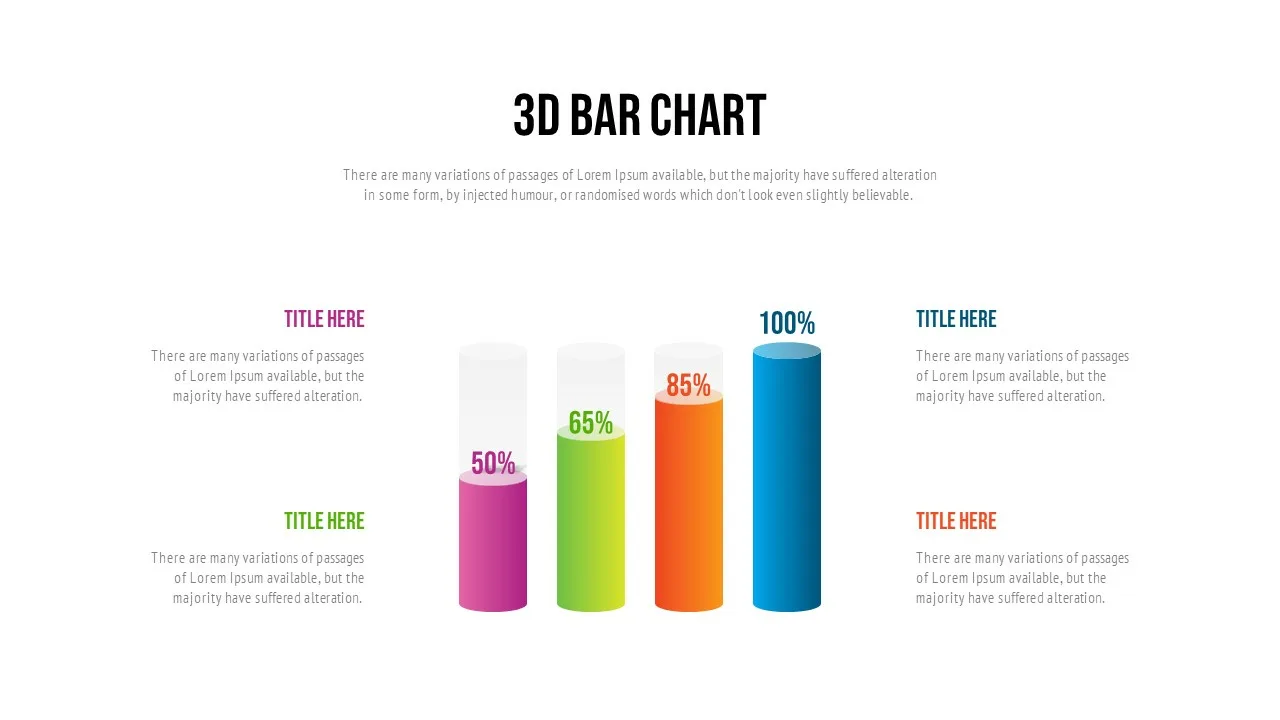
Use our progress chart designed for Google Slides that goes beyond the ordinary data presentation. This progress bar Google Slides not only showcases data but also smoothly transforms information into an effortlessly digestible format. The length of each bar becomes a tangible indicator, offering a visual snapshot of the overall progress of your projects. Whether you’re in a boardroom with stakeholders, collaborating with team members, or delivering a presentation to clients, this visually impactful aid significantly enhances comprehension and engagement. Improve your communication strategy by incorporating this simple data presentation chart to ensure your audience effortlessly gains valuable insights and remains captivated throughout the entirety of your presentation.
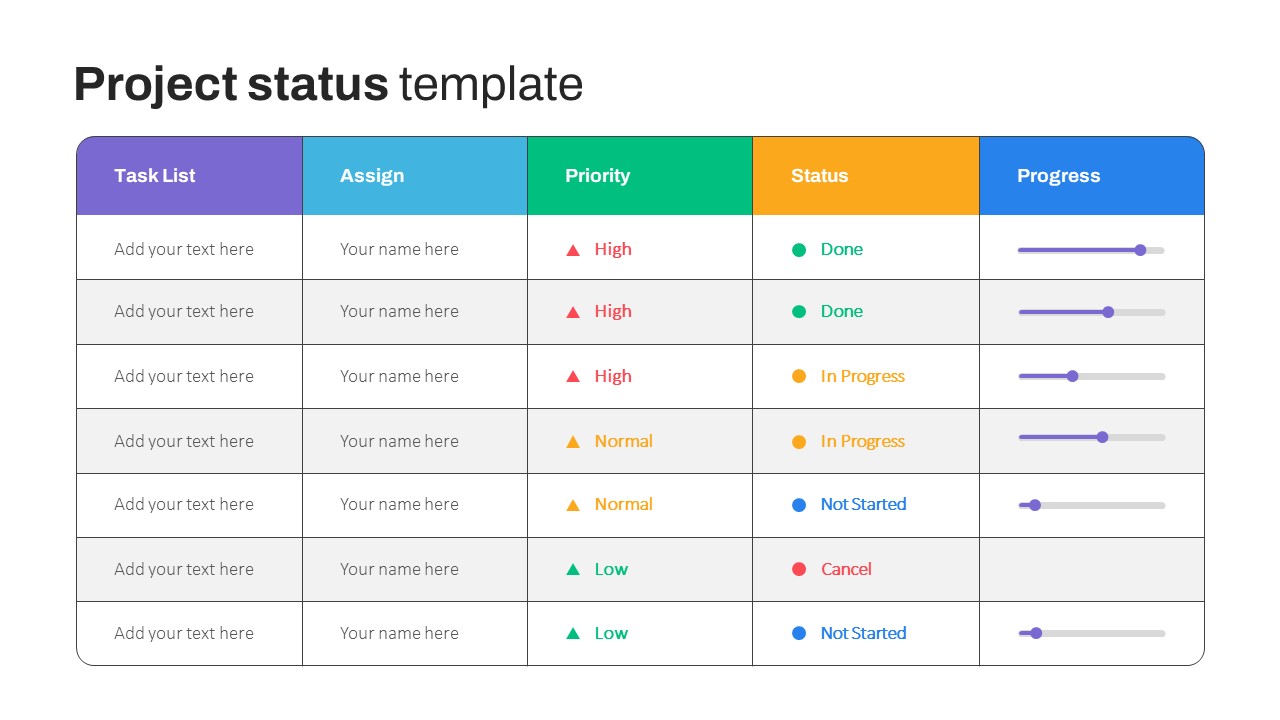
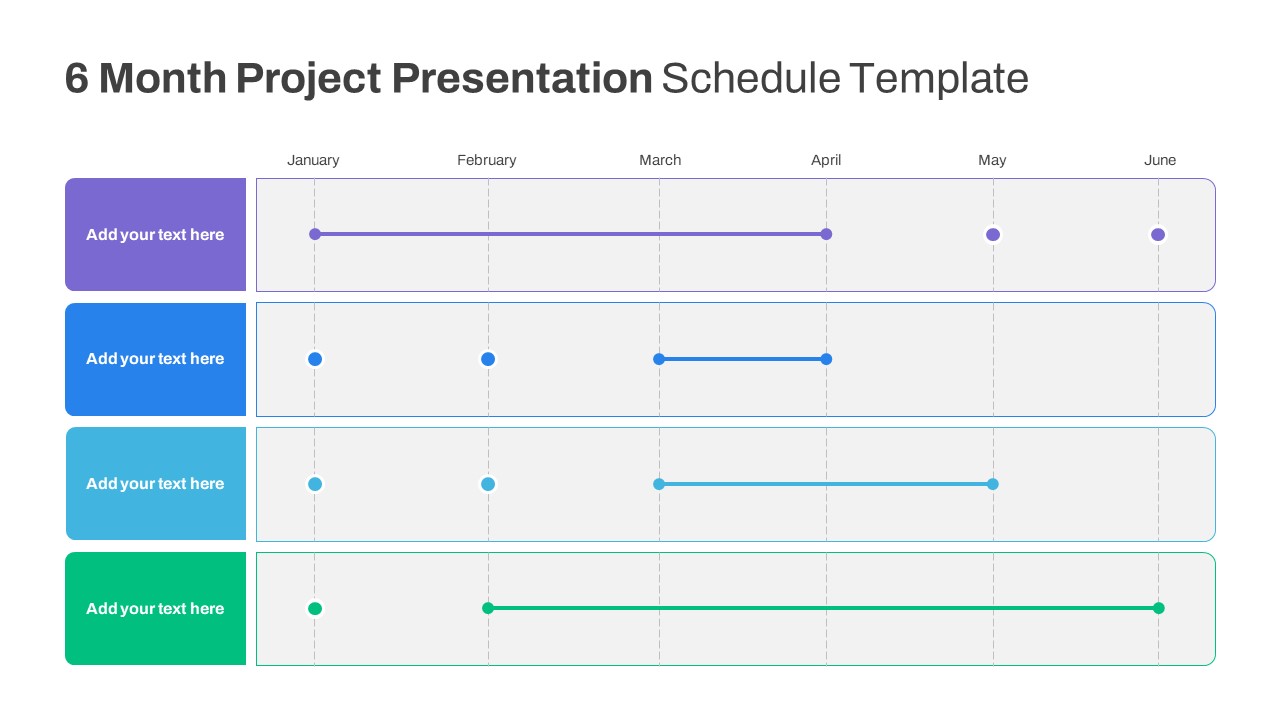
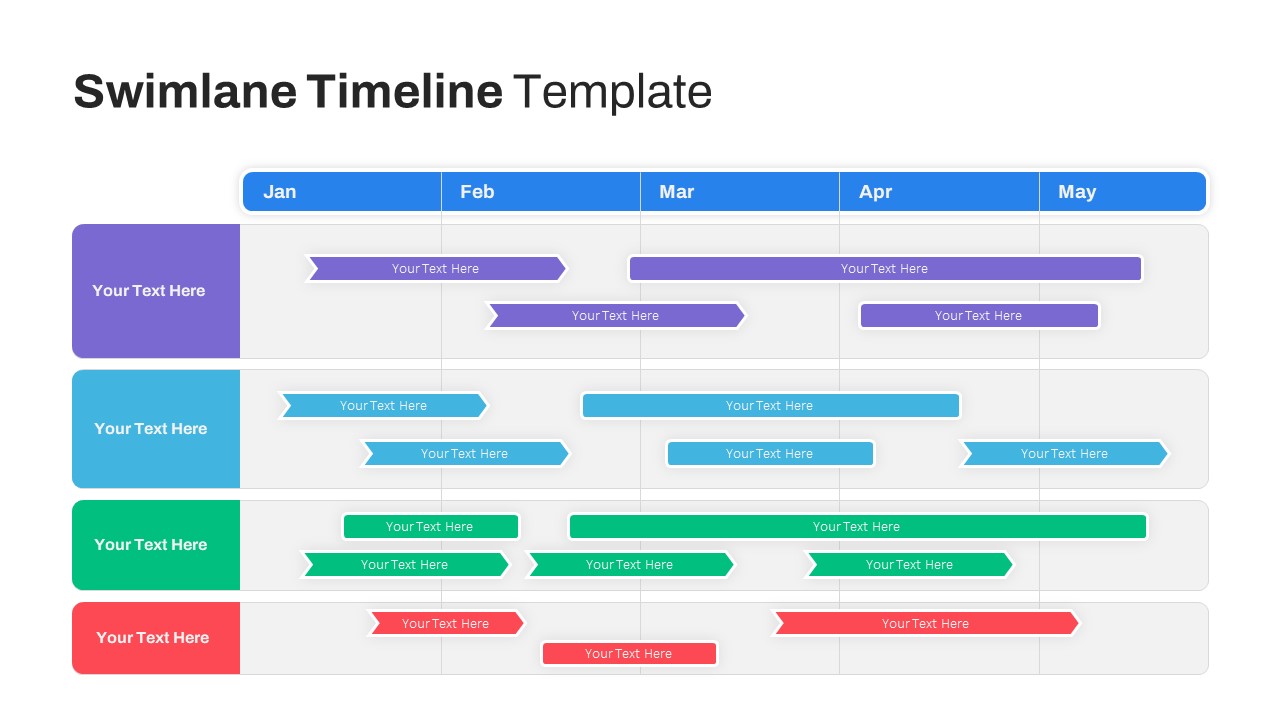
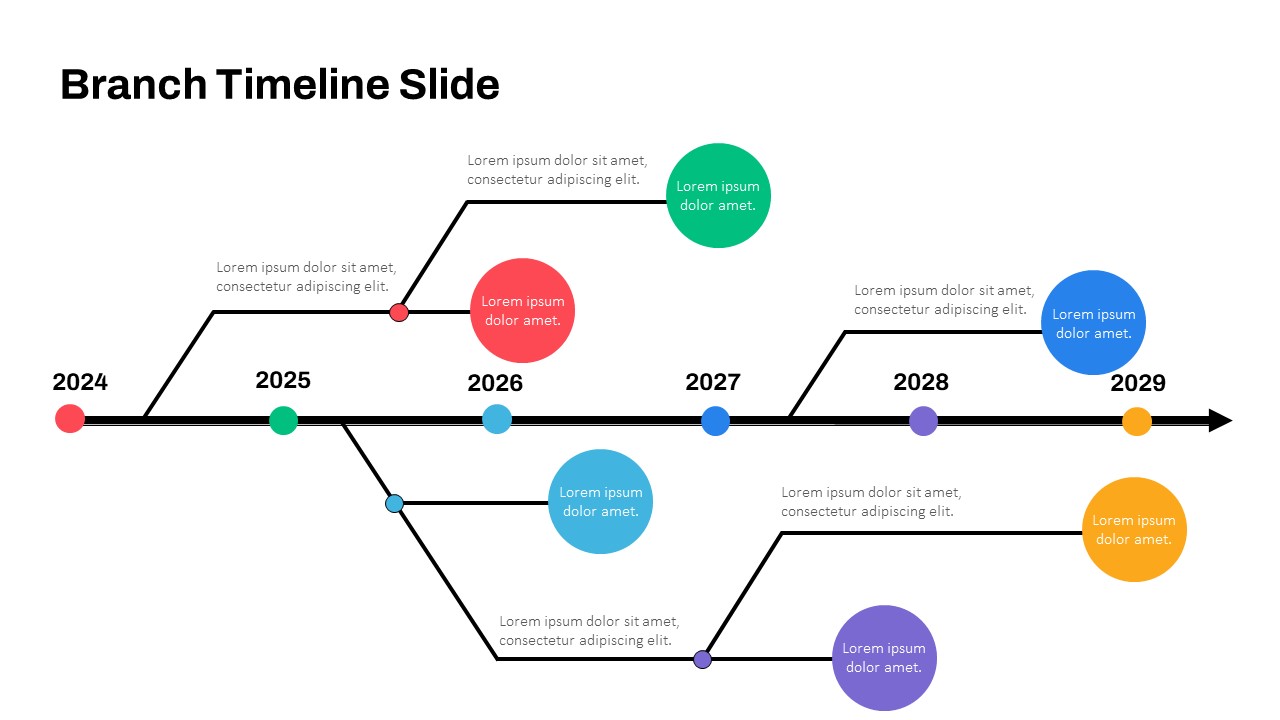
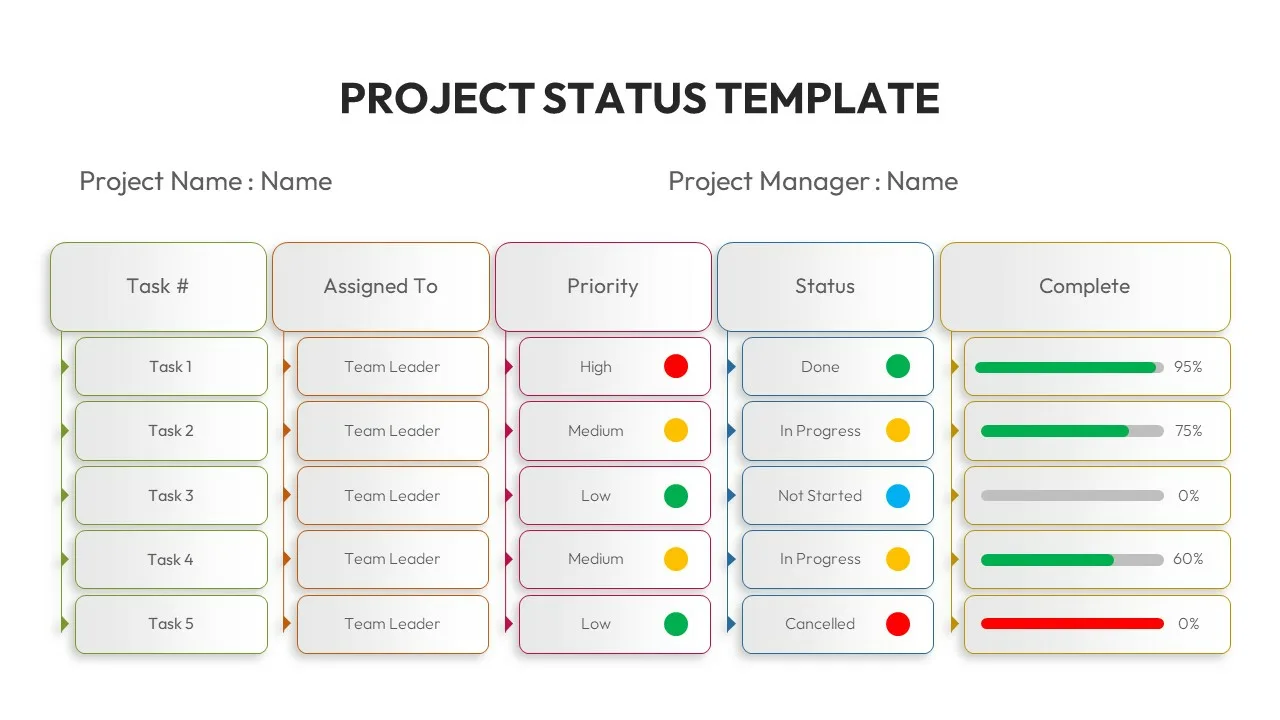
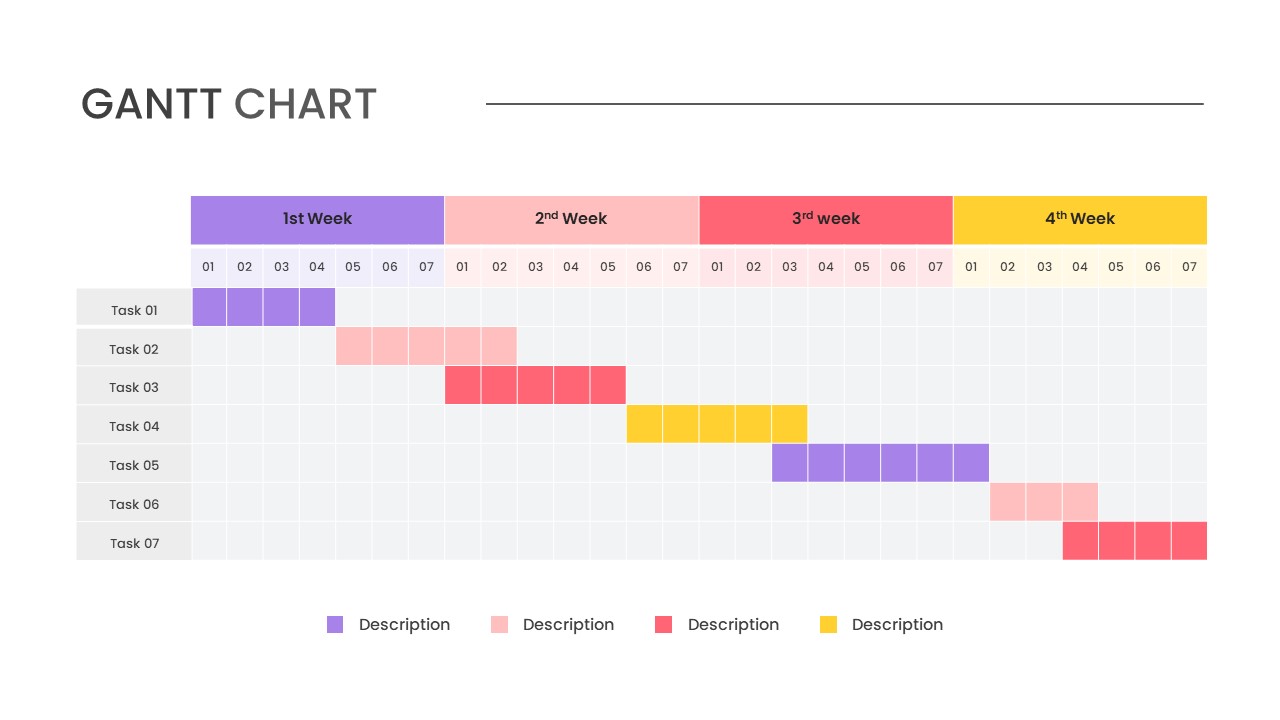
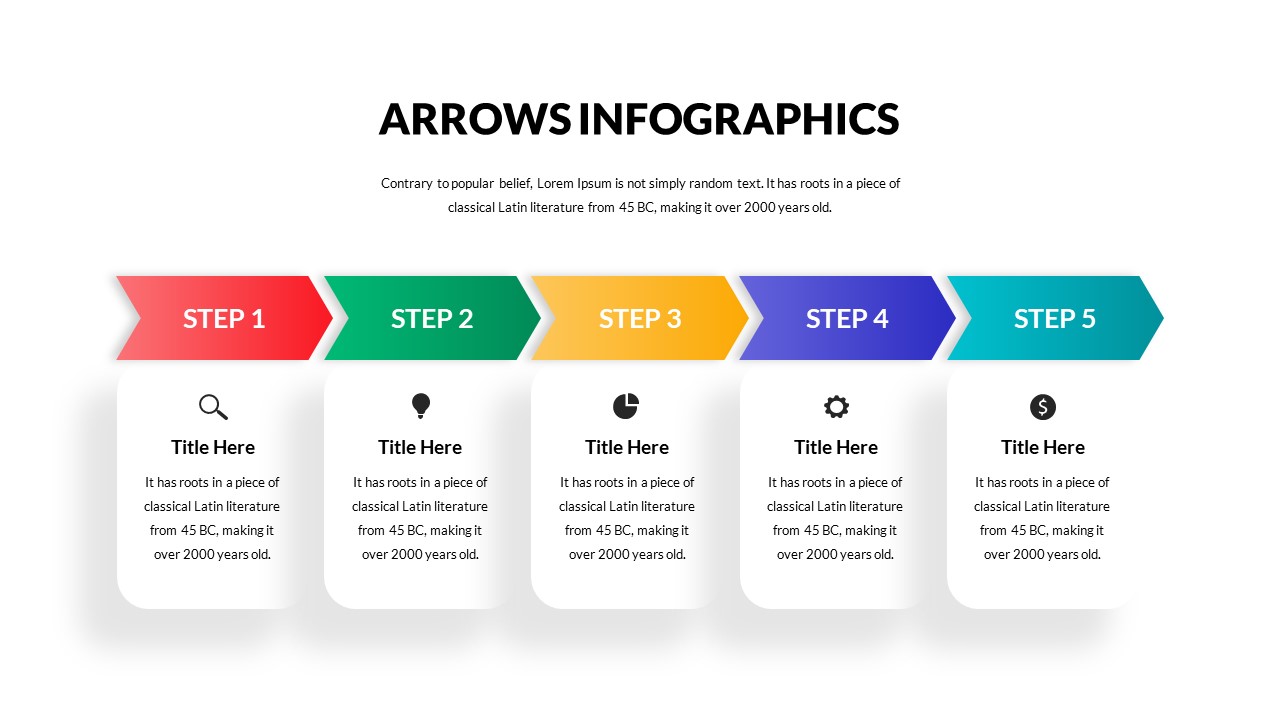
This Google Slide Progress Bar is alternatively for data visualization to showcase the developmental phases and progress. It is the best solution for tracking milestones and performance metrics with the four-column arrow bars. Each arrow design will show the developments in an easily comprehensible layout. The presenters can show the percentages of completed tasks if they put a value to each section. It provides instant feedback and a summarized overview of the entire process.
Google Slide progress chart can be used to illustrate project management, data analytics, software development, and graphic design. Besides, SEOs can use it to display a traffic overview of each page with percentages. It comes in one variant design with two background choices. This horizontal bar char model in four rows enables the users to modify color, size, and columns. So, download progress bar chart for Google Slides for an engaging presentation. Try it now to display simple statistics.
See more

Aspect Ratio
16:9Item ID
SKT00814
FAQs
You May Also Like These Presentation Templates
- Free
- Free
- Free
- Free
- Free