Bear vs Bull Market Comparison Slide for PowerPoint & Google Slides
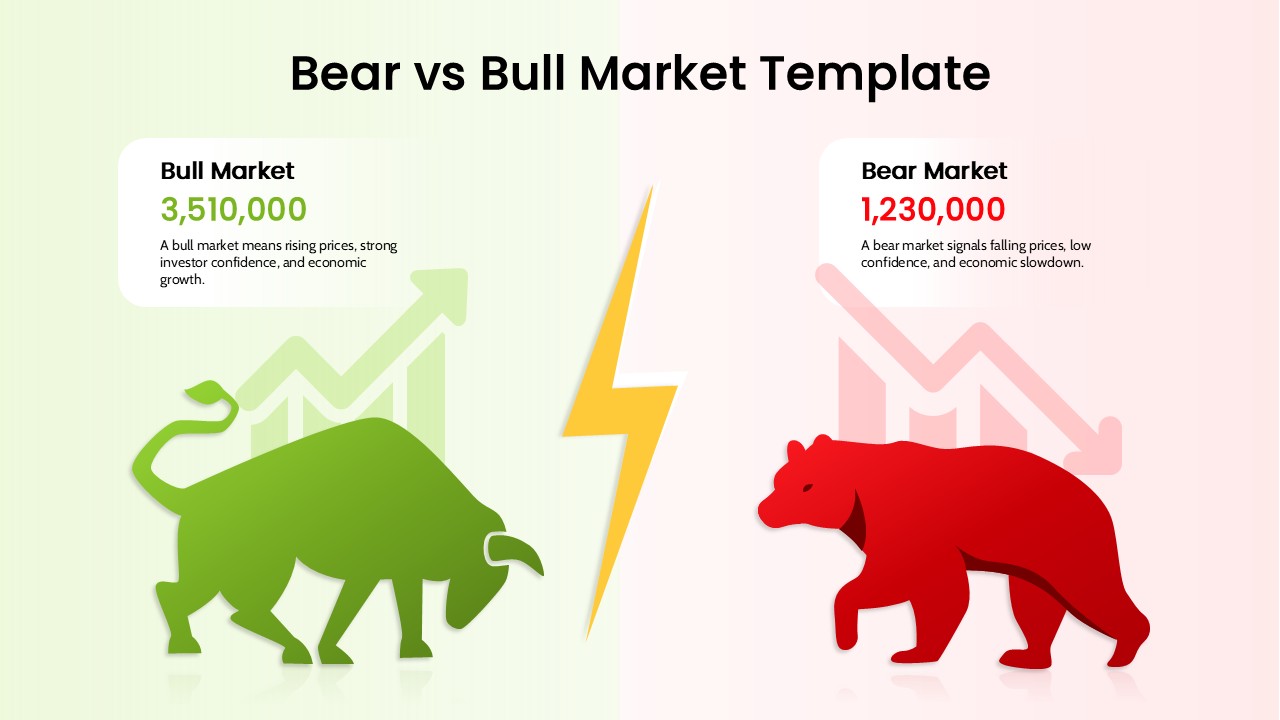
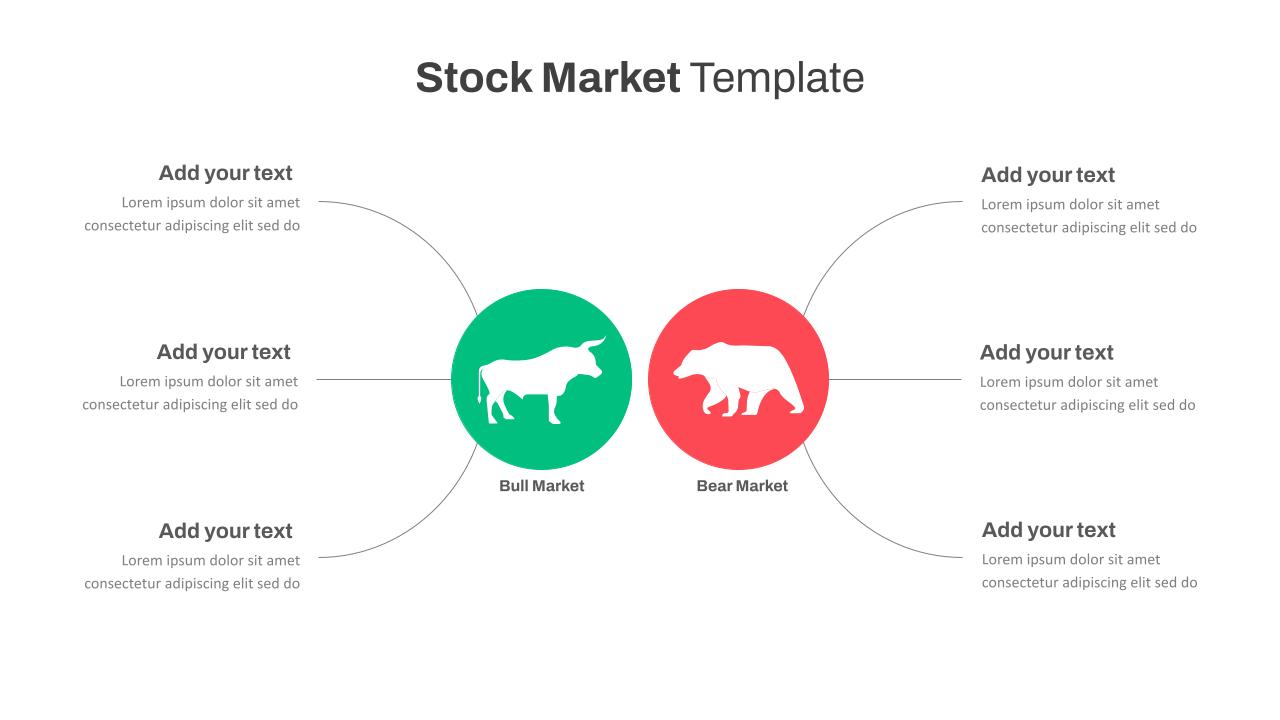
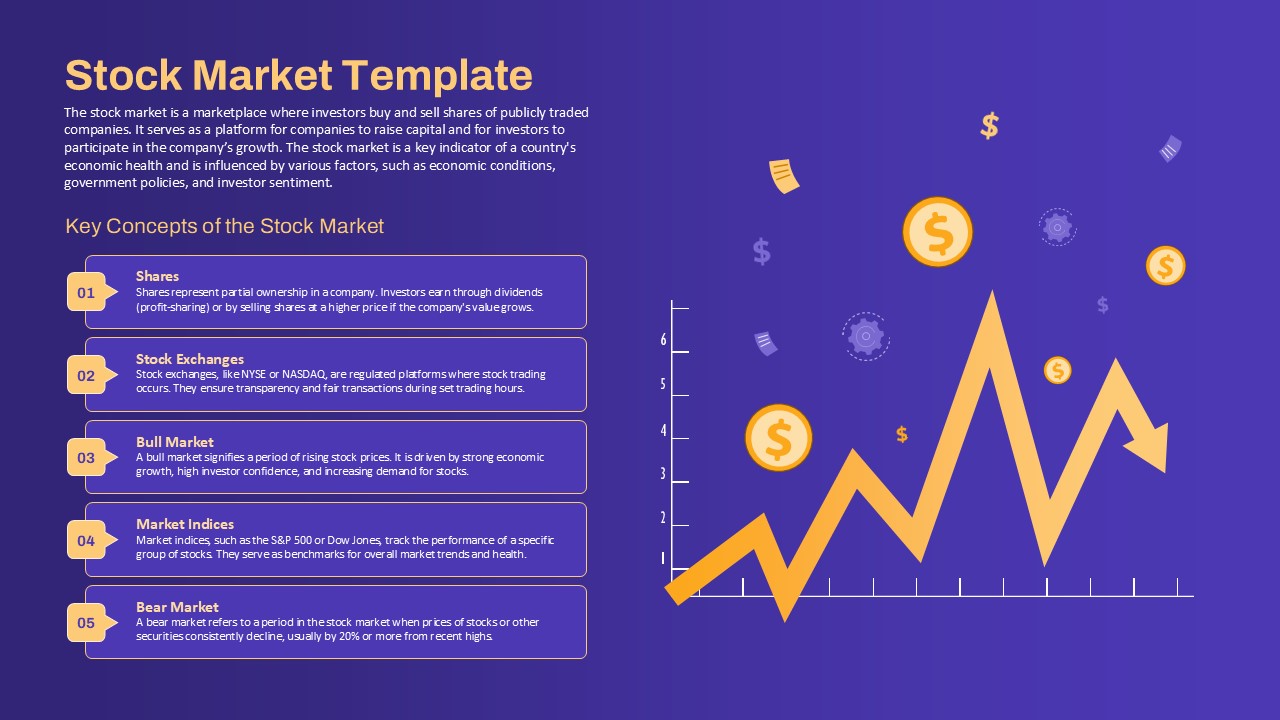
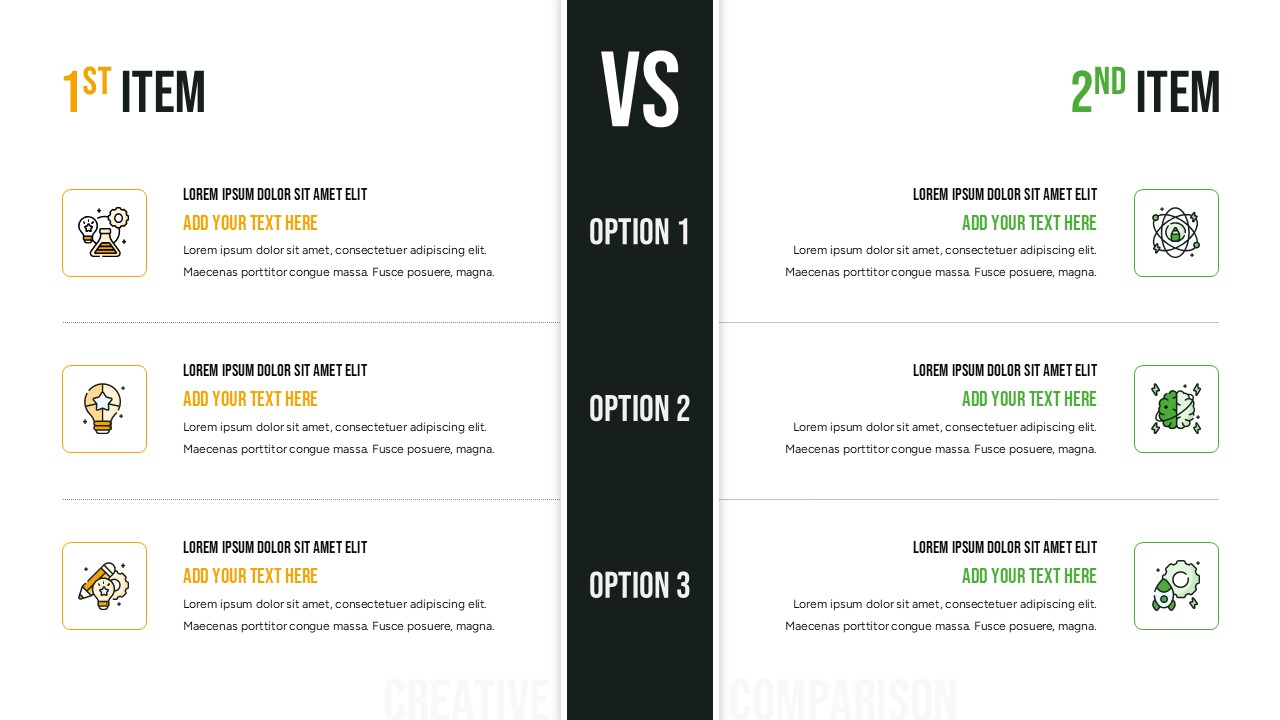
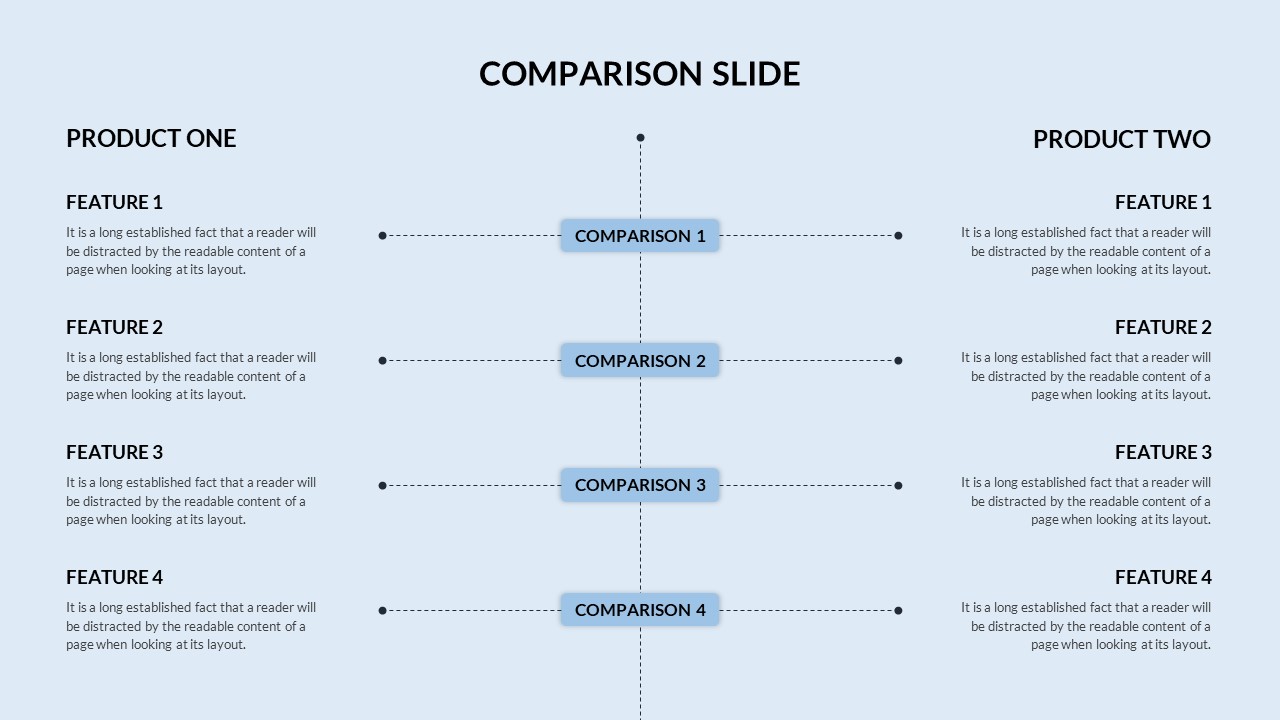
This Bear vs Bull Market slide offers a compelling side-by-side comparison of two dominant financial market conditions—making it ideal for economics lectures, investor briefings, or financial literacy sessions. The design splits the slide into two halves: the left in vibrant green, symbolizing the bullish market optimism; the right in bold red, representing the bearish market pessimism. Large vector icons of a bull and a bear are placed beneath upward and downward trend charts, visually reinforcing the economic direction and investor sentiment of each market type.
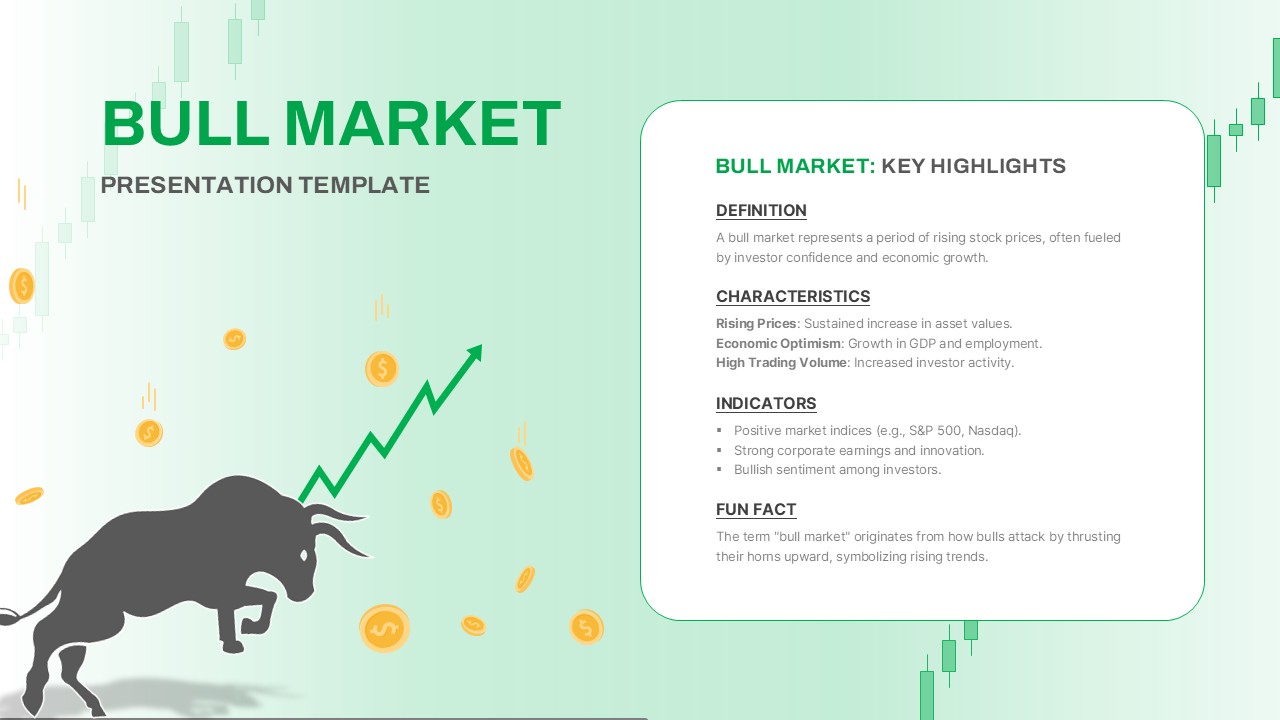
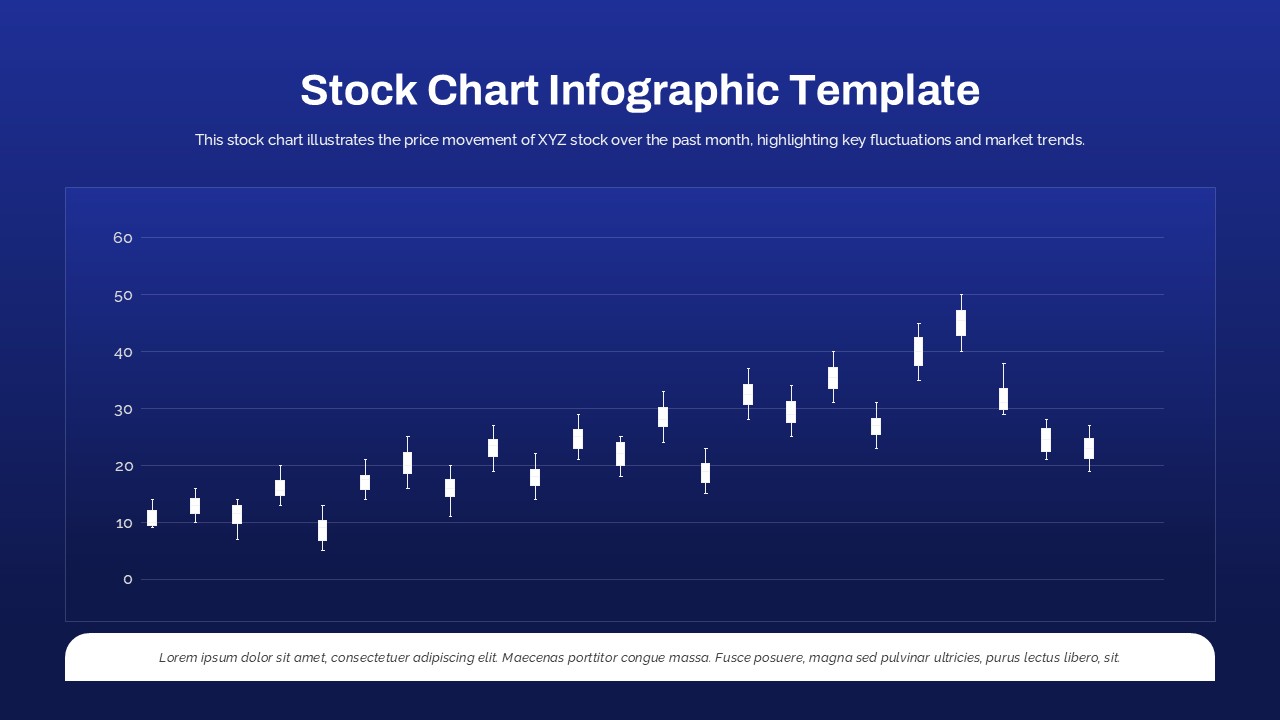
Each section includes a bold statistic and a concise definition. The bull market side highlights rising prices, economic growth, and investor confidence, while the bear market side illustrates falling prices, decreased confidence, and economic downturn. A dynamic lightning bolt at the center signifies the contrast and volatility between the two conditions, adding a visually impactful focal point.
Optimized for both PowerPoint and Google Slides, this layout is entirely editable—swap icons, change text, or adapt color schemes to fit your theme. With clear labeling and minimal text blocks, the slide is ideal for engaging business presentations, market analysis discussions, or client education materials in investment firms.
See more

Aspect Ratio
16:9Item ID
SKT04142
Features of this template
Other Uses
Use this slide to introduce investor behavior models, support financial forecasting reports, explain market trends in annual meetings, or integrate into fintech startup pitch decks.
FAQs
You May Also Like These Presentation Templates


- Free

- Free
- Free
- Free
- Free
- Free