Demand-Supply Curve PowerPoint Template
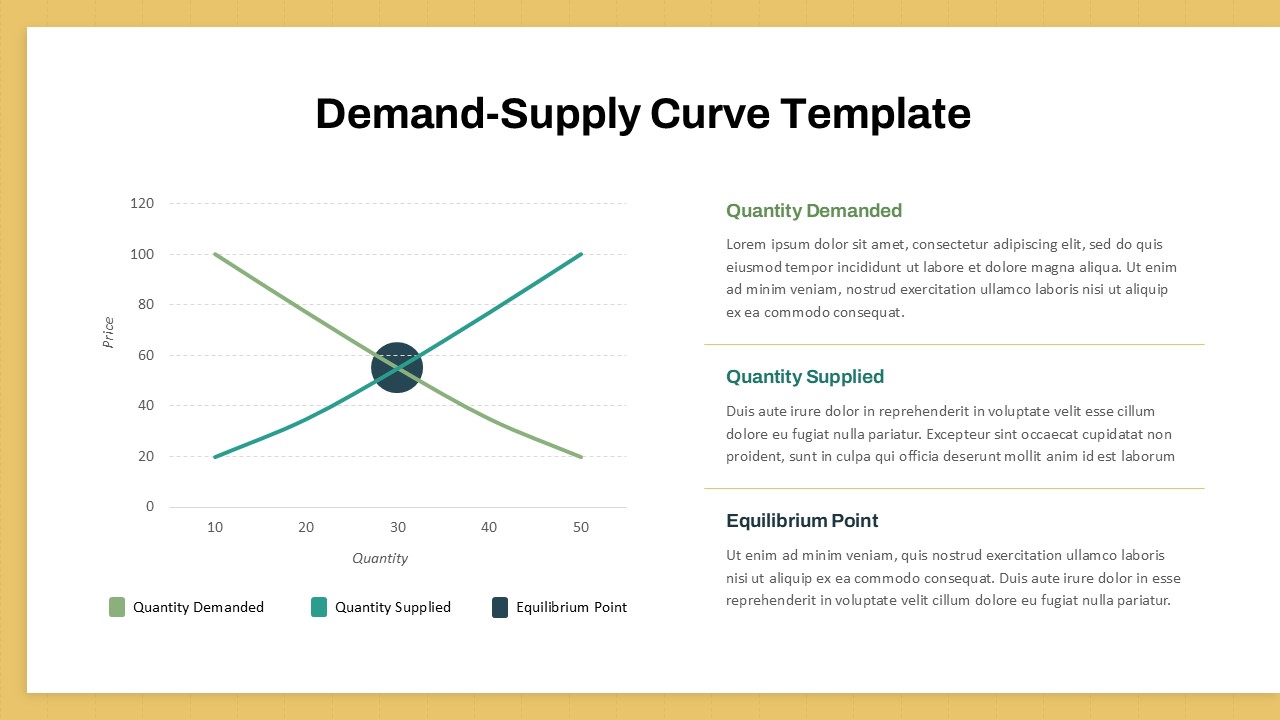
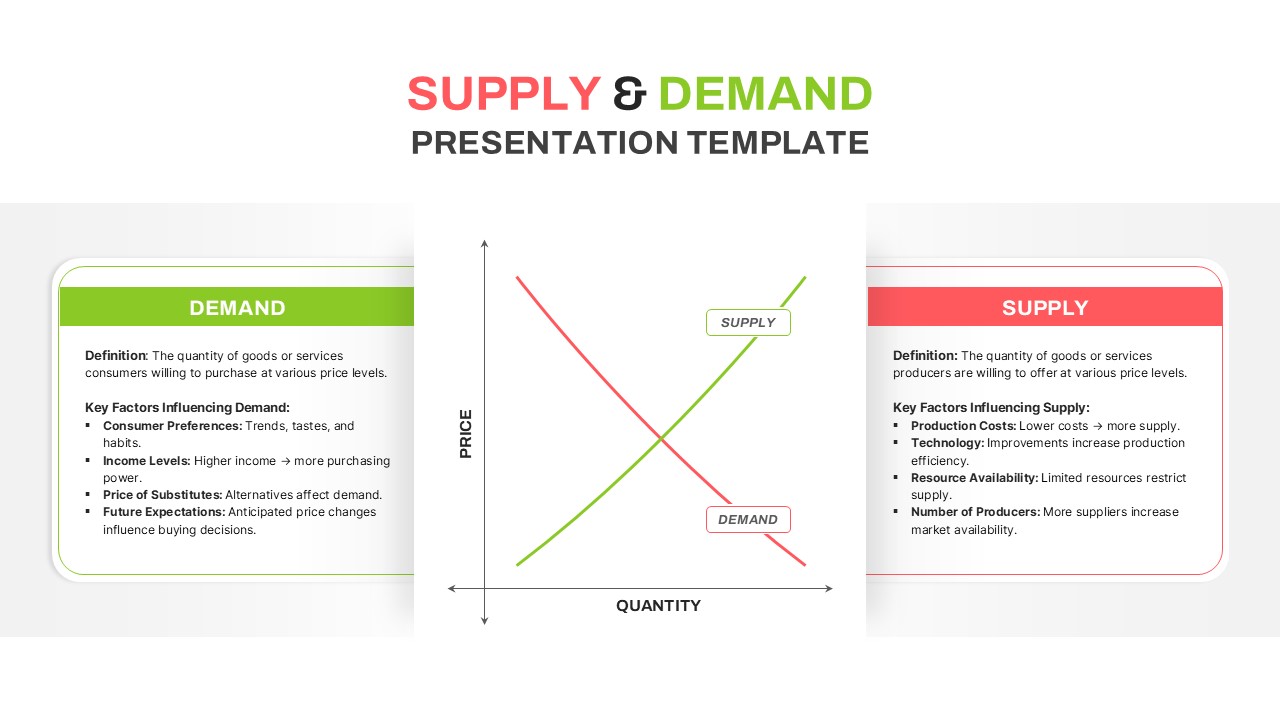
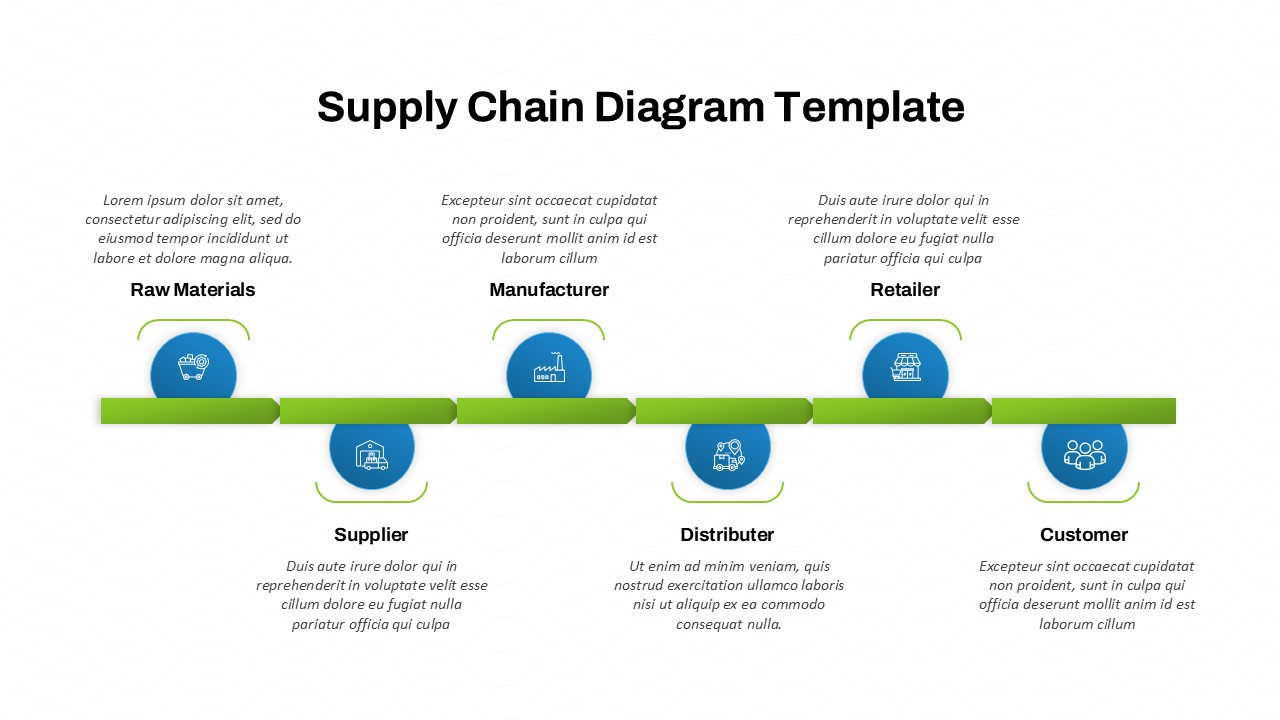
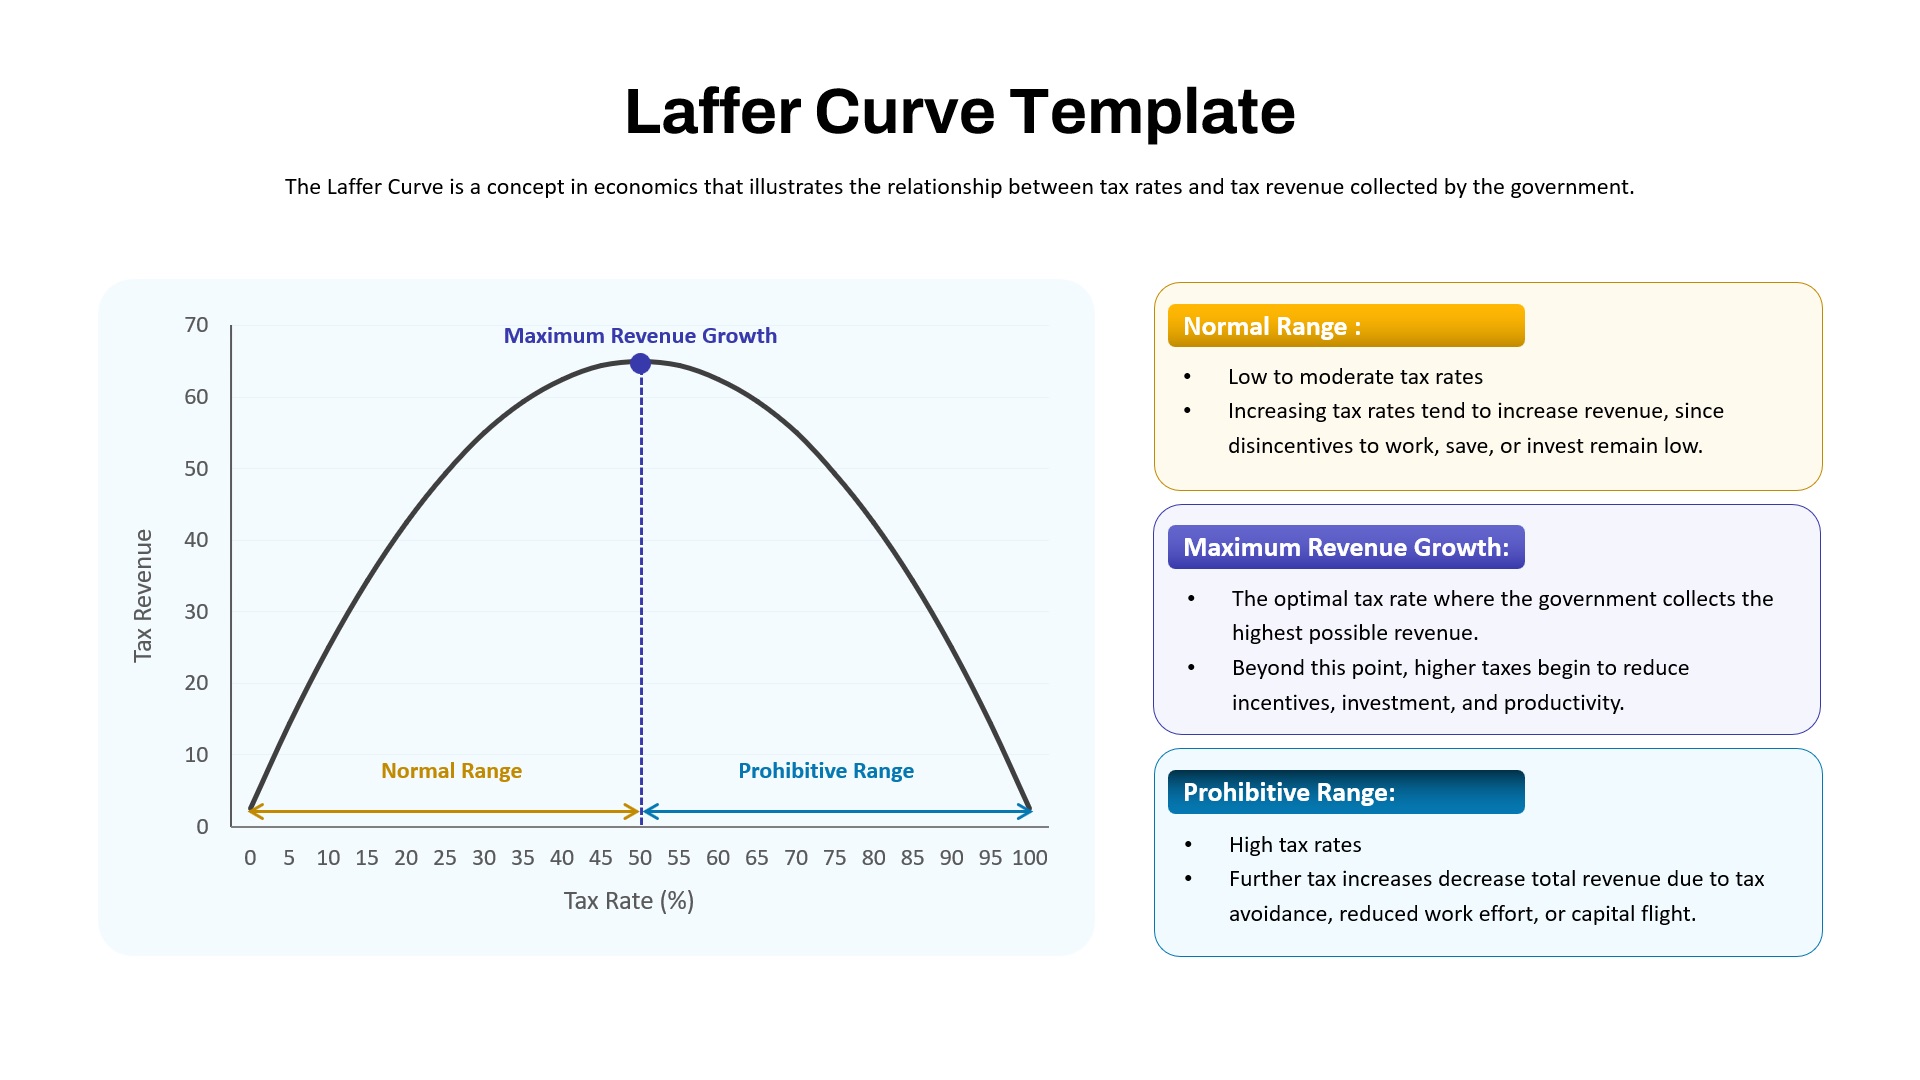
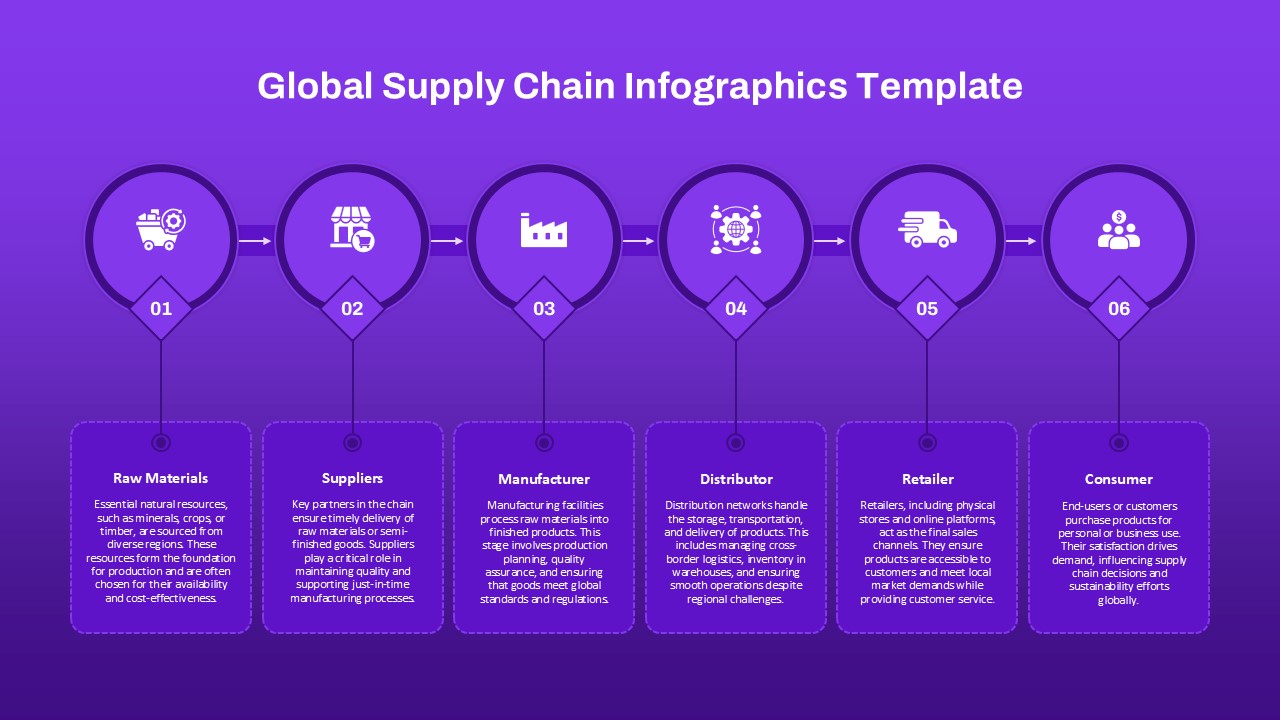
The Demand-Supply Curve Presentation Template provides a clear and effective visual tool to explain fundamental economic concepts such as quantity demanded, quantity supplied, and the equilibrium point. Featuring a well-organized graph that plots demand and supply curves with an emphasized equilibrium intersection, this demand-supply curve PowerPoint template allows users to illustrate how market forces interact to determine prices and quantities.
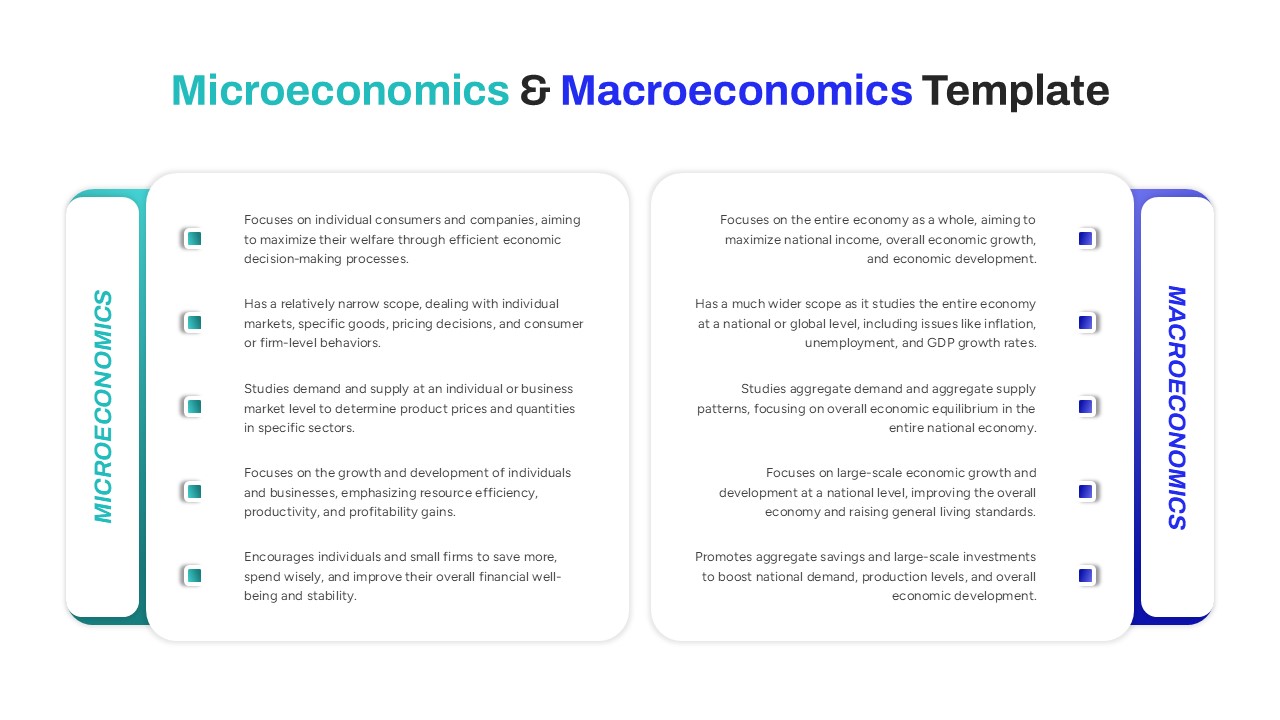
Designed for educators, students, economists, and business professionals, the template includes dedicated sections alongside the graph for detailed explanations of key terms, helping the audience grasp the mechanics behind market equilibrium. The clean, minimalistic design uses soft colors for the curves and highlights, maintaining focus on the data without distractions.
This template is fully customizable and compatible with both PowerPoint and Google Slides, ensuring easy adaptation to various presentation styles and content needs. Whether used in classroom lectures, market analysis, business strategy meetings, or economic research presentations, this template delivers a professional and accessible way to communicate complex economic relationships effectively.
See more

Aspect Ratio
16:9Item ID
SKT03615
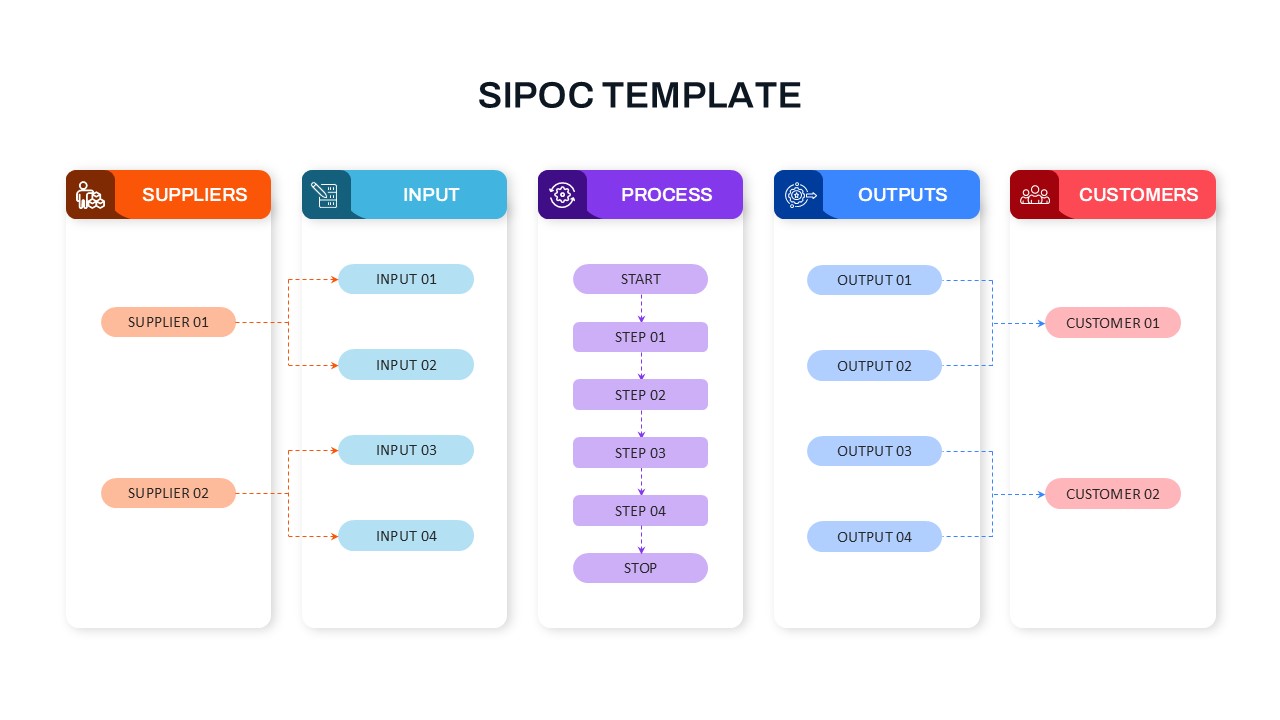
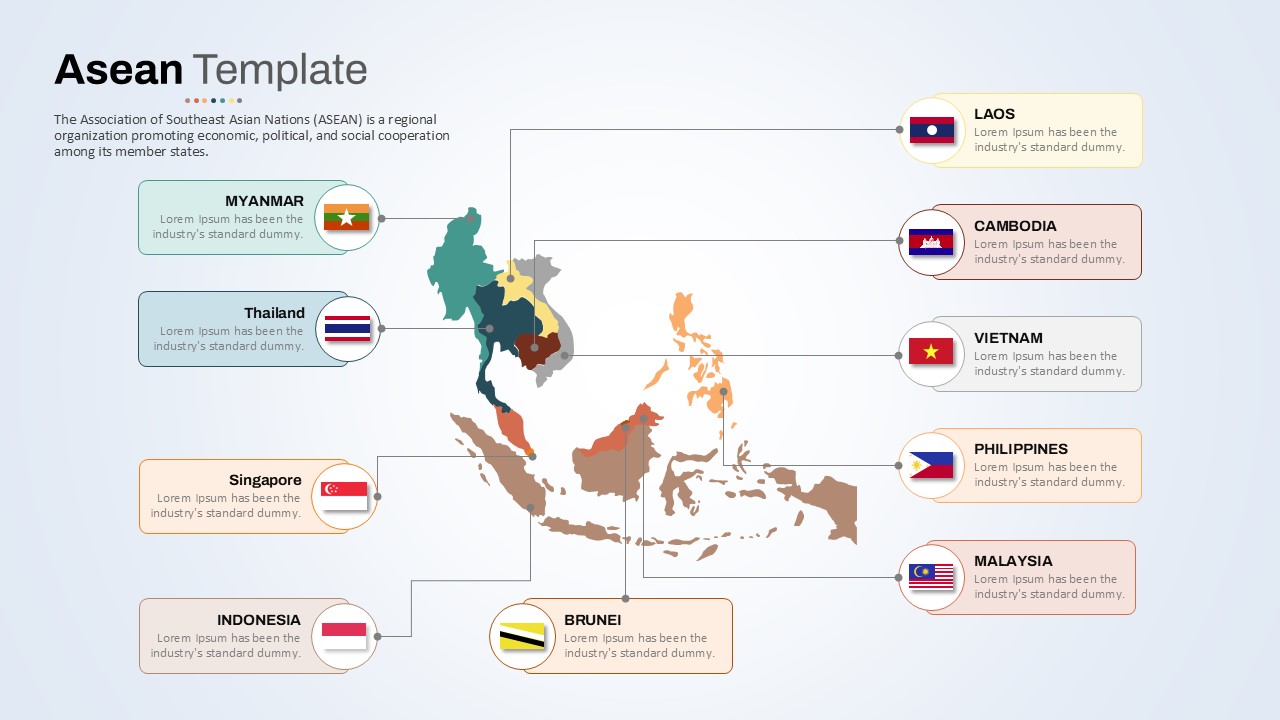
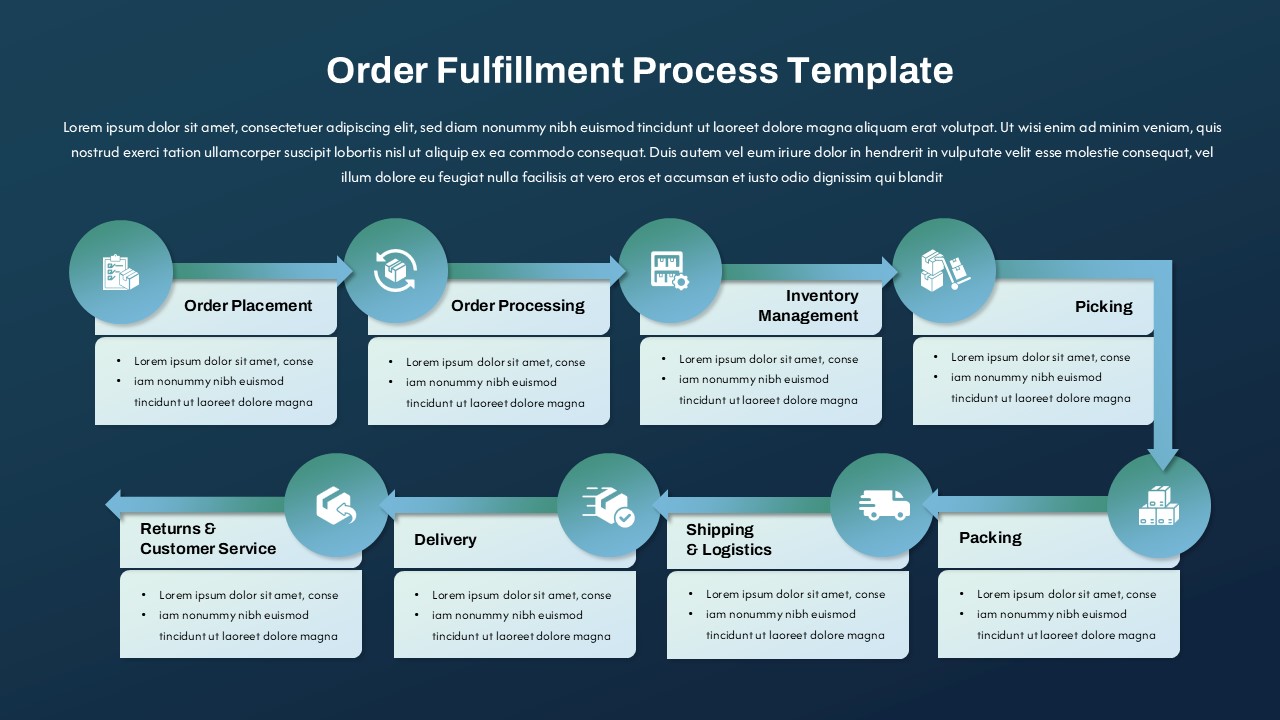
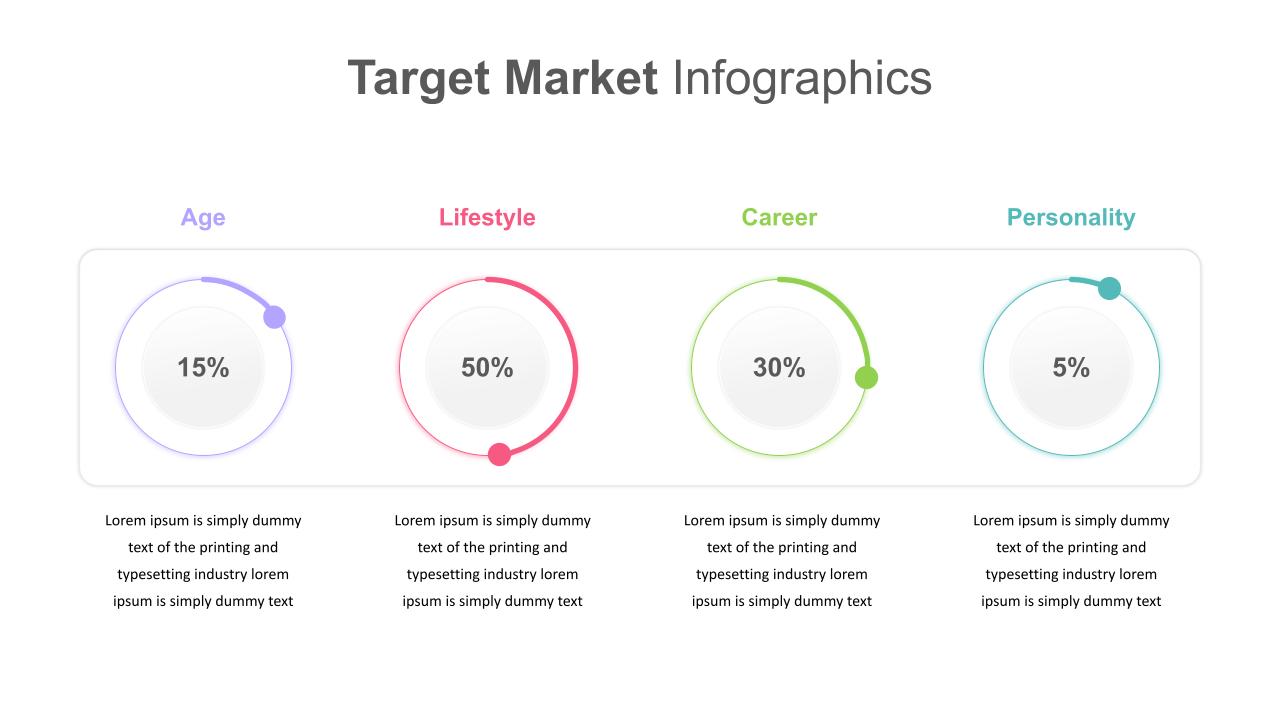
Features of this template
Other User Cases of the Template
Economics lectures, business strategy presentations, market research reports, academic projects, financial analysis, pricing strategy discussions, student assignments, corporate training, policy analysis presentations
FAQs
You May Also Like These Presentation Templates


- Free

- Free
- Free

- Free