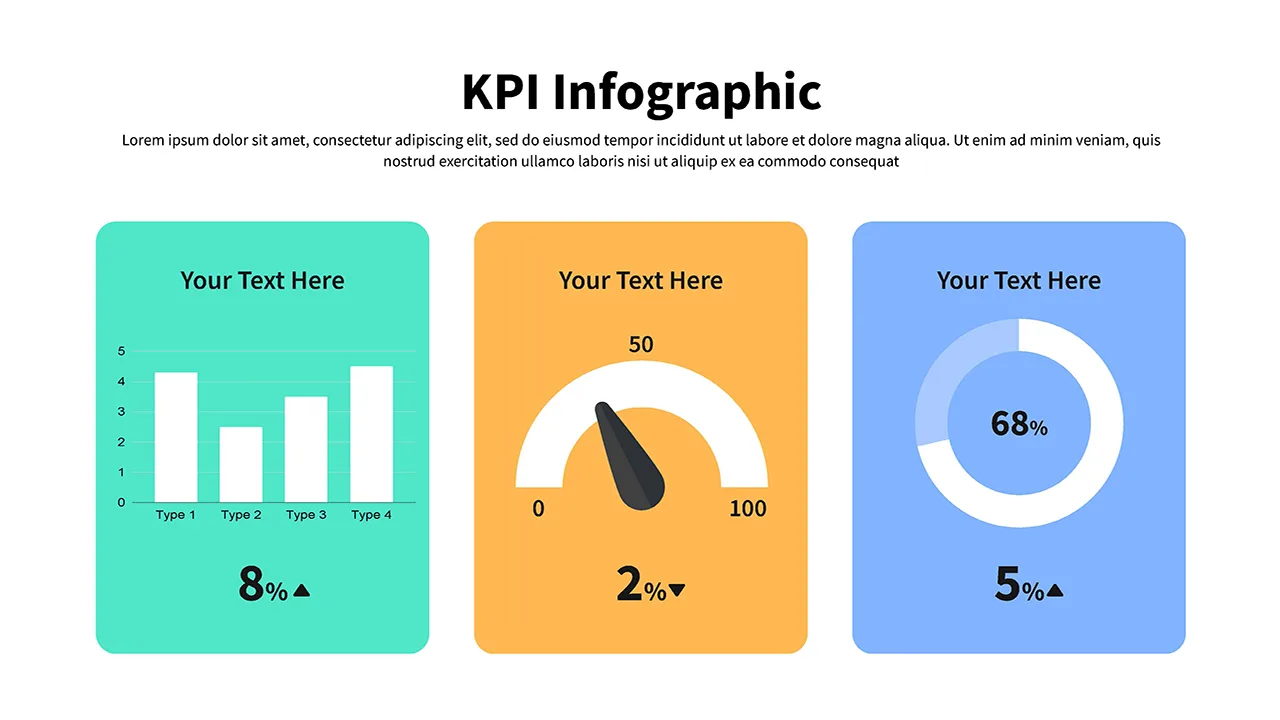
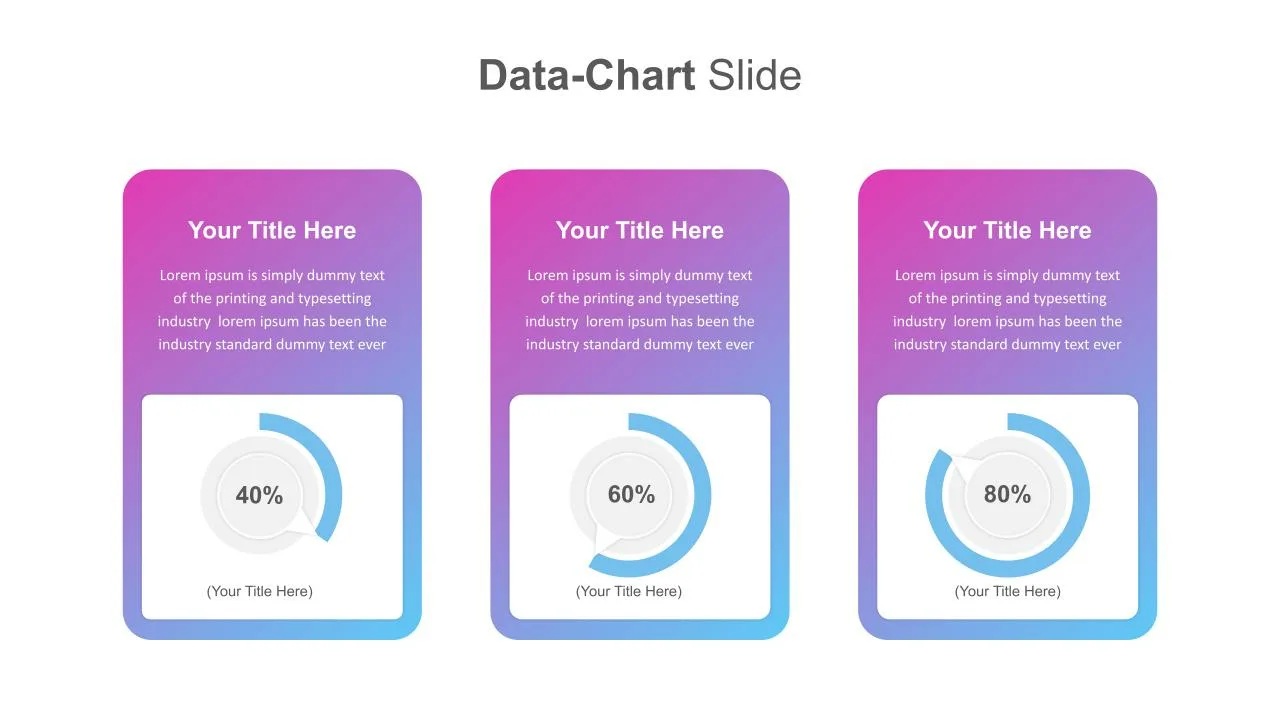
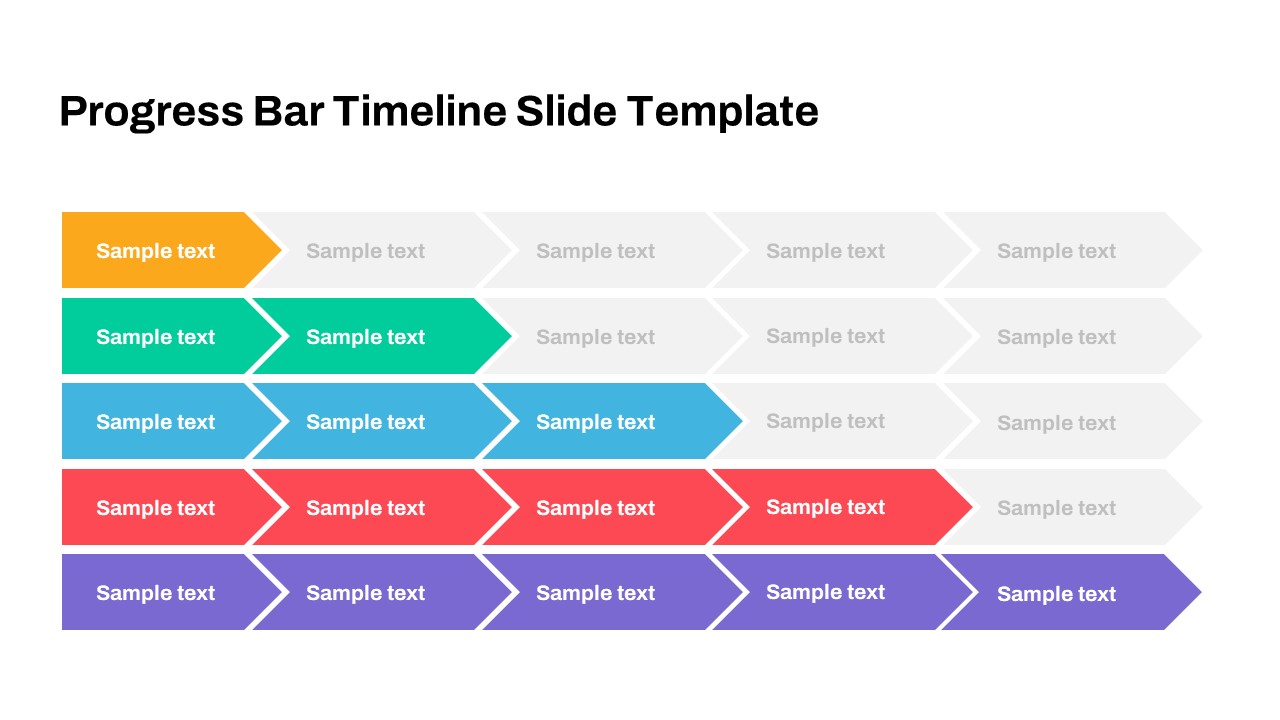
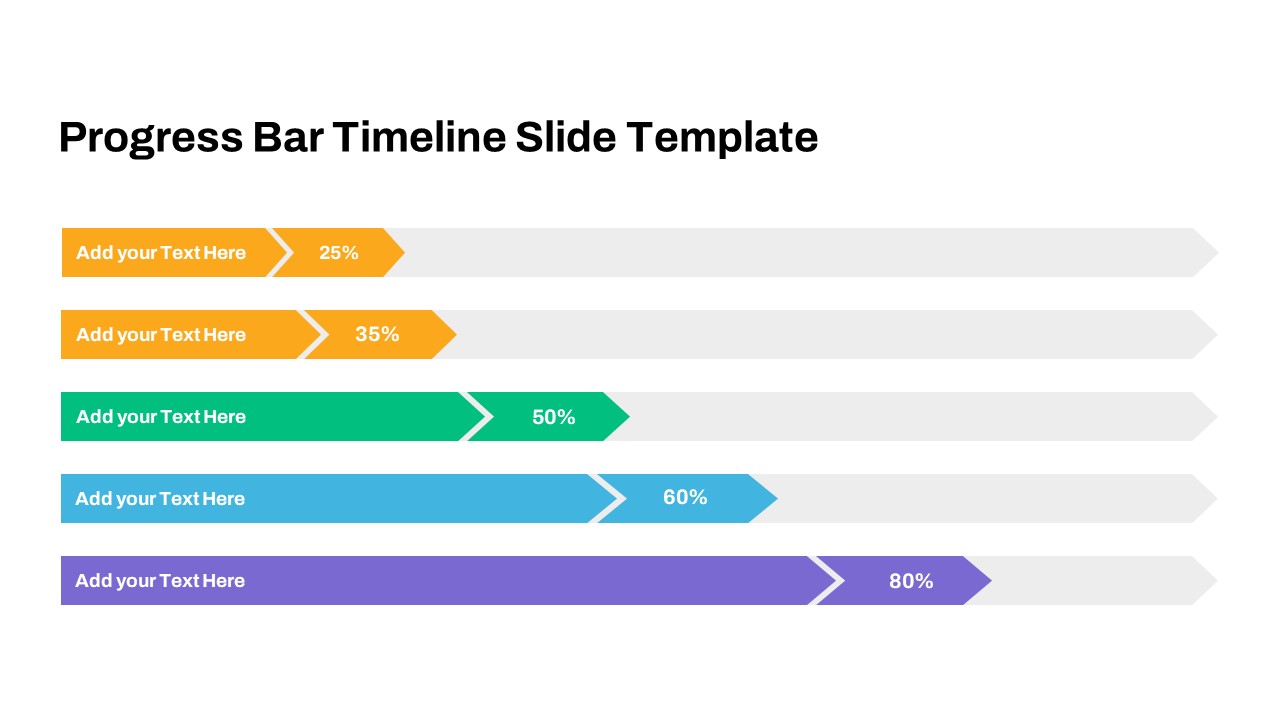
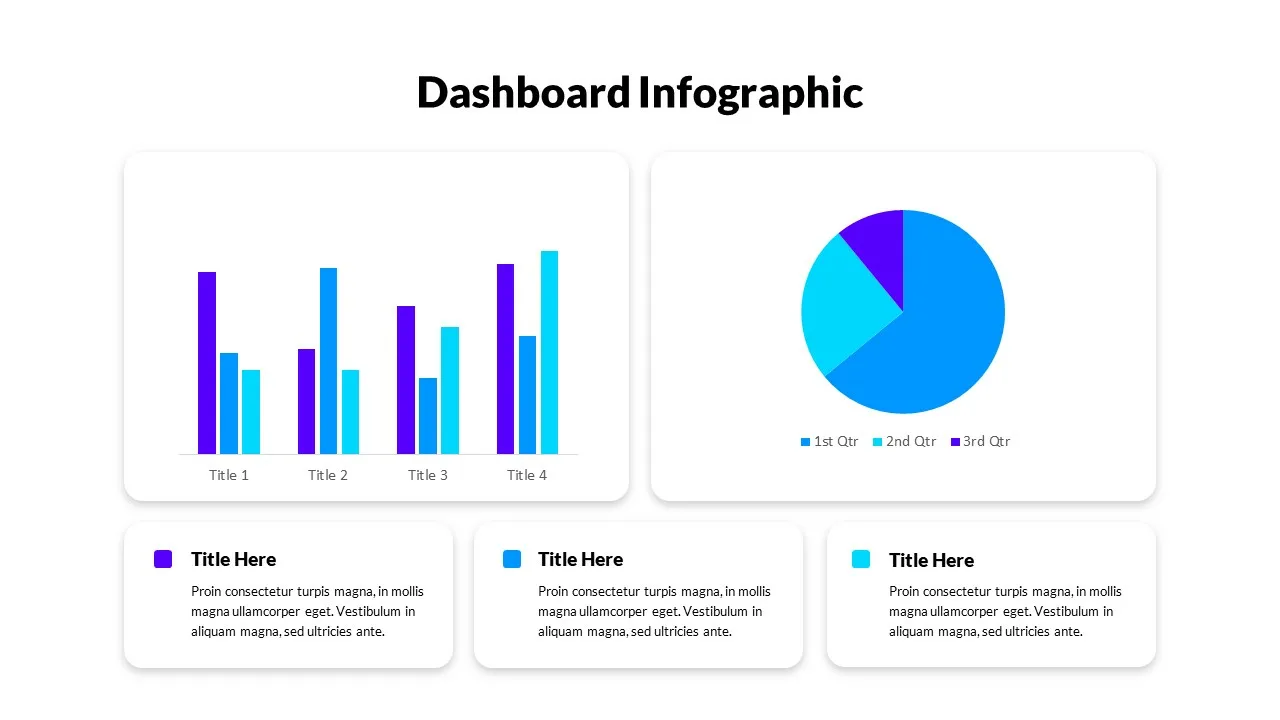
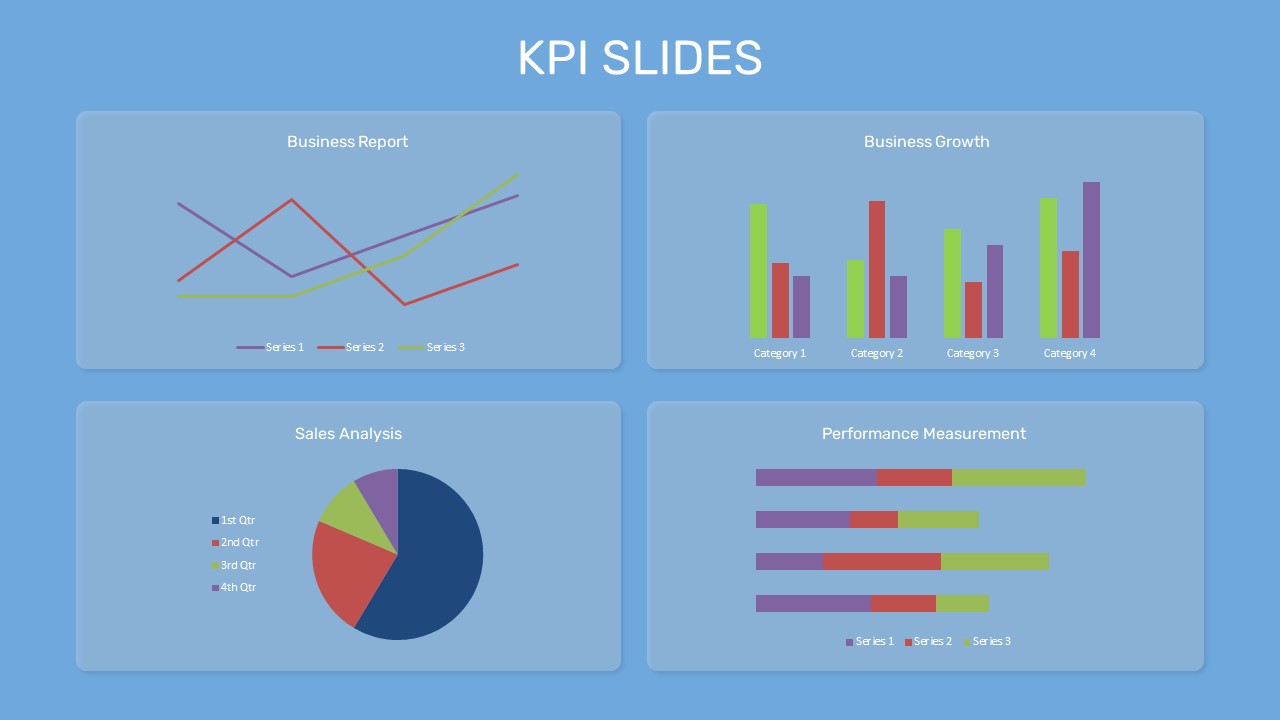
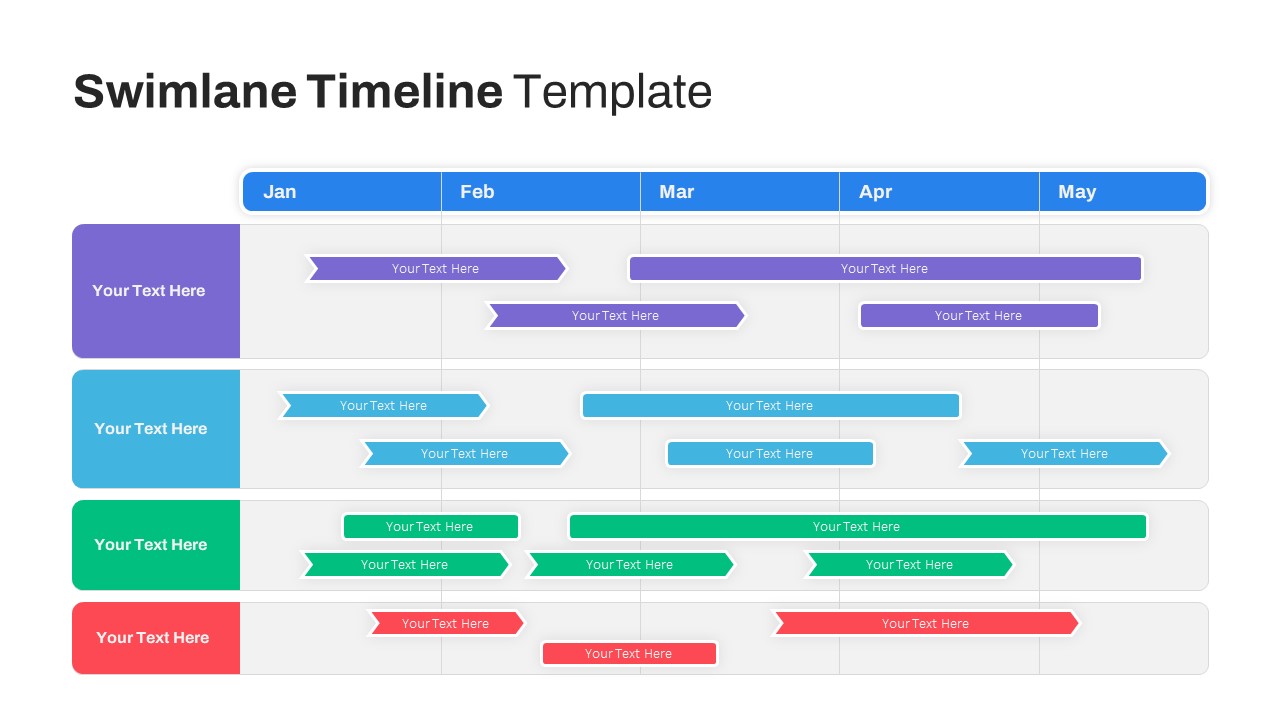
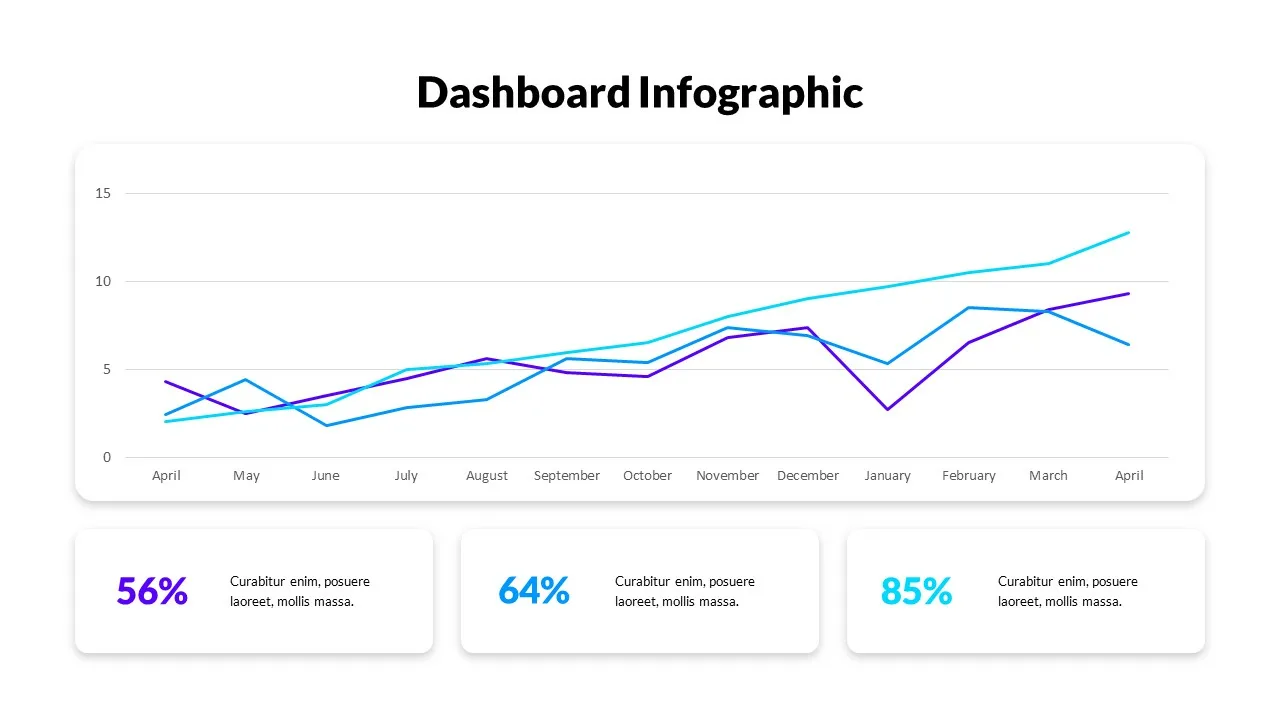
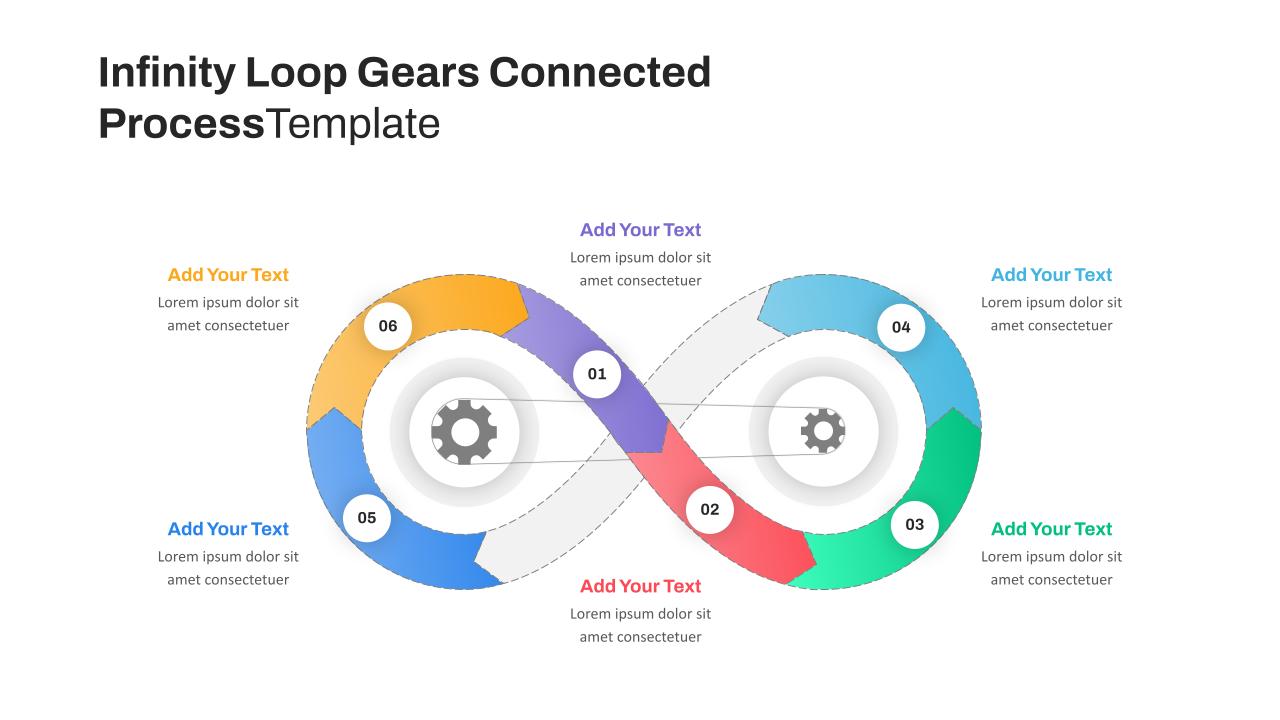
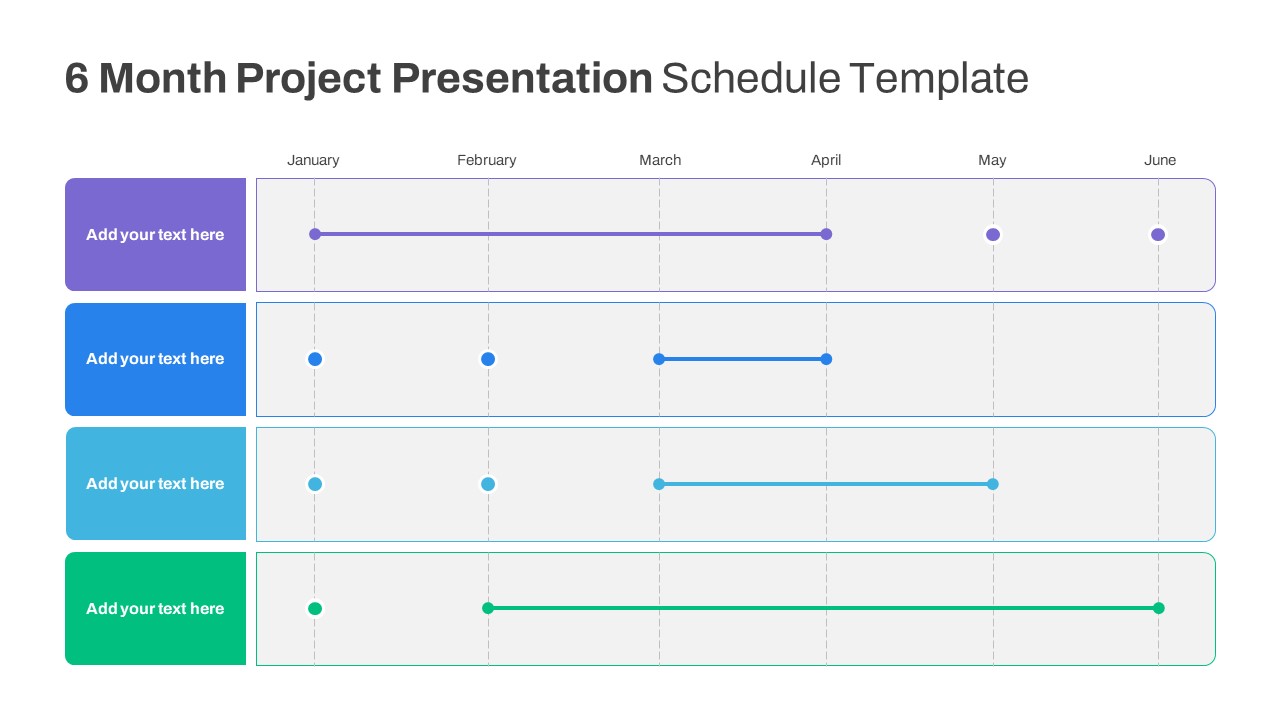
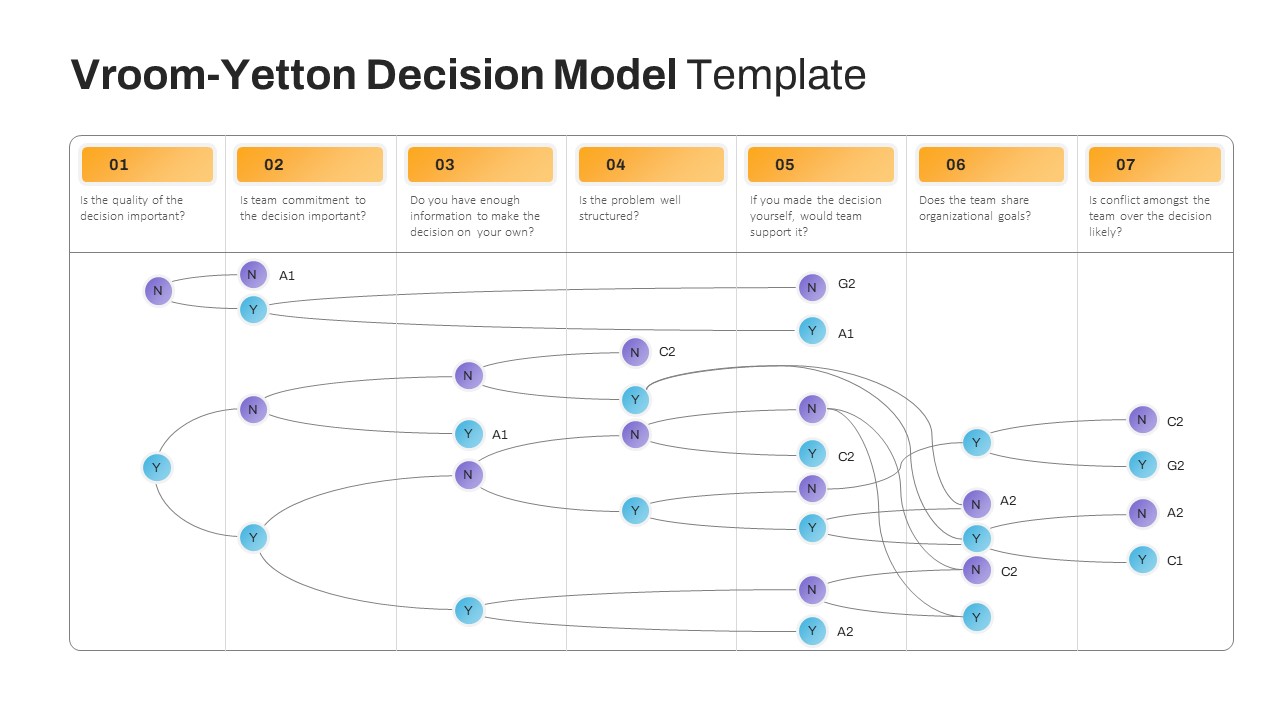
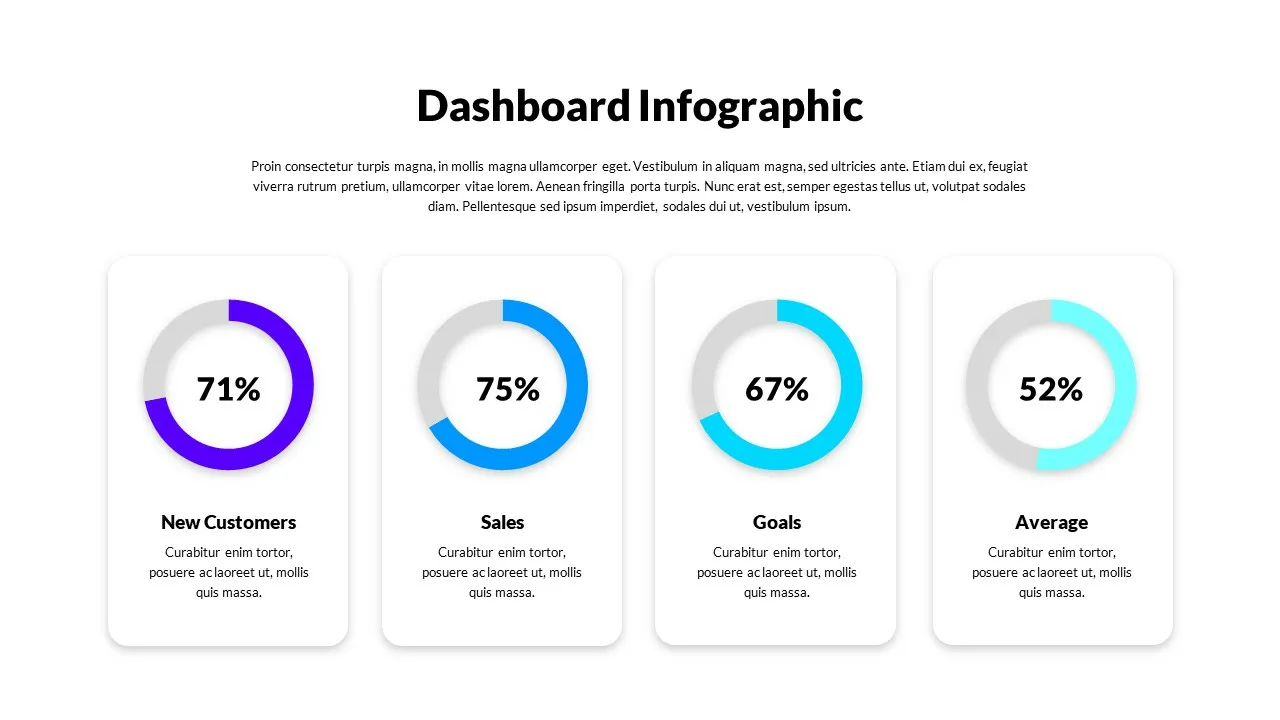
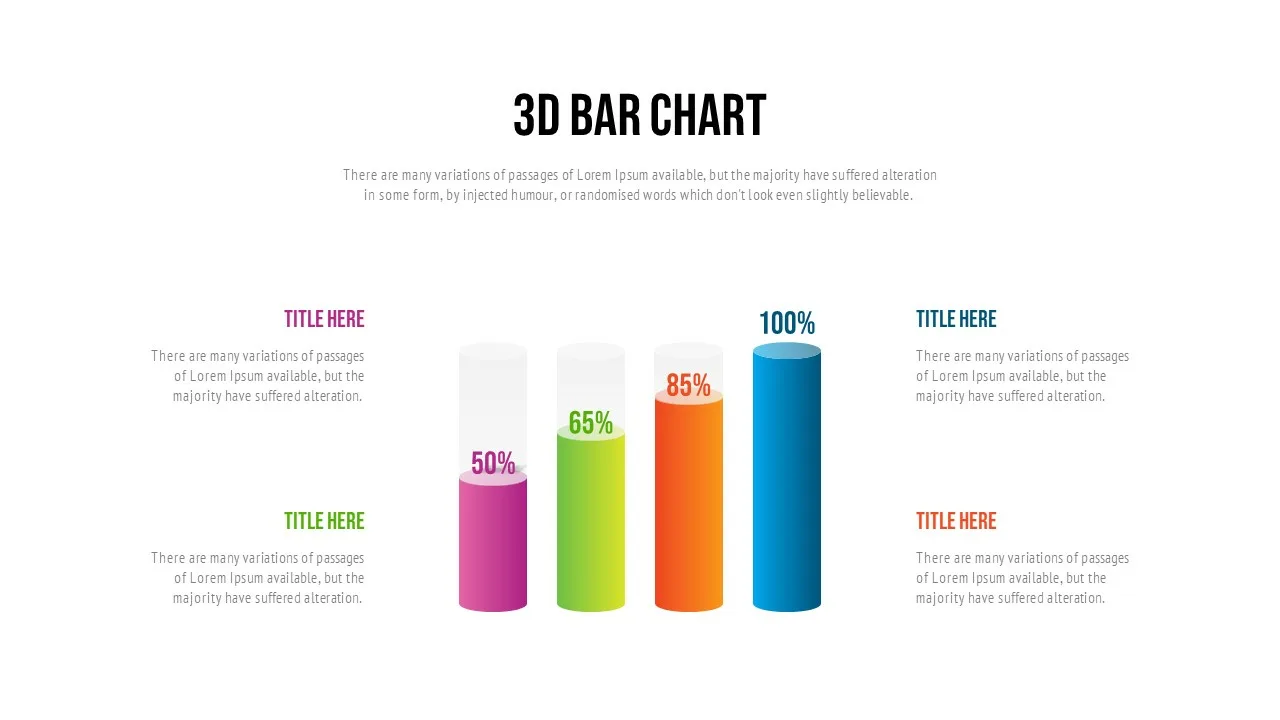
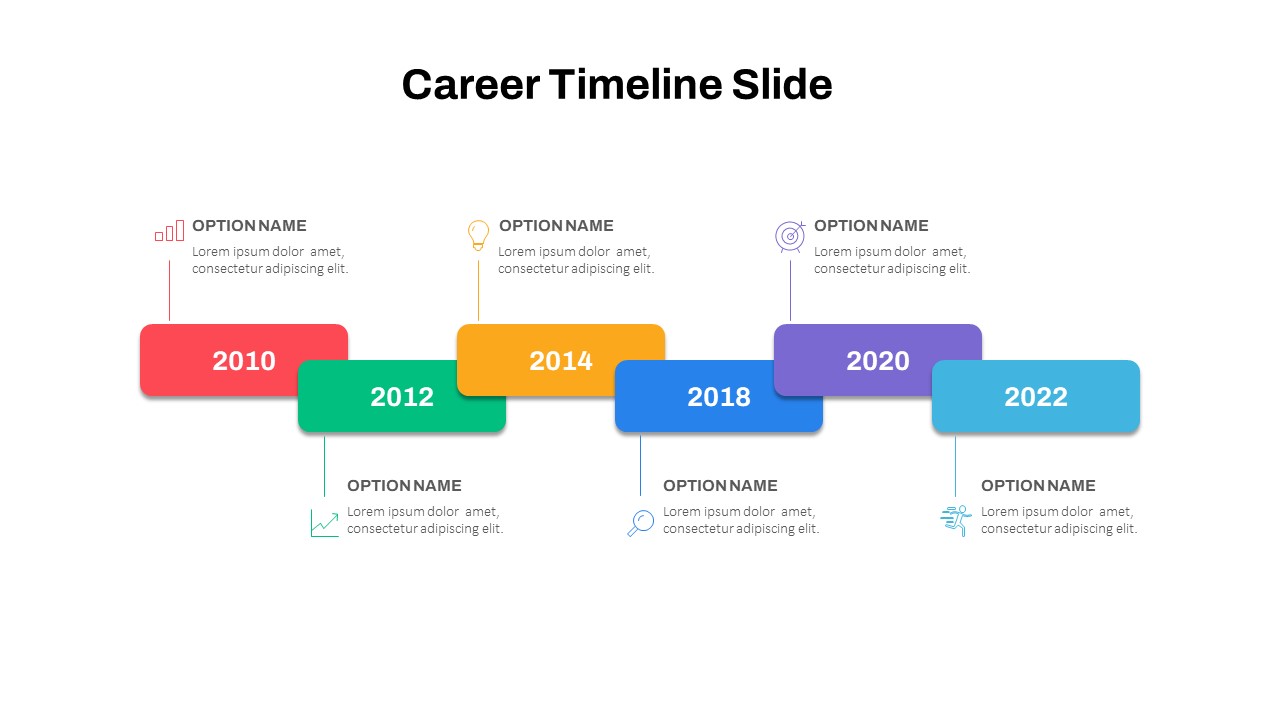
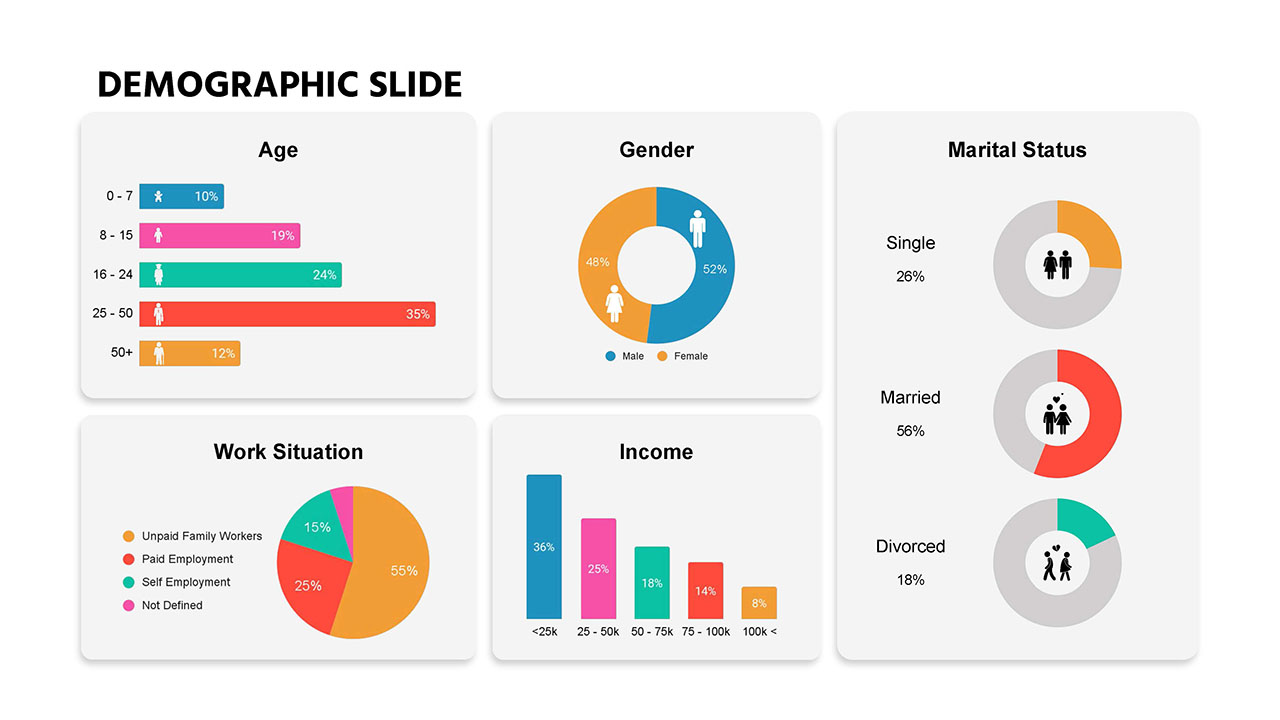
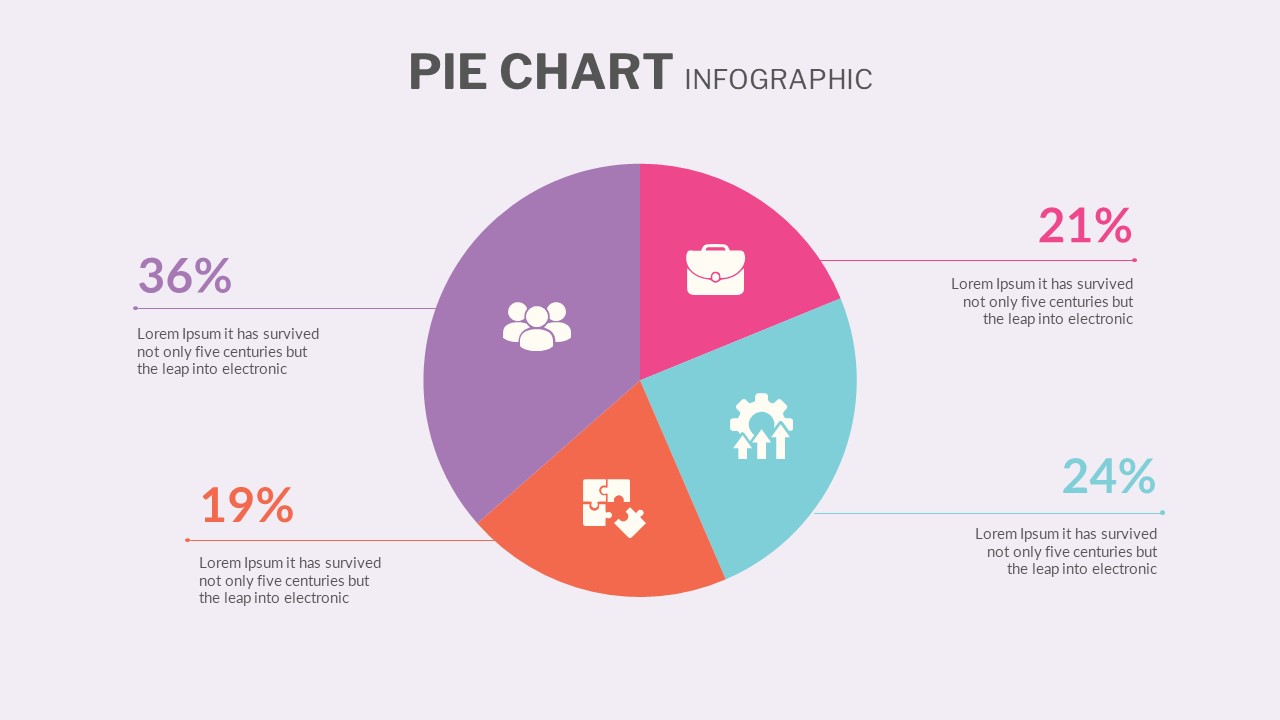
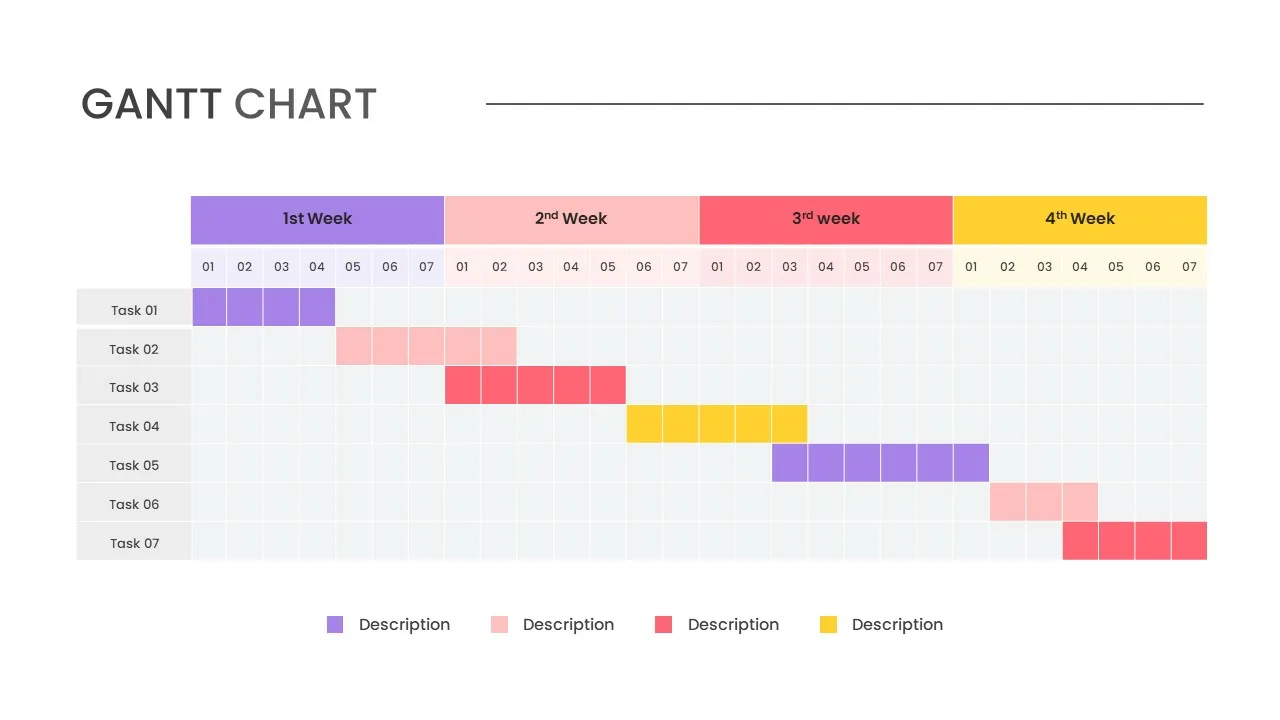
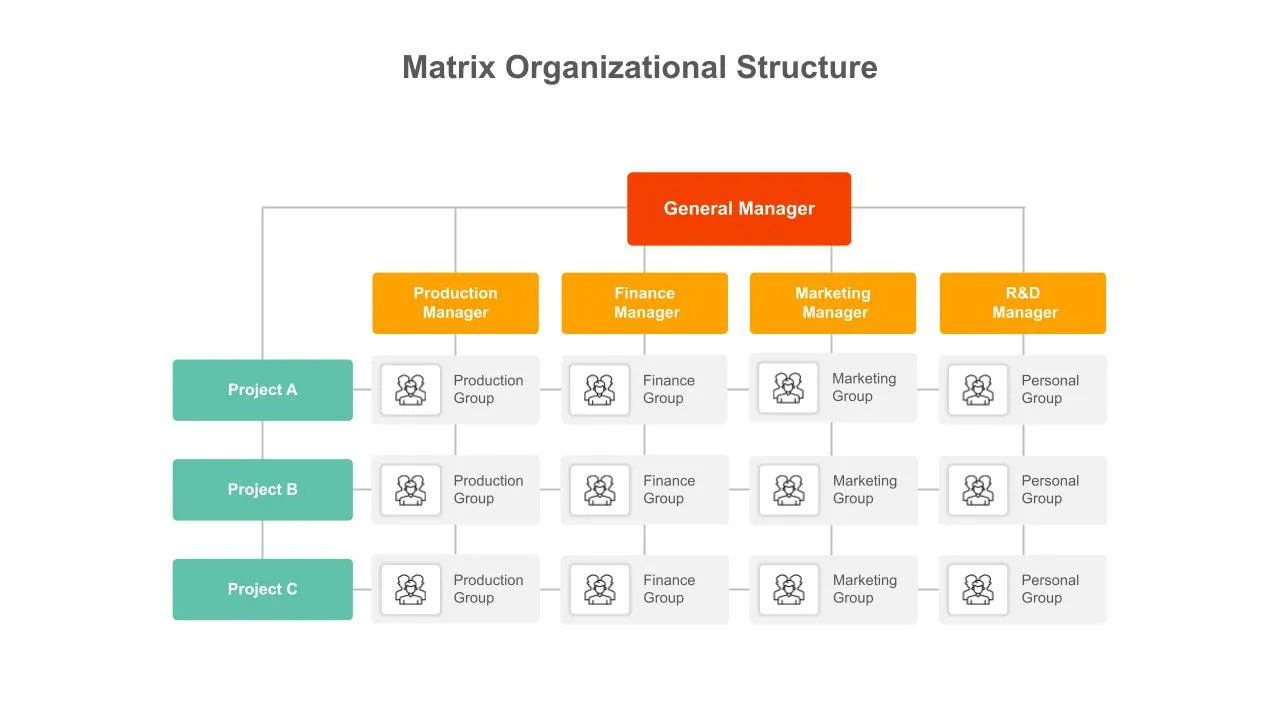
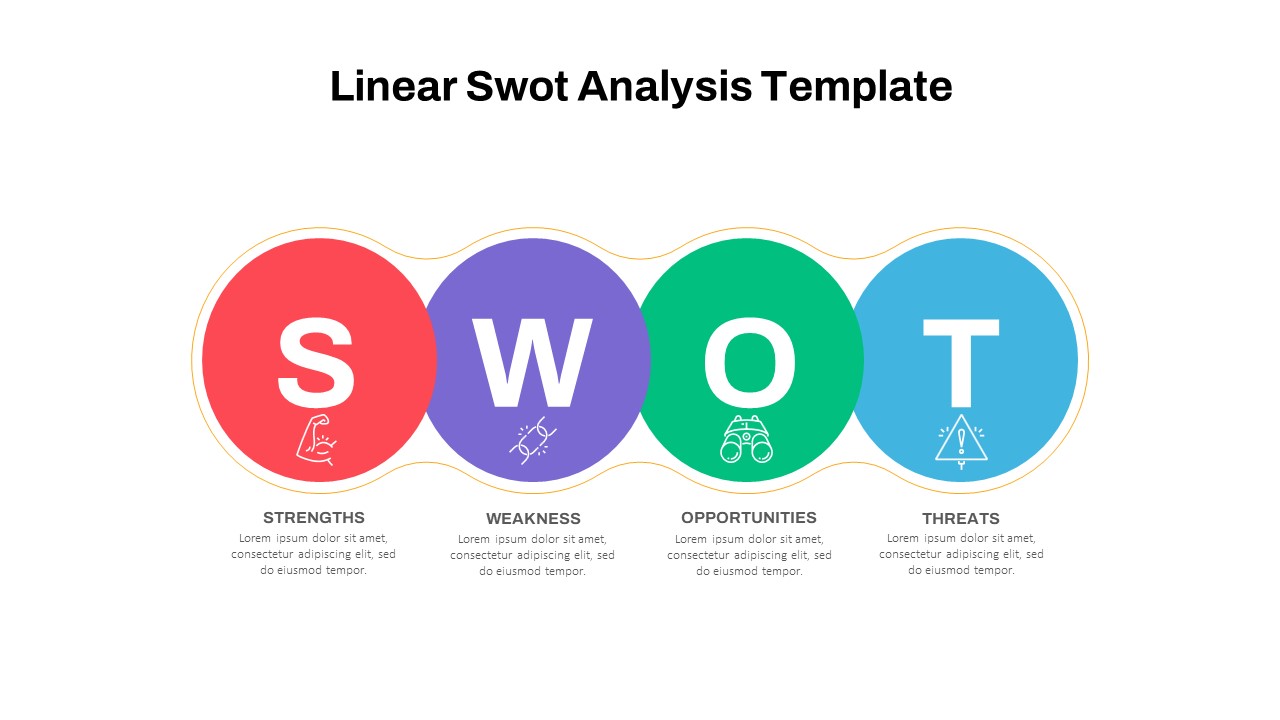
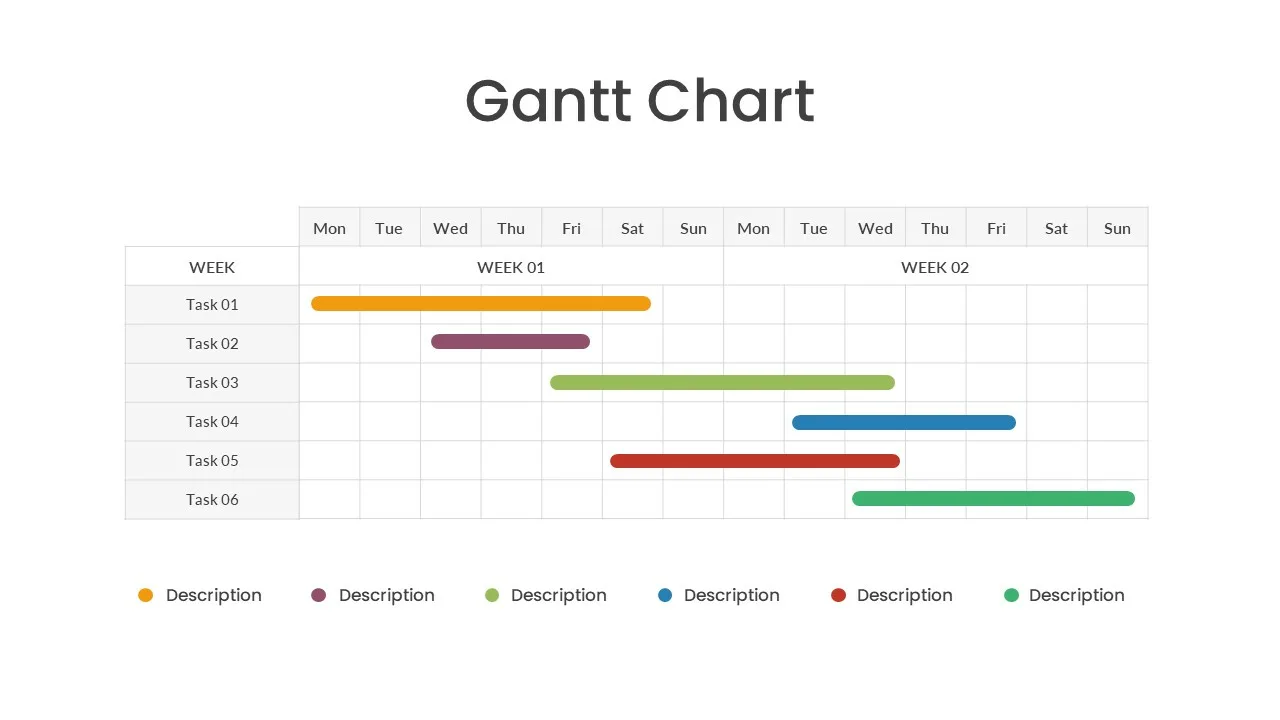
Data Charts & Graphs Presentation Slides


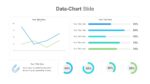
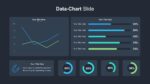
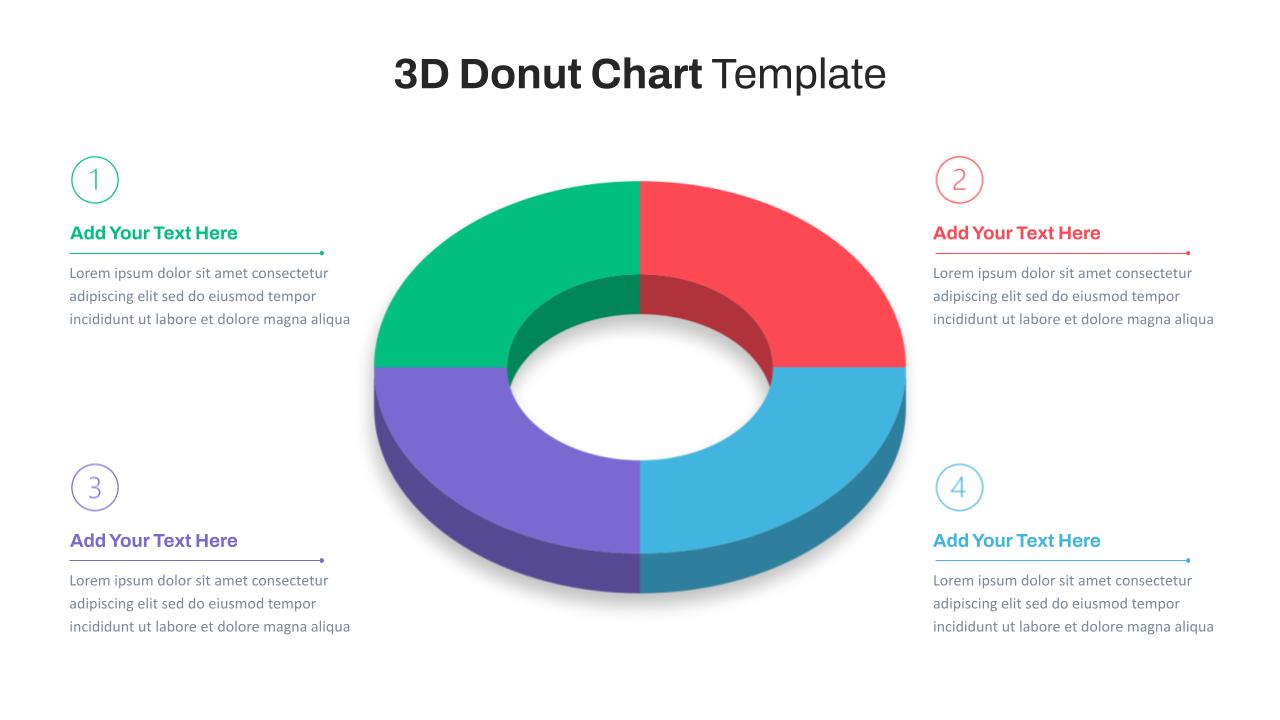
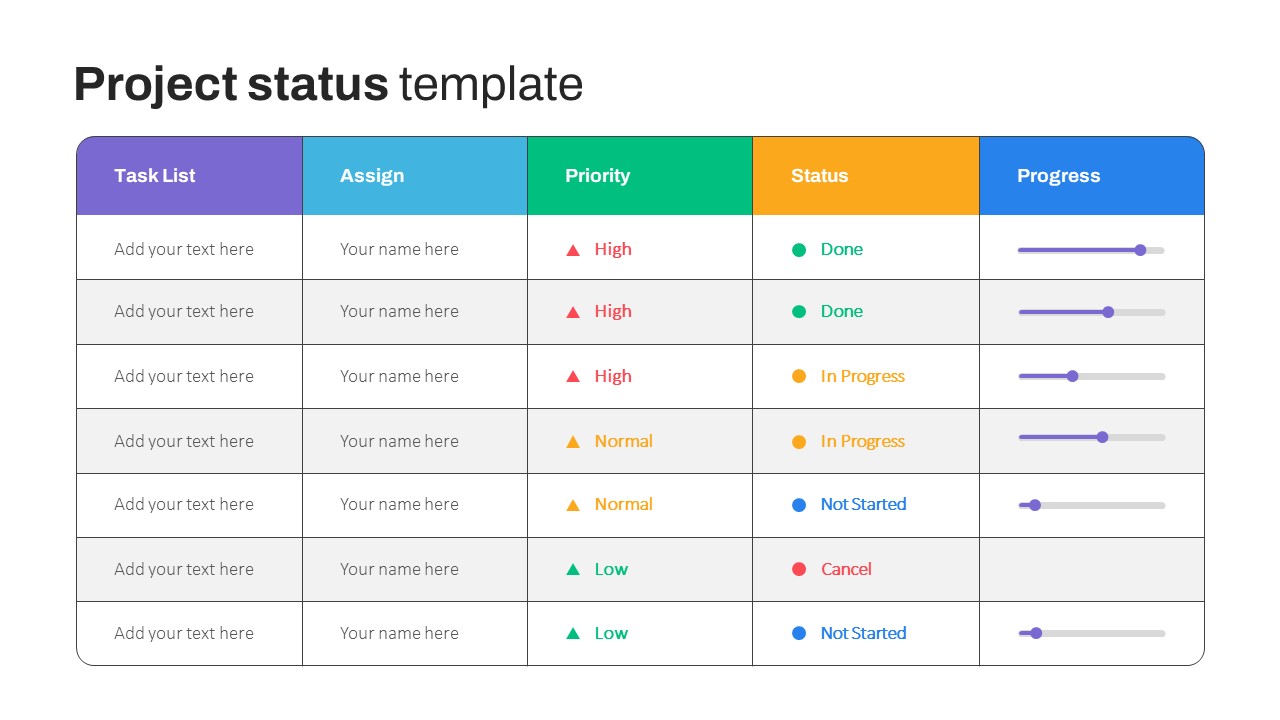
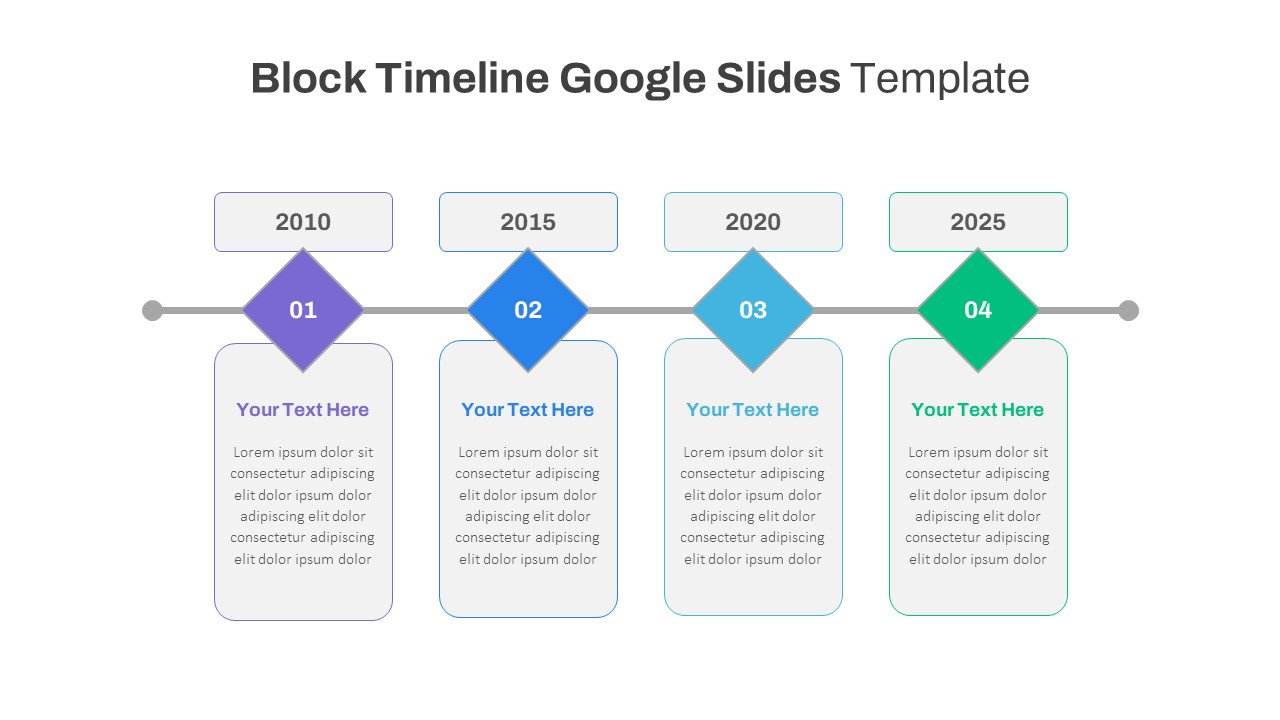
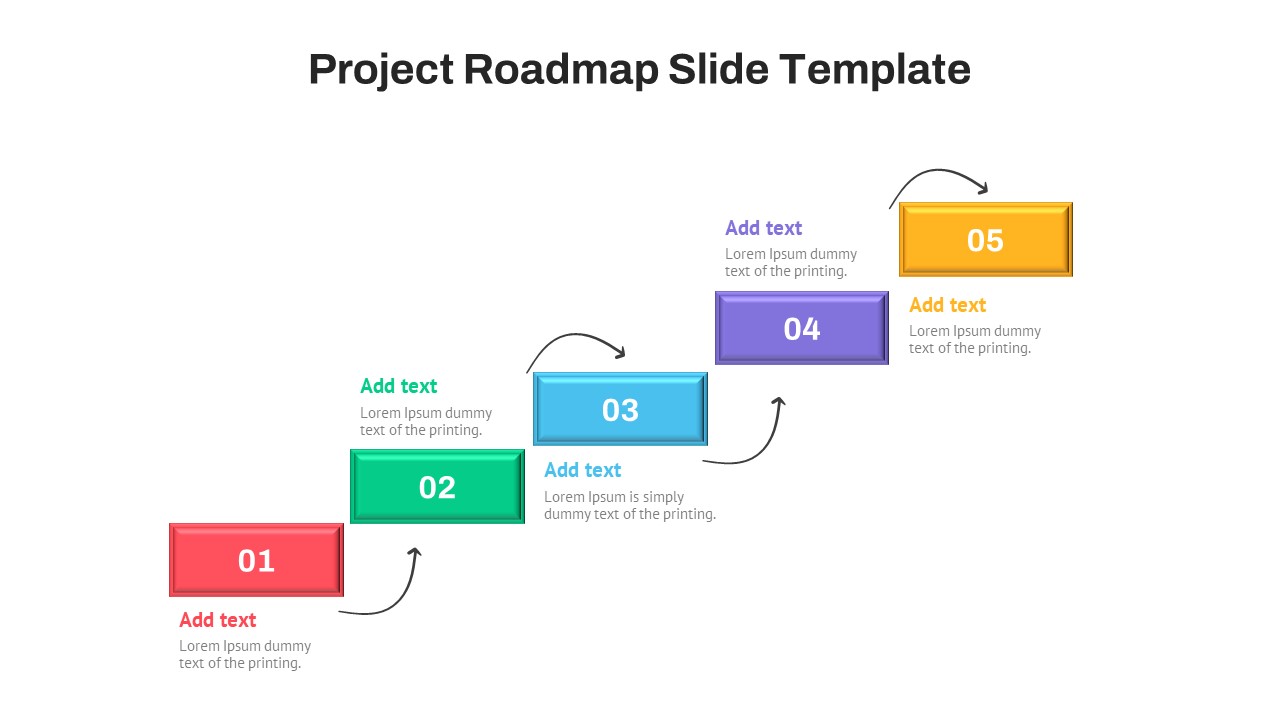
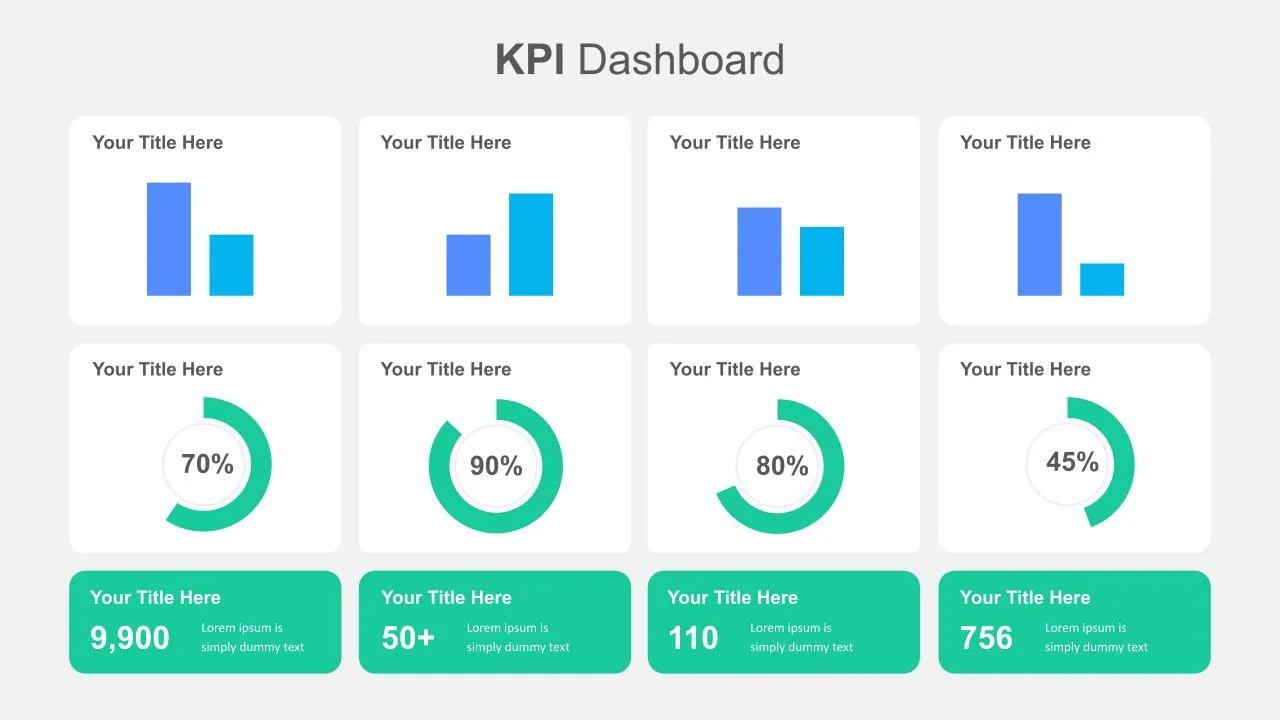
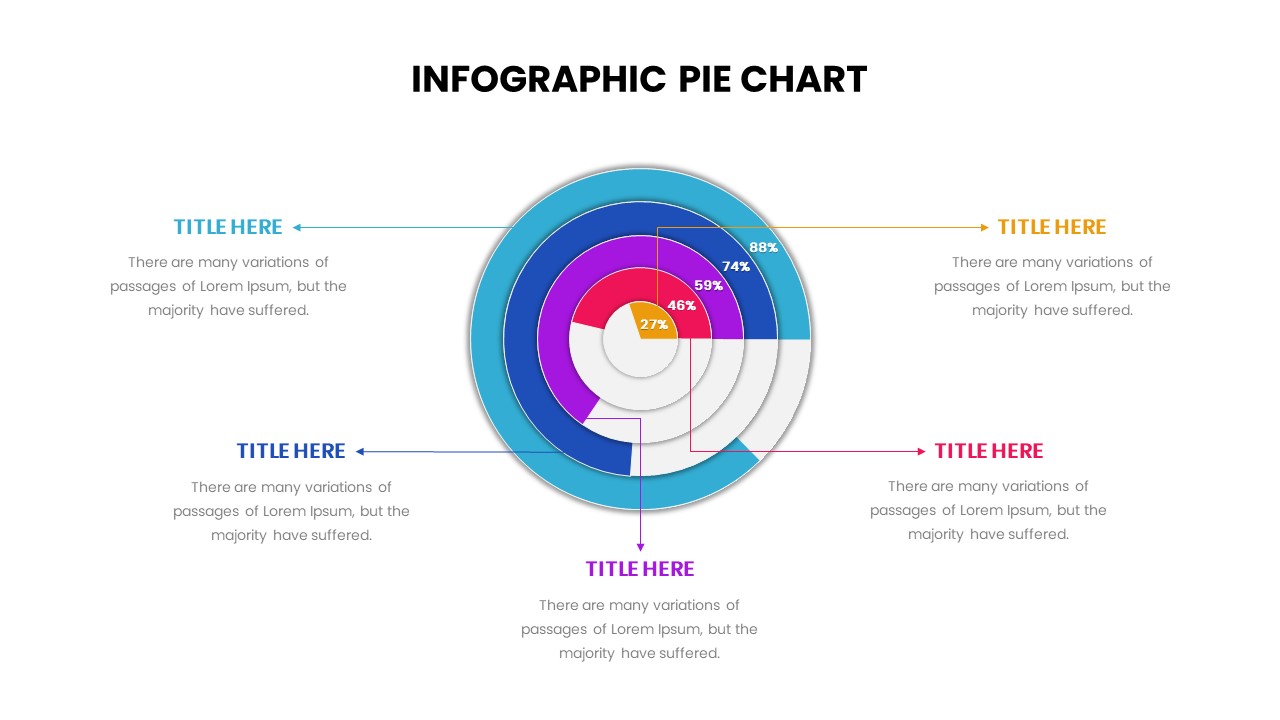
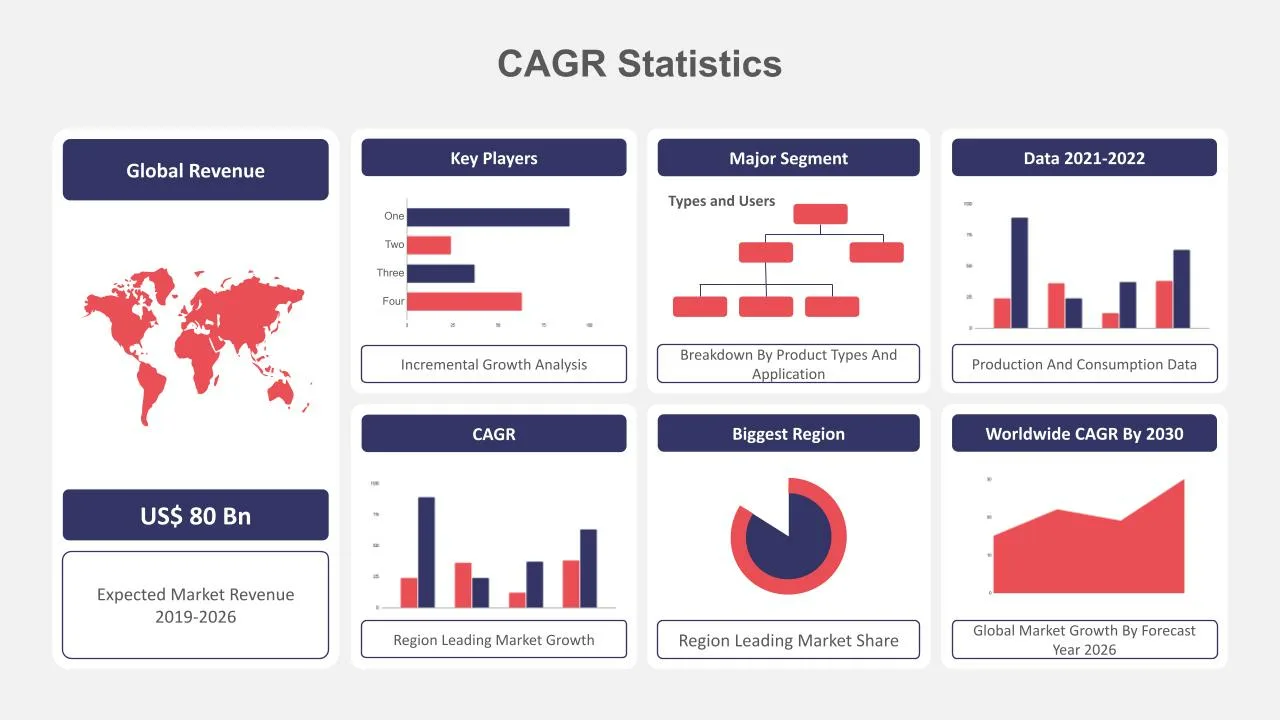
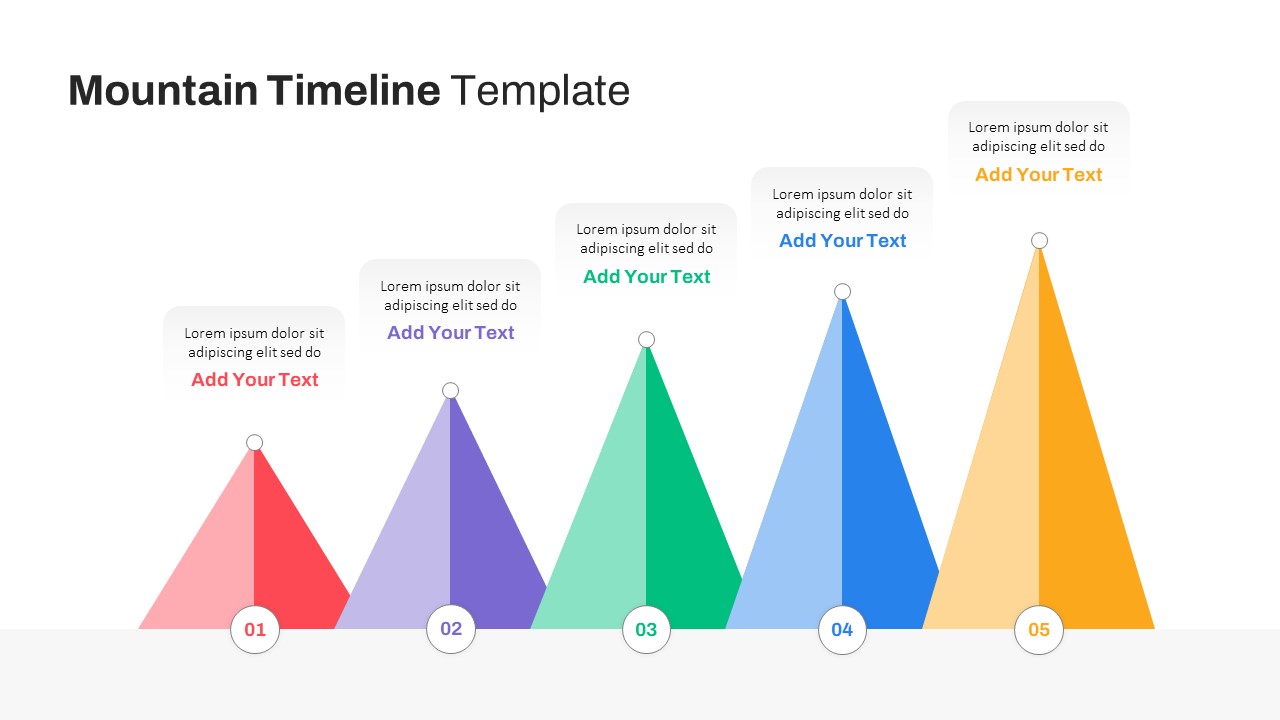
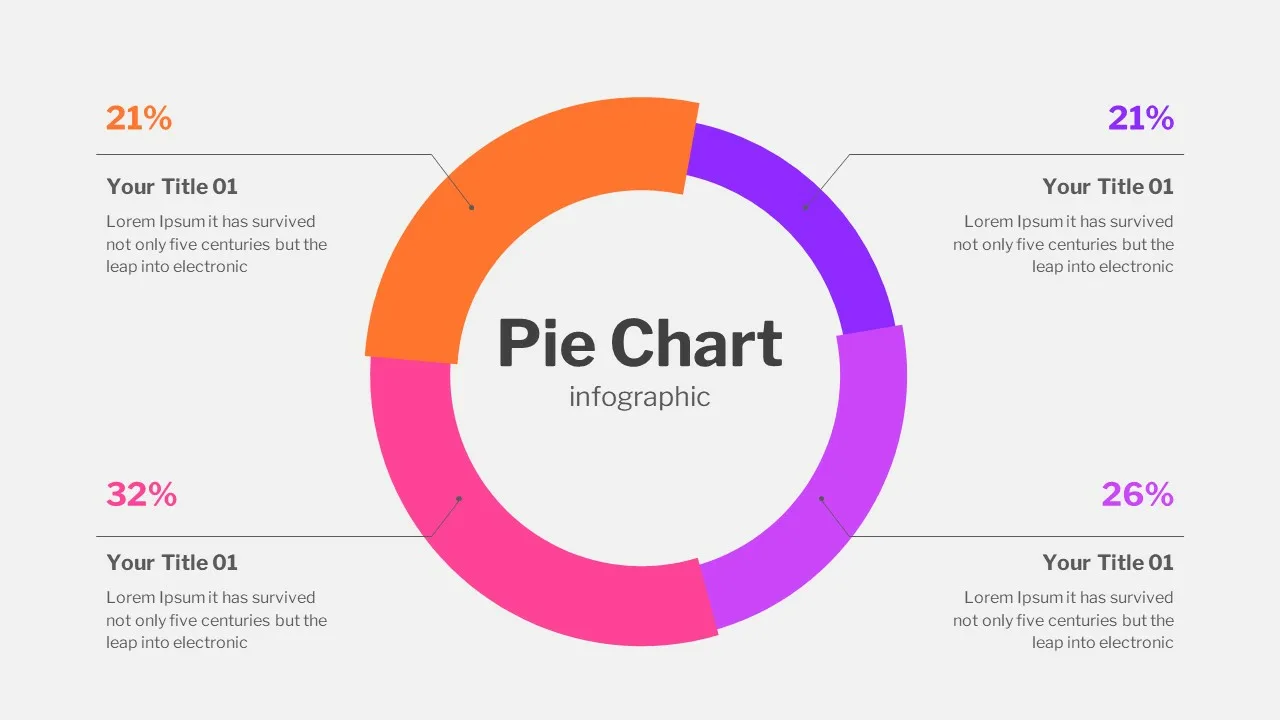
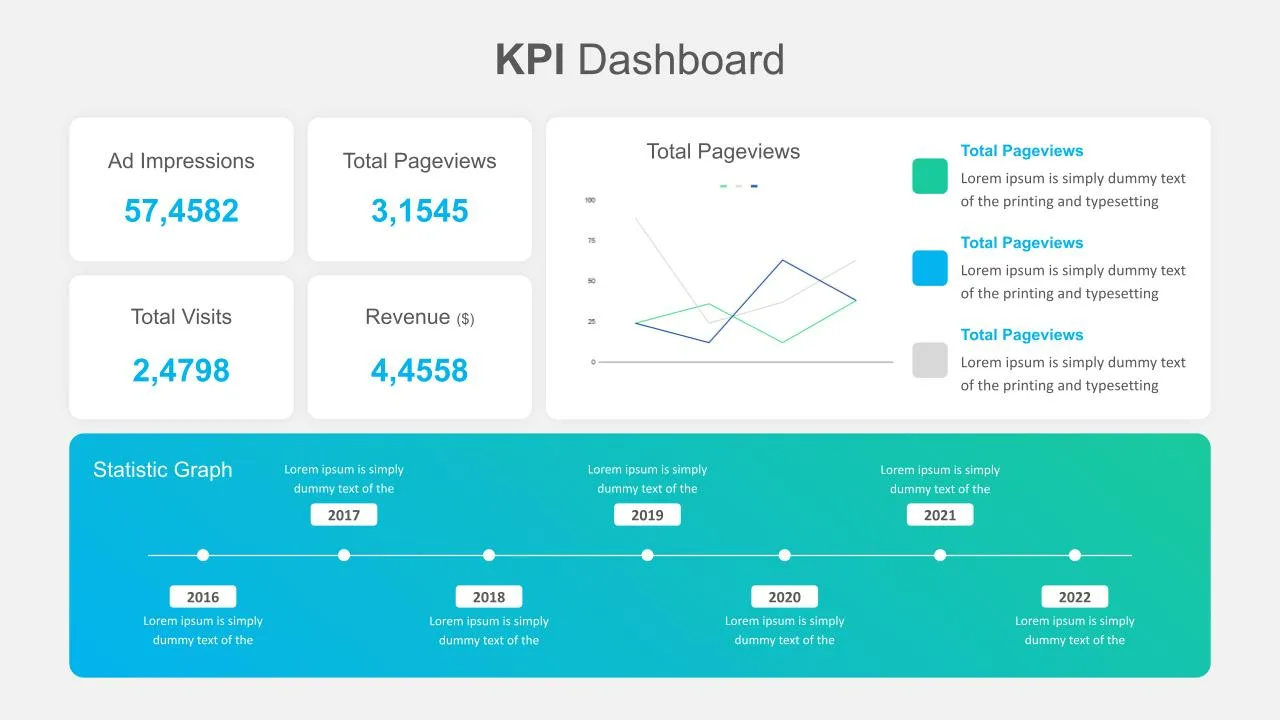
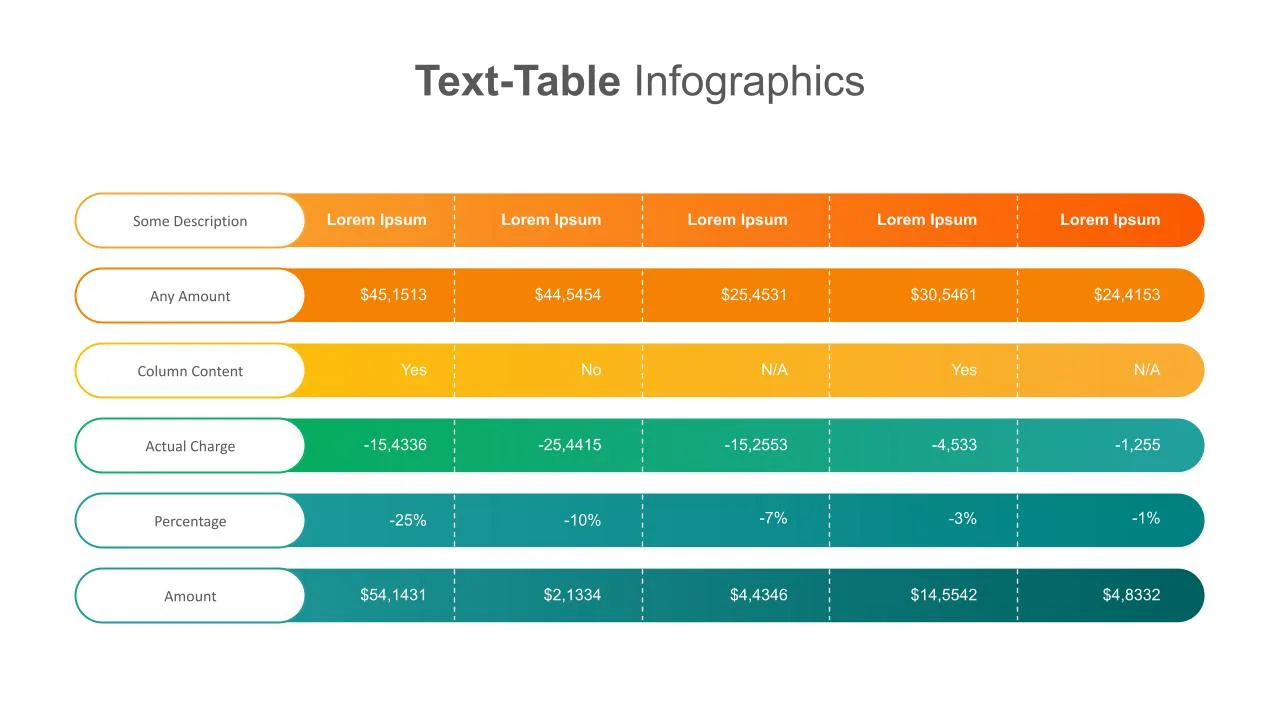
Data presentation templates are charts and graphs showing statistics in an easily understandable format. Statistics presentation is an inevitable part of every business meeting. But it becomes hard to prepare a template that contains all data in a single presentation slide. However, these data slides are an exception containing facts and figures with the help of a line graph, bar chart, and a donut chart. The statistics google slides theme comes in two background colors as a dashboard presentation. It allows modifications without losing the slide quality. Download the chart and graph presentation templates now!
See more

Aspect Ratio
16:9Item ID
SKT00346
You May Also Like These Presentation Templates


- Free
- Free
- Free
- Free
- Free
- Free
- Free
- Free