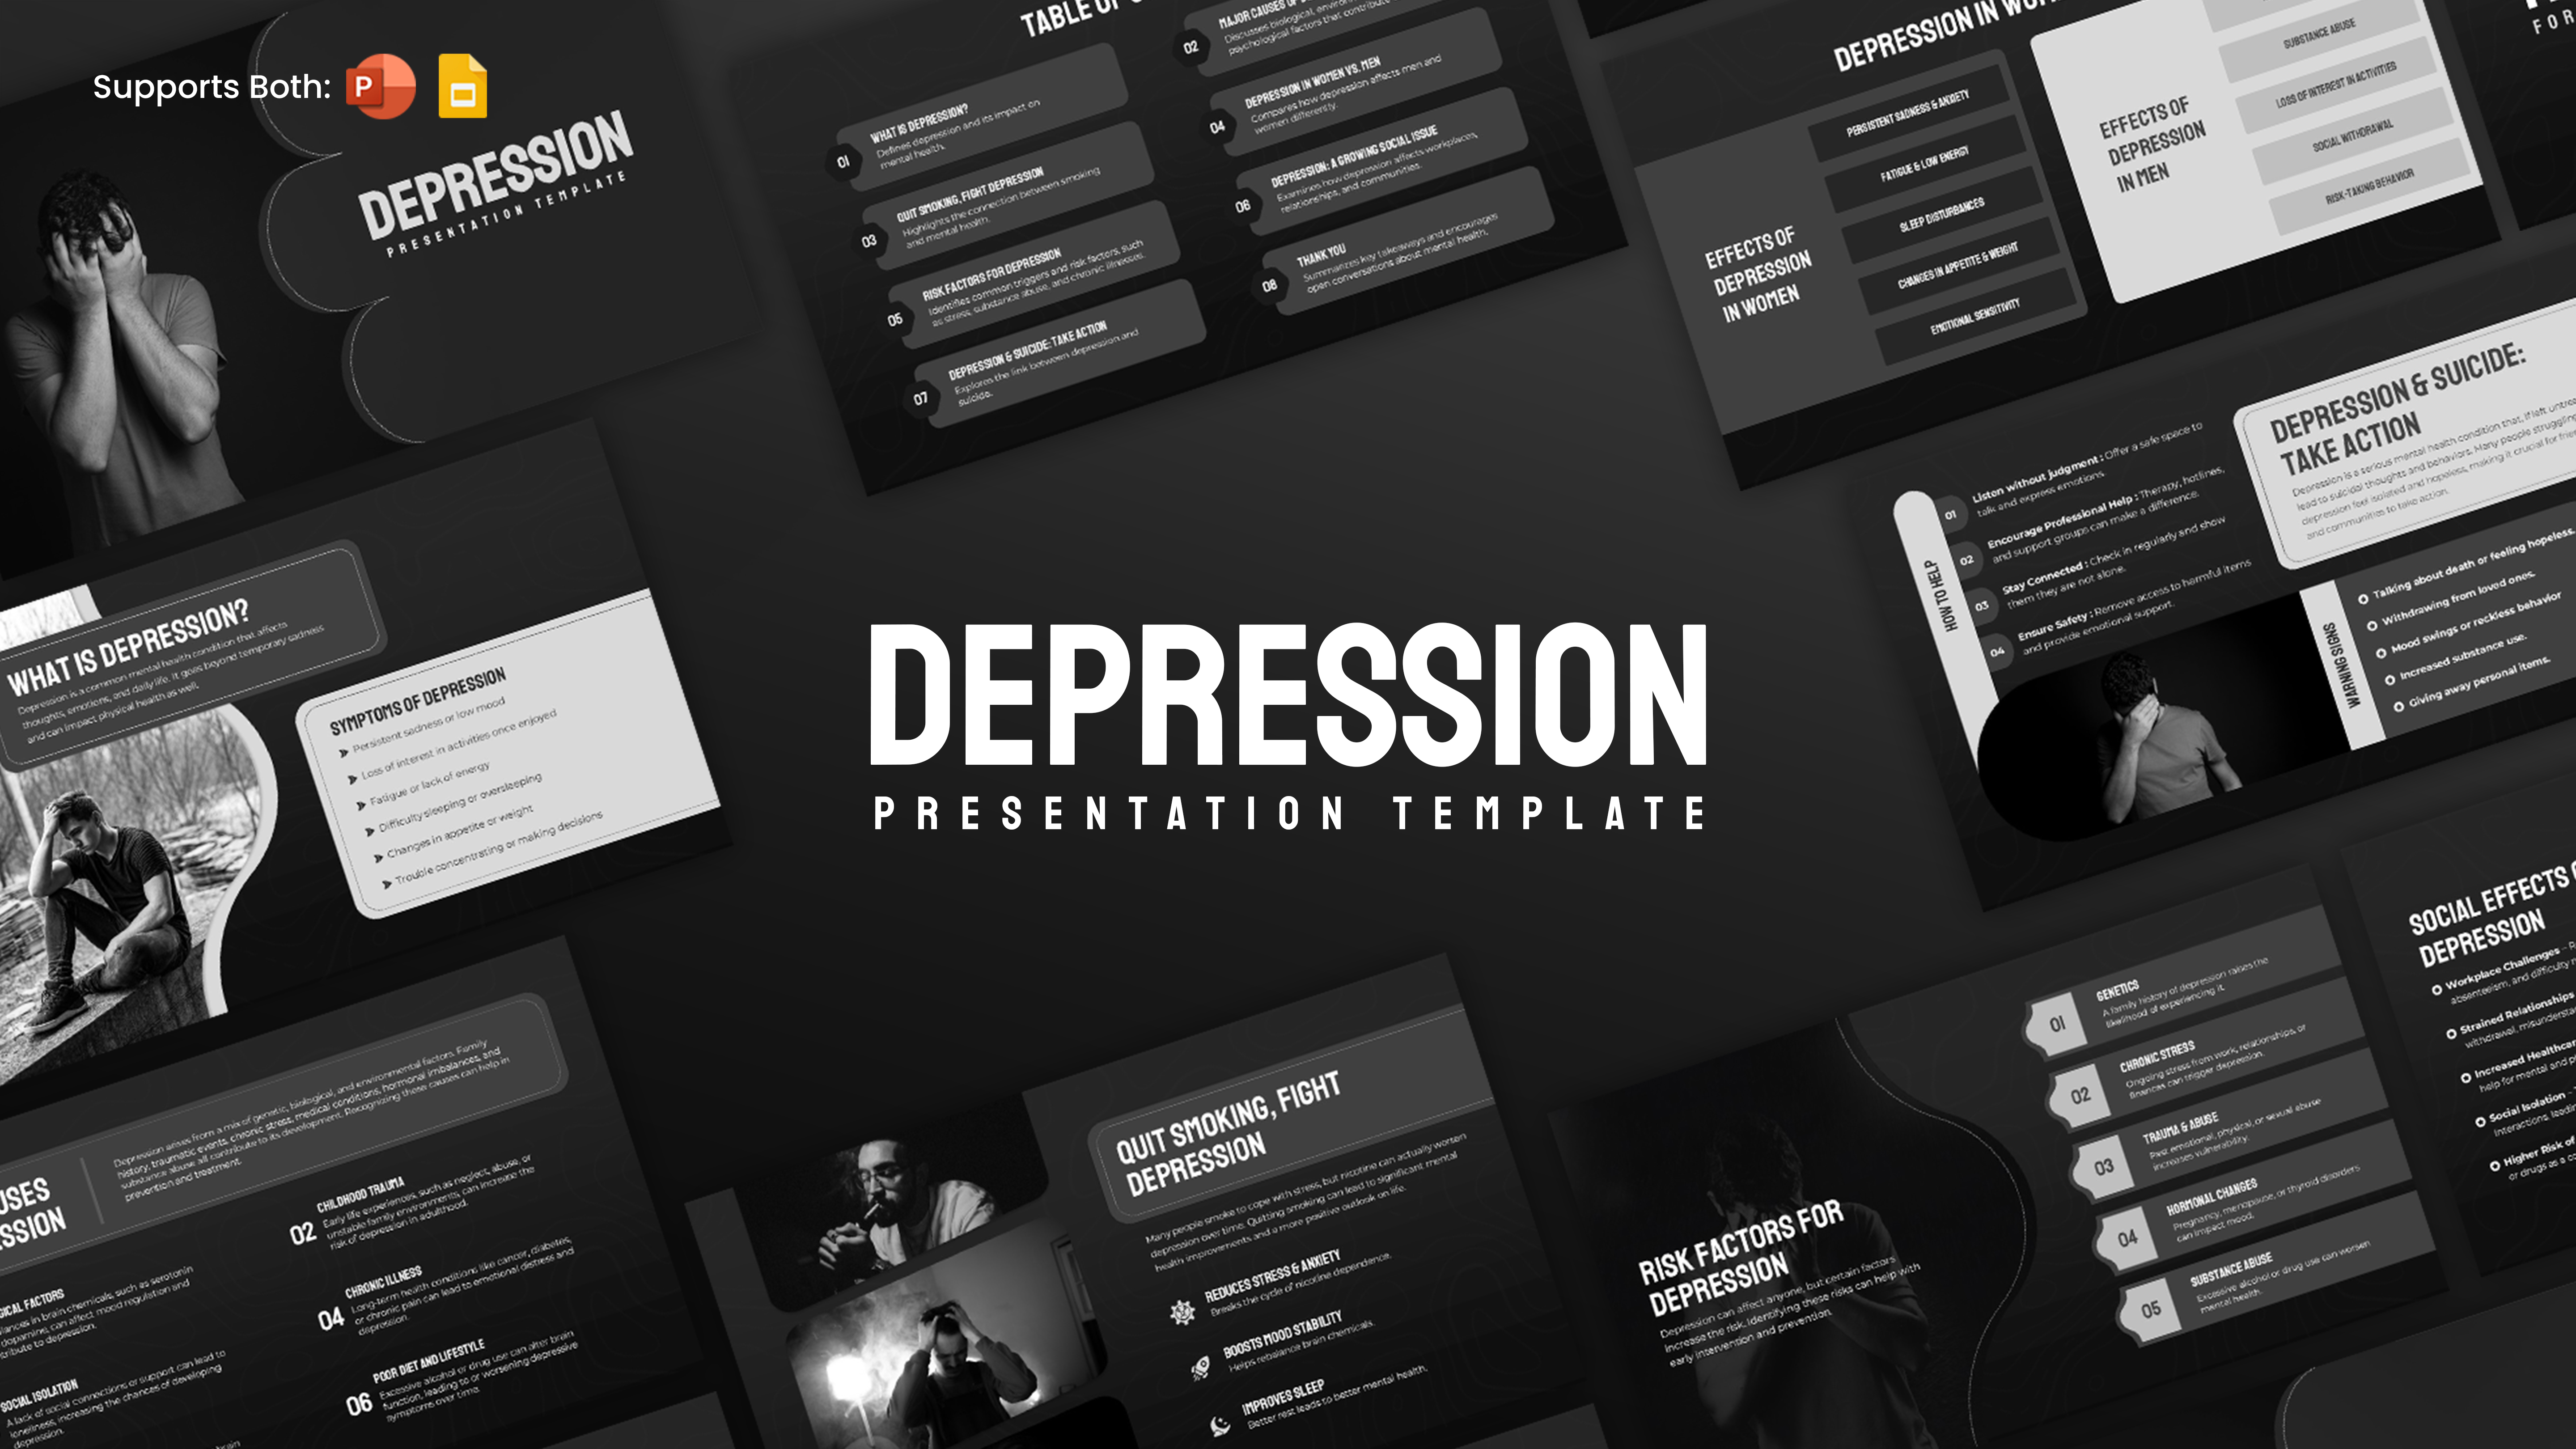
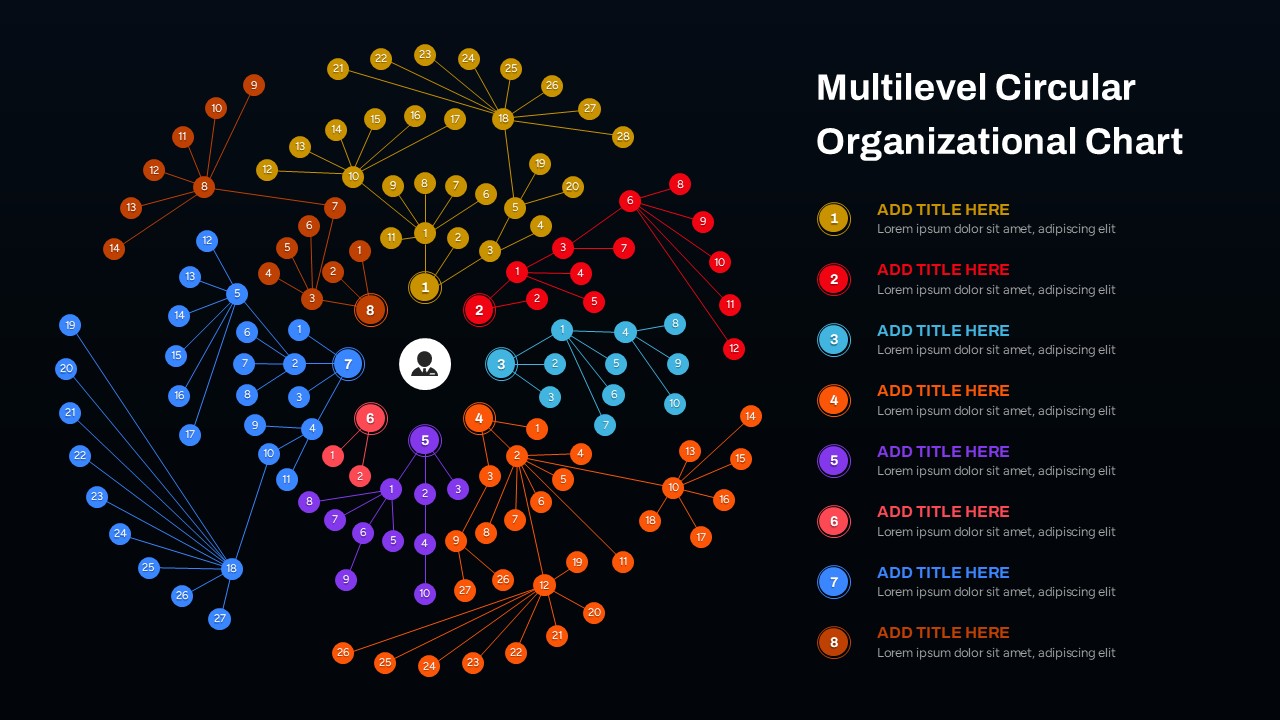
Cladogram Template for PowerPoint & Google Slides
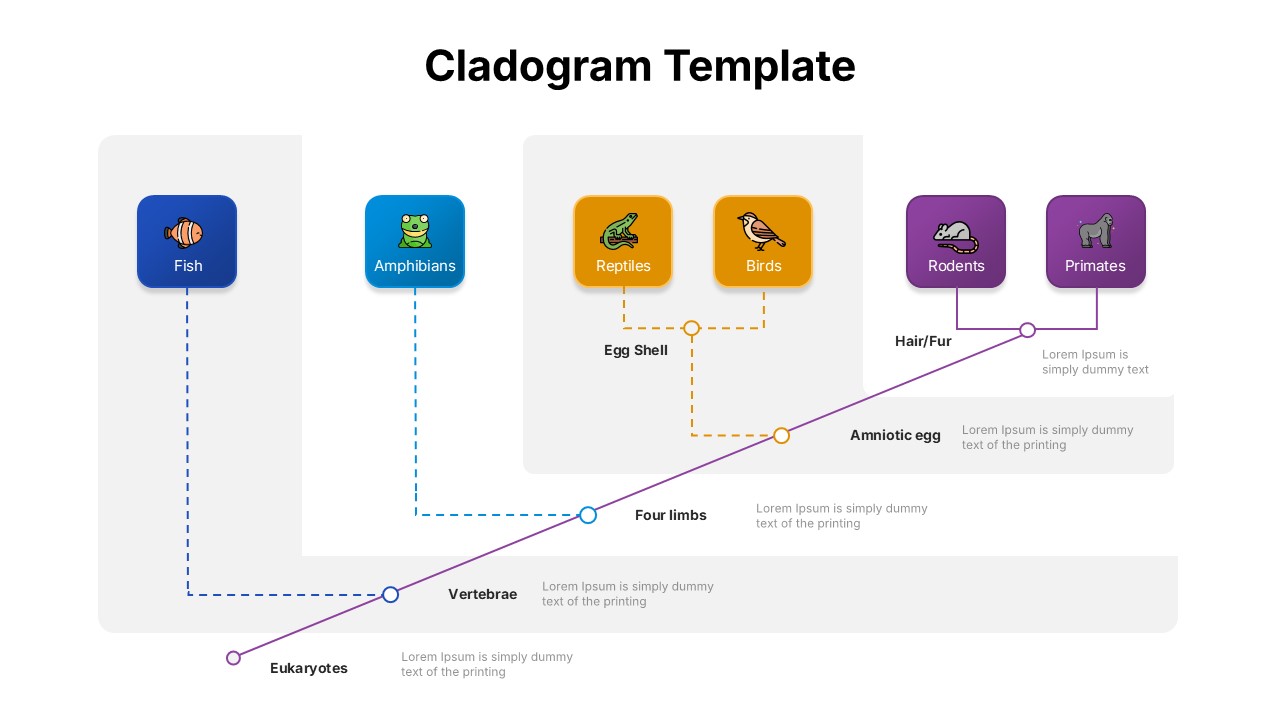
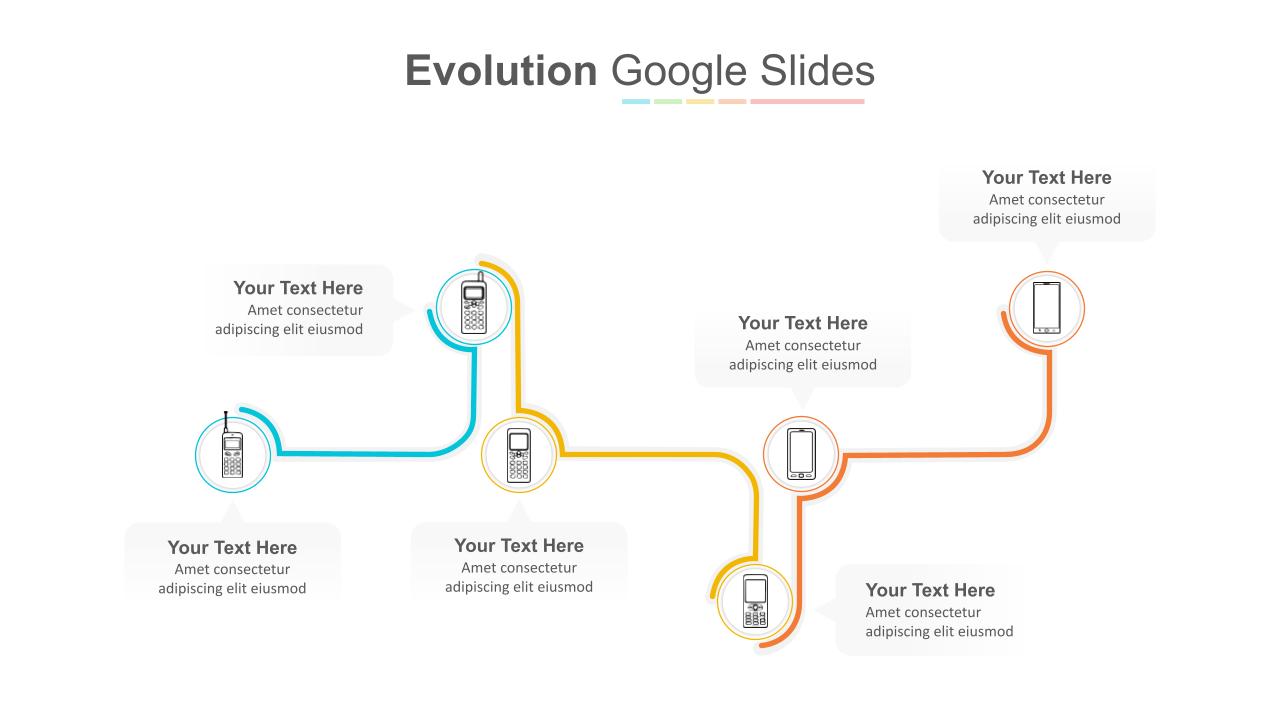
The Cladogram Evolution Diagram Template offers a visually structured way to present evolutionary relationships among organisms, making it an essential tool for educators, researchers, and students. This template features a clean and modern design, using a branching diagram to illustrate how various species—such as fish, amphibians, reptiles, birds, rodents, and primates—evolved from common ancestors.
The design clearly marks key evolutionary traits like vertebrae, four limbs, amniotic eggs, and hair/fur, showcasing how these characteristics define evolutionary branches. The visual clarity of the cladogram makes complex biological data more accessible, making it ideal for explaining phylogenetic relationships in classrooms, academic conferences, or scientific reports.
Each species is represented by a colorful icon and distinct category box, connected through dotted and solid lines that trace evolutionary milestones. This logical flow helps viewers understand not only which species are related, but also the timeline and significance of biological traits that led to their divergence.
Compatible with both PowerPoint and Google Slides, the template is fully editable—allowing customization of text, colors, and content to suit your presentation needs. Whether you’re illustrating Darwinian evolution, exploring vertebrate lineage, or creating a visual reference for biological research, this template brings clarity and professionalism to your work.
See more

Aspect Ratio
16:9Item ID
SKT04285
Features of this template
Other User Cases of the Template:
Biology class presentations, Evolutionary lineage mapping, Academic research visuals, Phylogenetic tree explanations, Scientific poster sessions, Educational infographics, University lectures, Natural history museum exhibits, Biodiversity seminars, Zoology or genetics coursework.
FAQs
You May Also Like These Presentation Templates

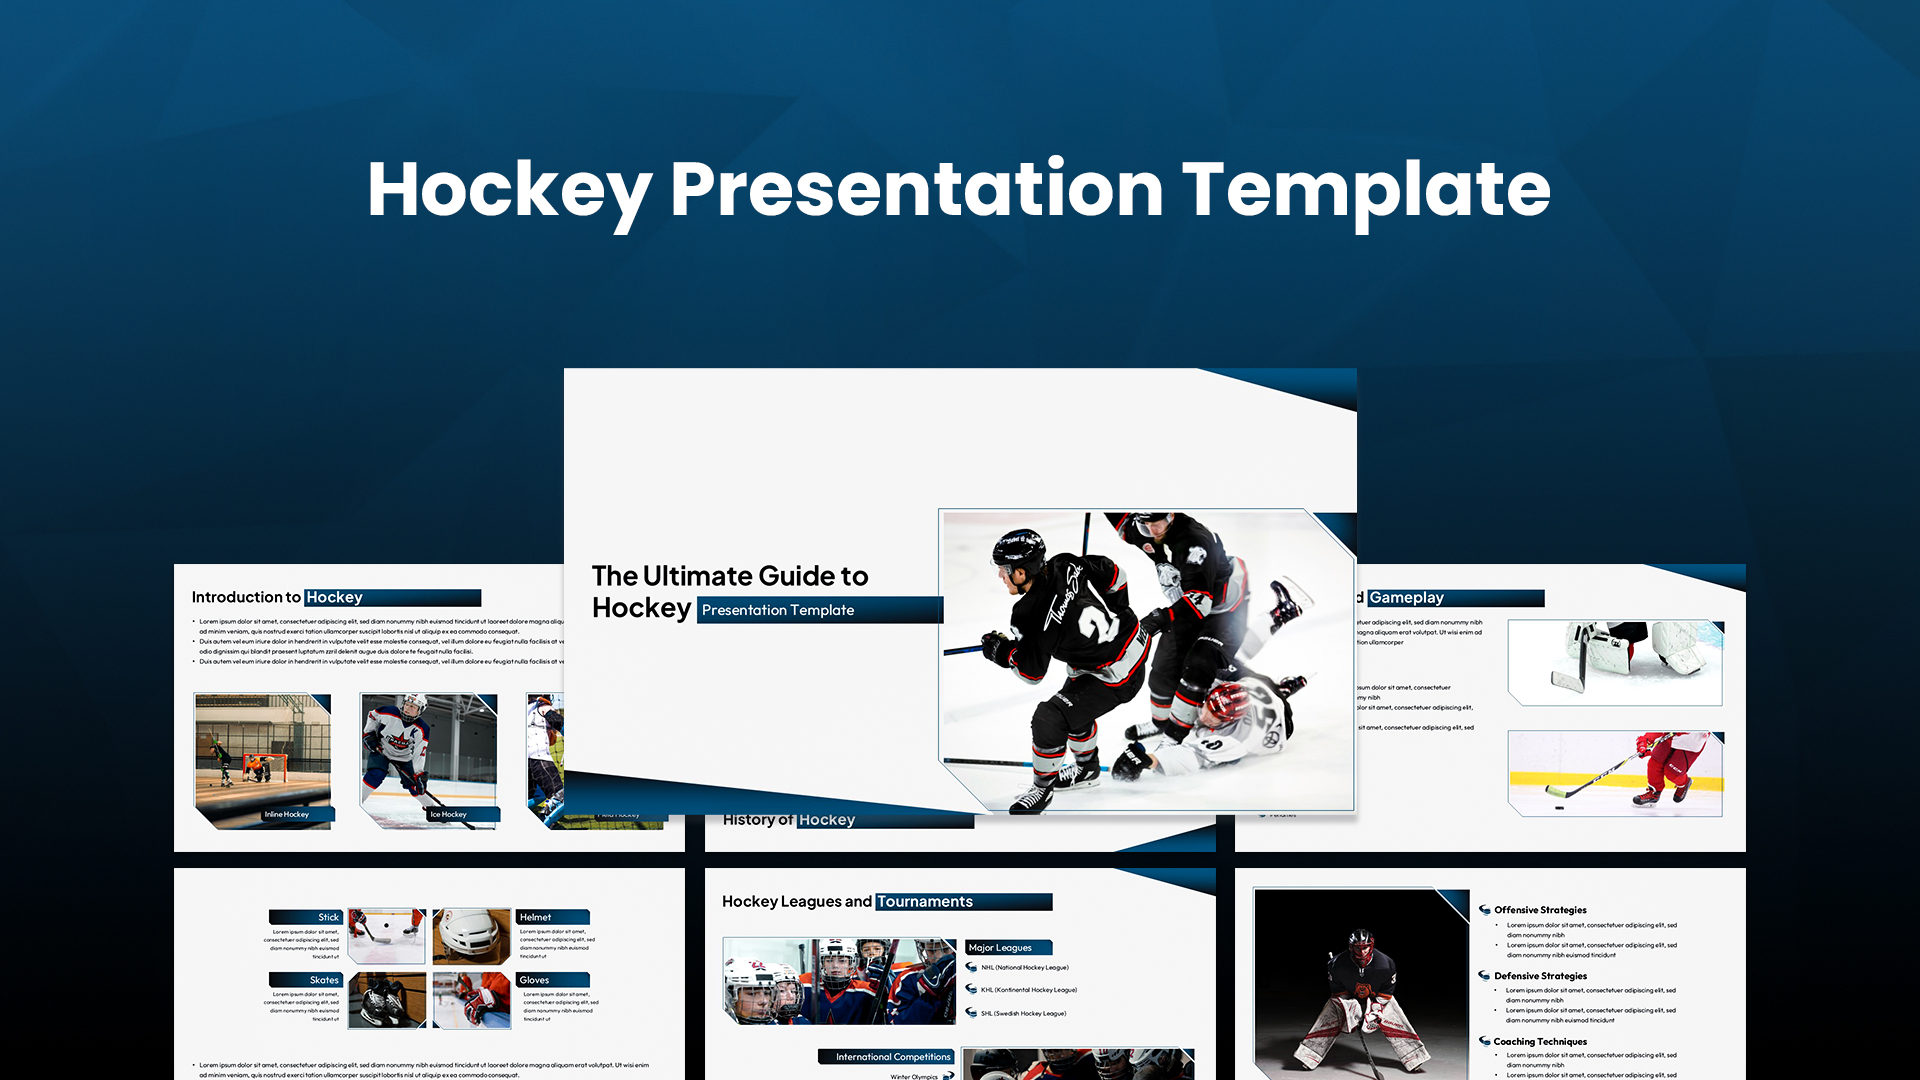
- Free

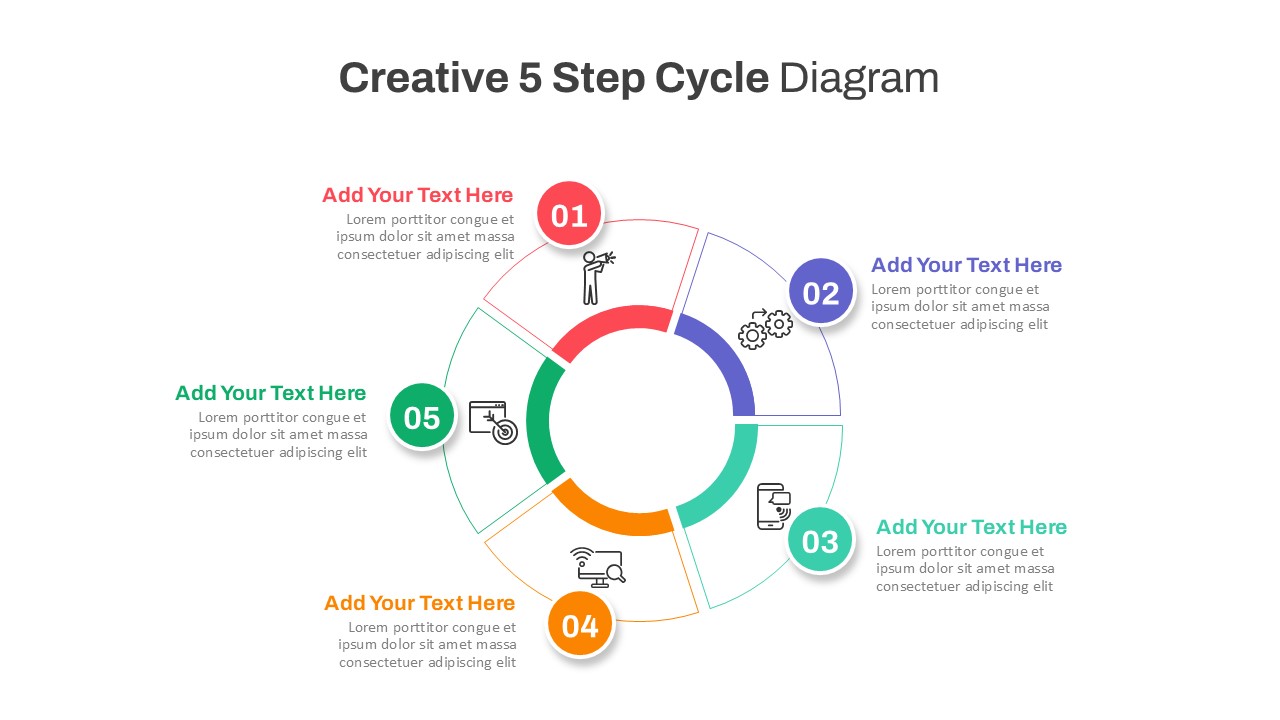
- Free
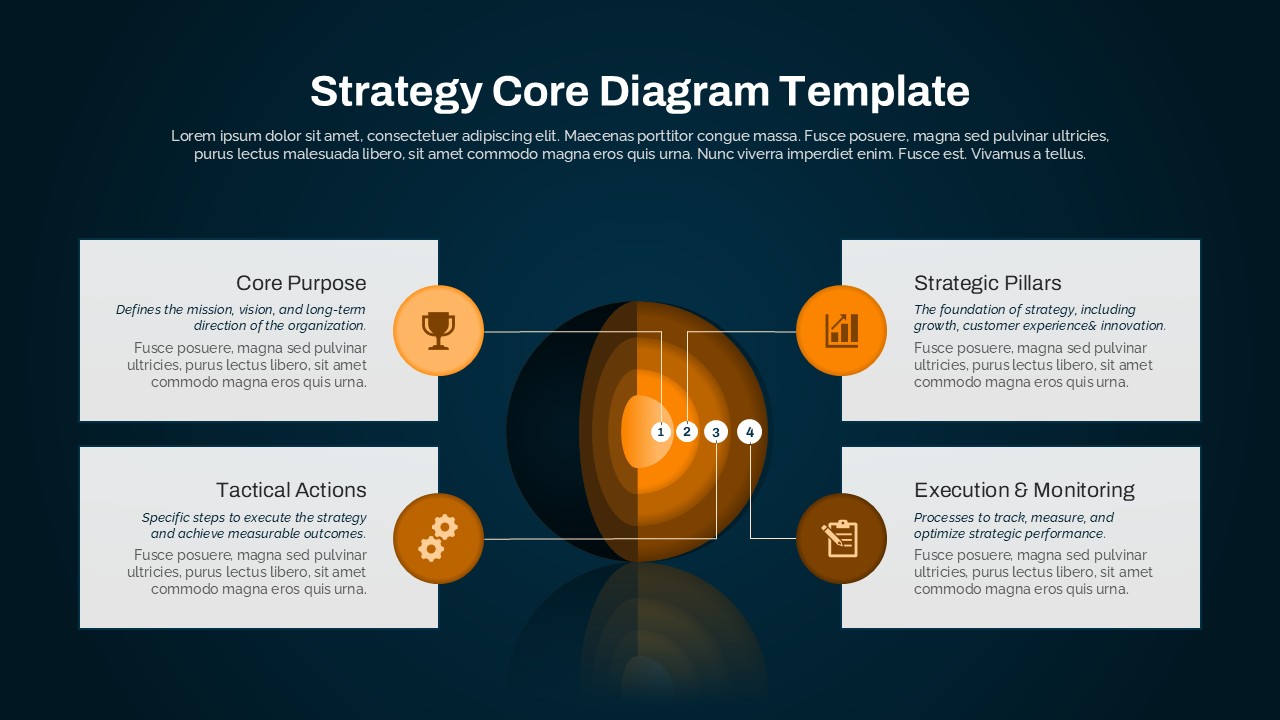
- Free
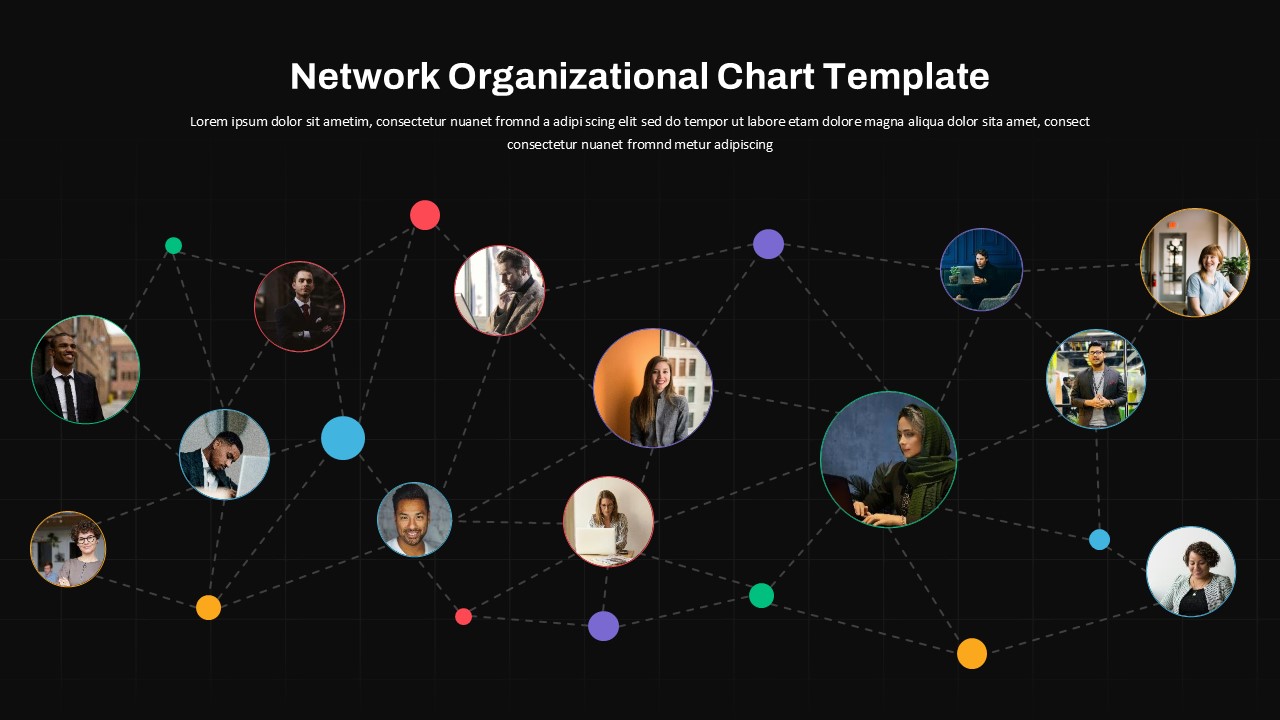
- Free

- Free
- Free
- Free
- Free
- Free
- Free
- Free
- Free
- Free
- Free
- Free
- Free
- Free
- Free
- Free
- Free
- Free