Business Sales Comparison PowerPoint & Google Slides Template
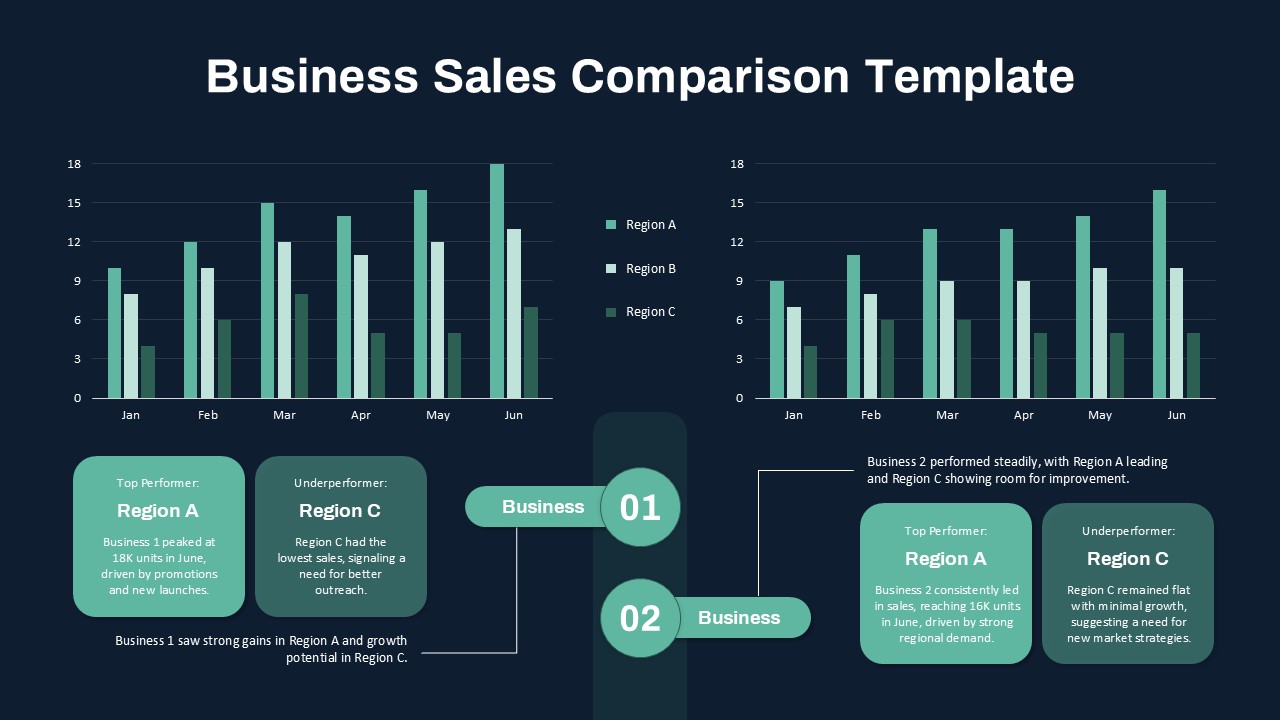
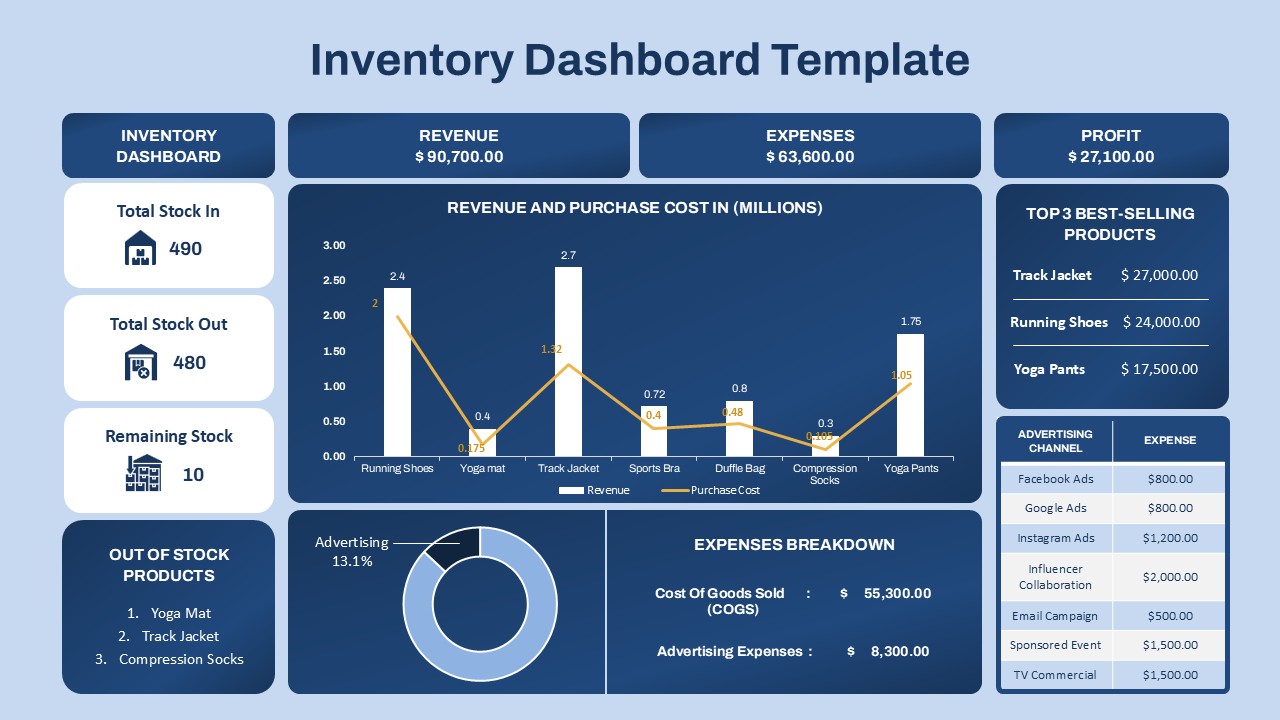
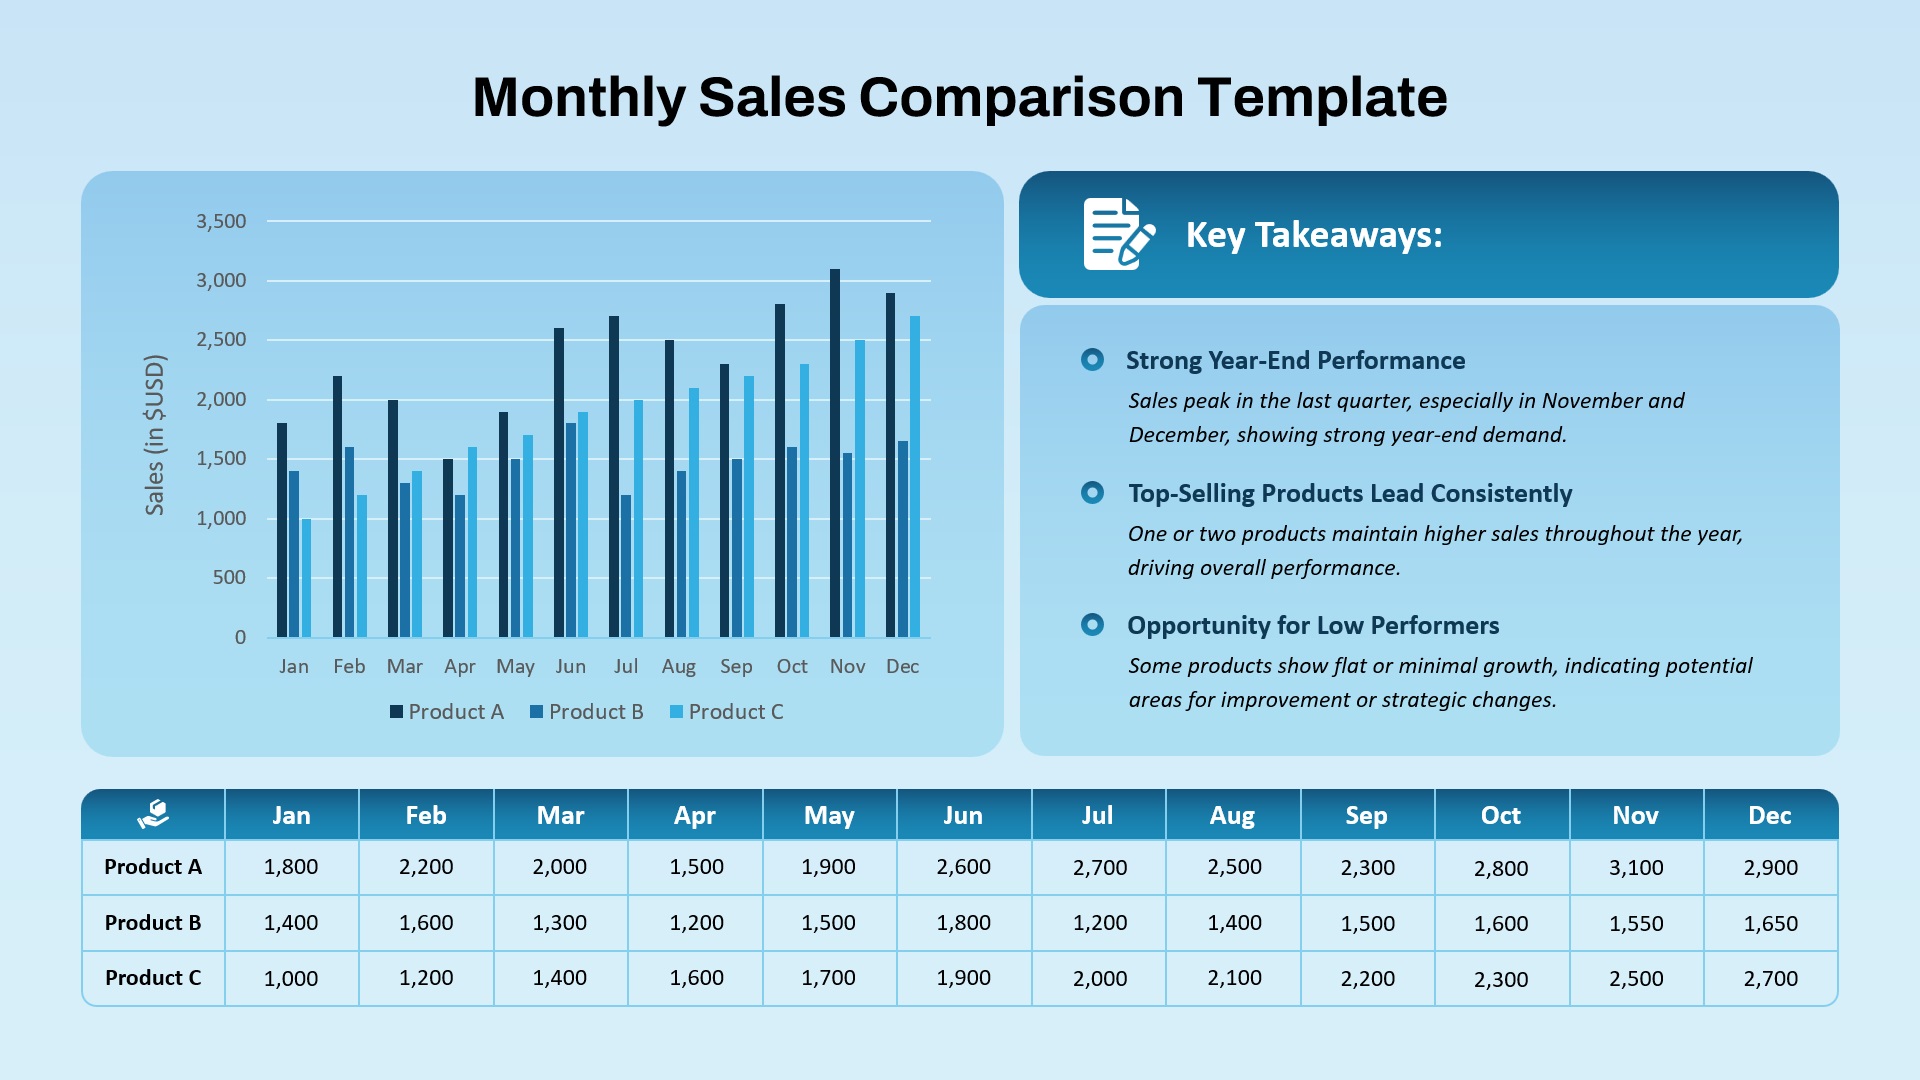
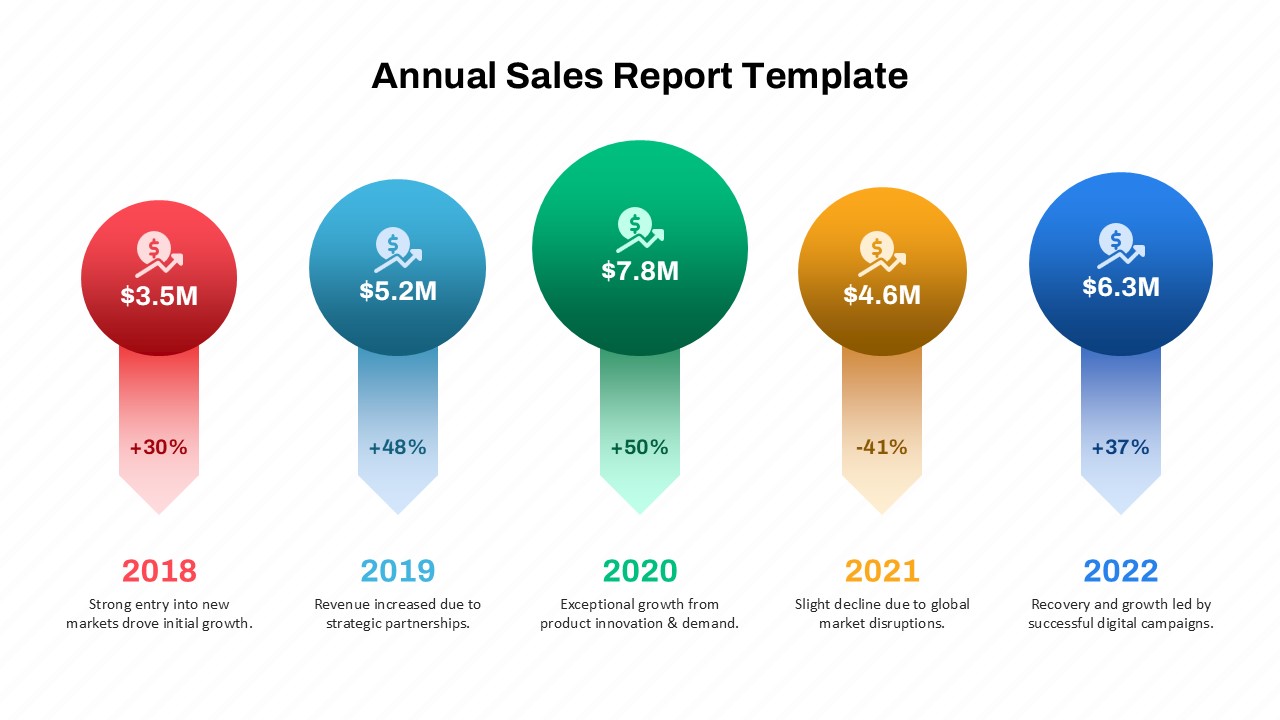
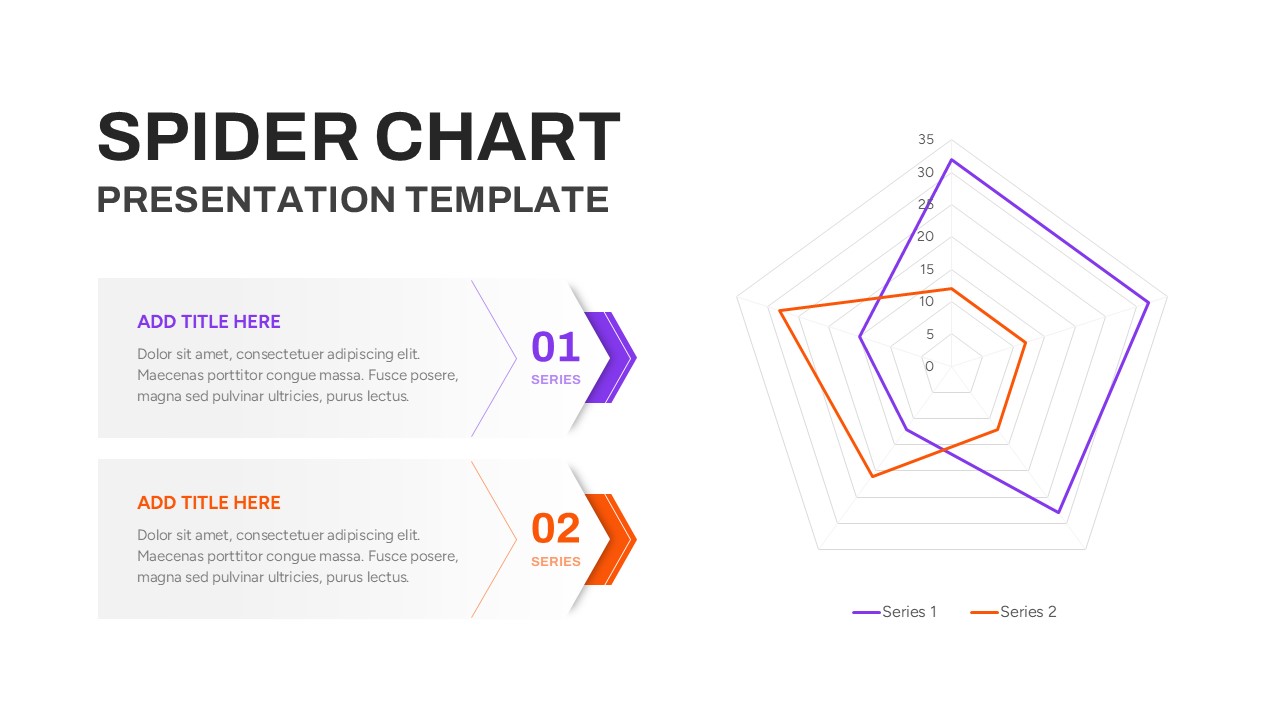
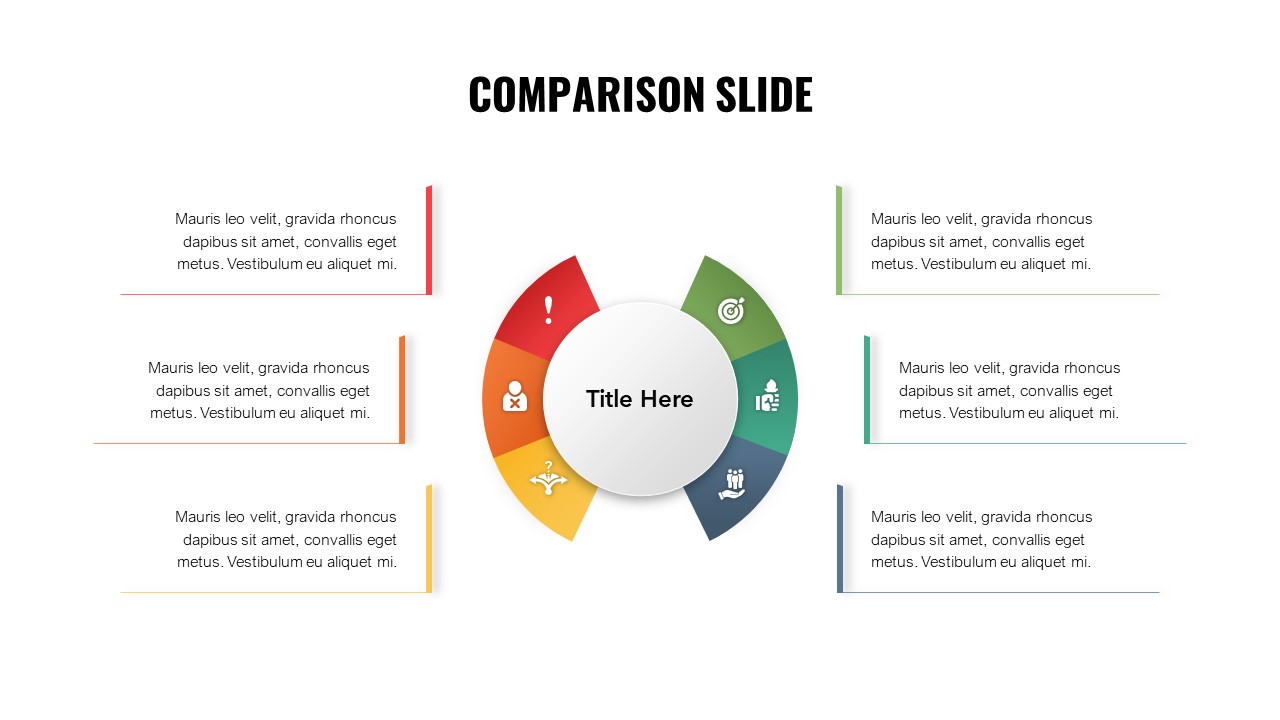
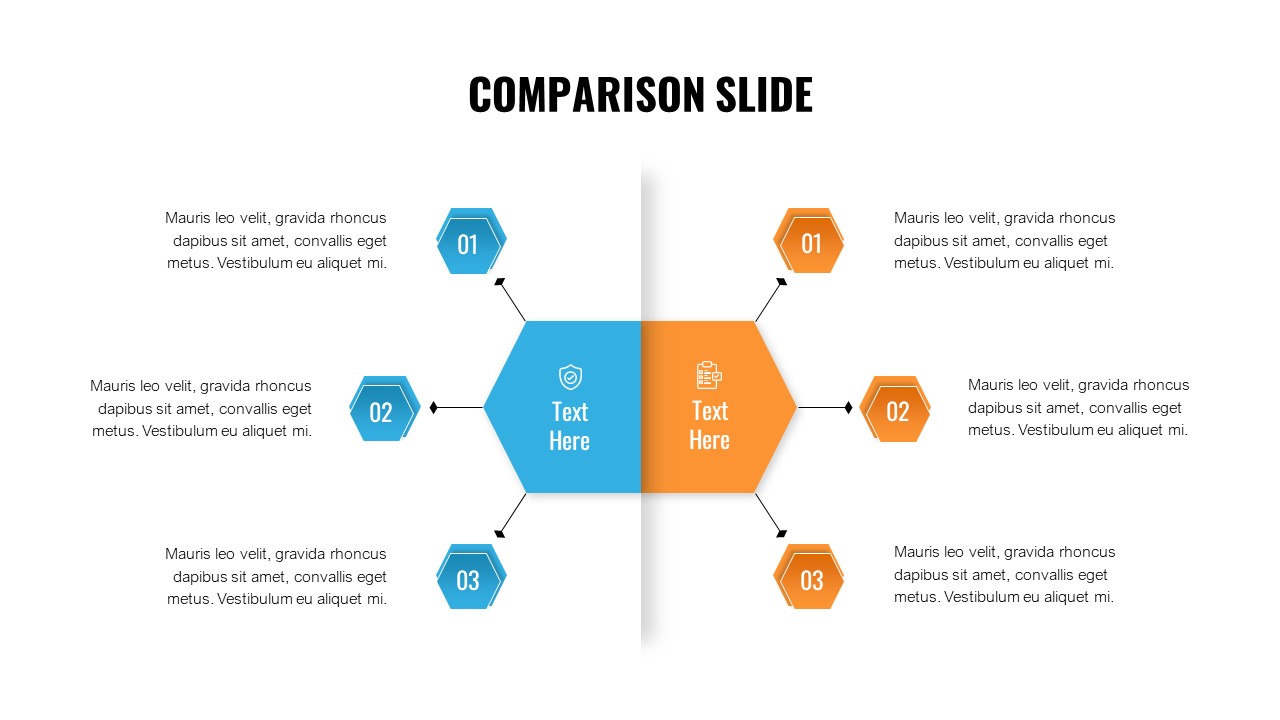
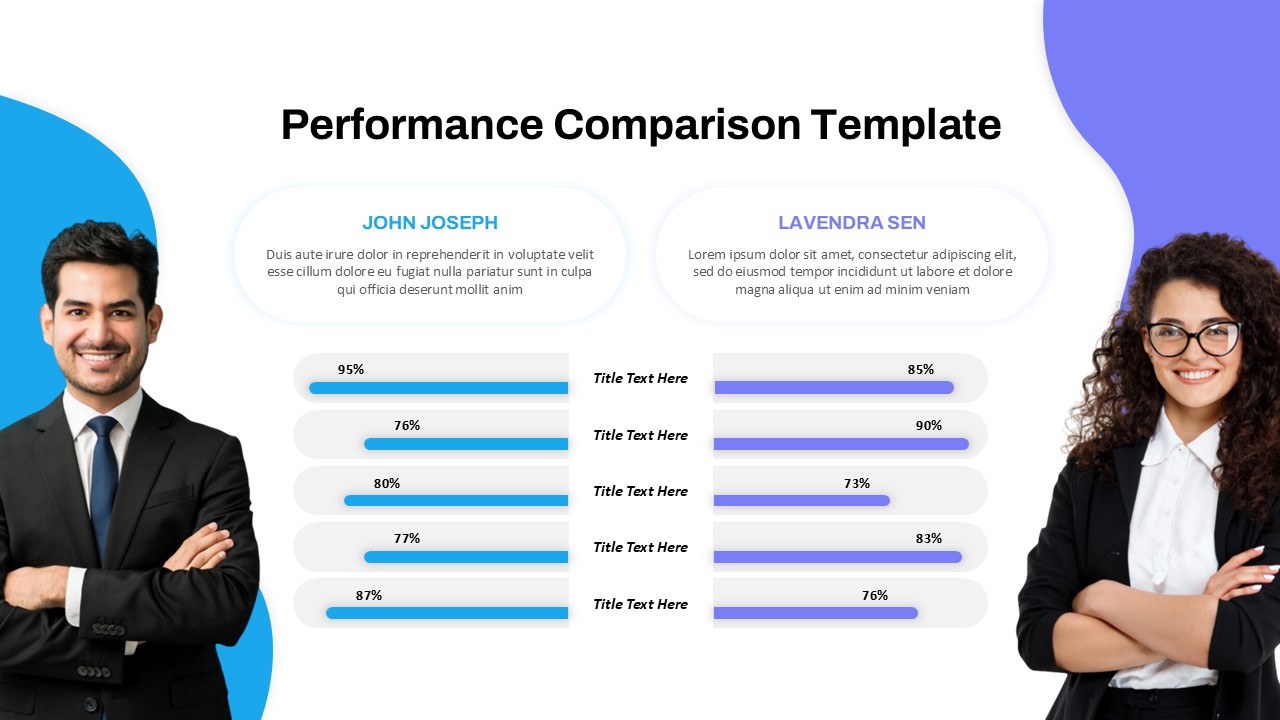
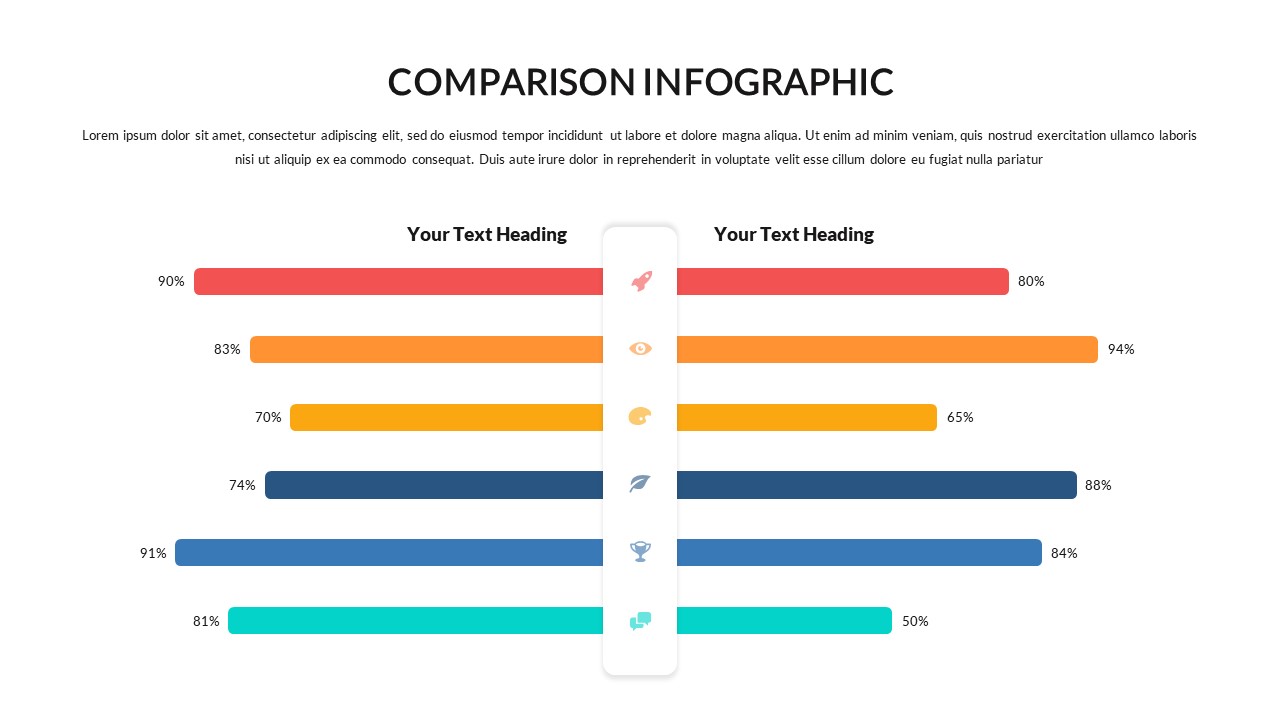
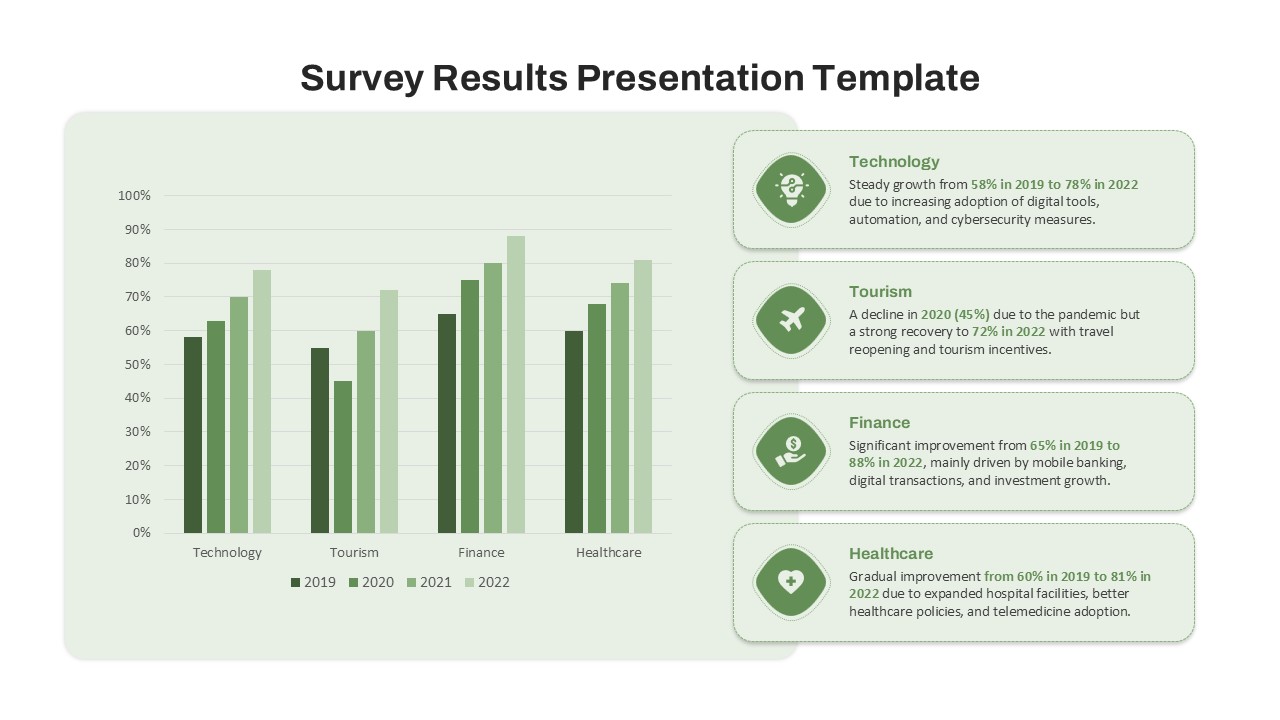
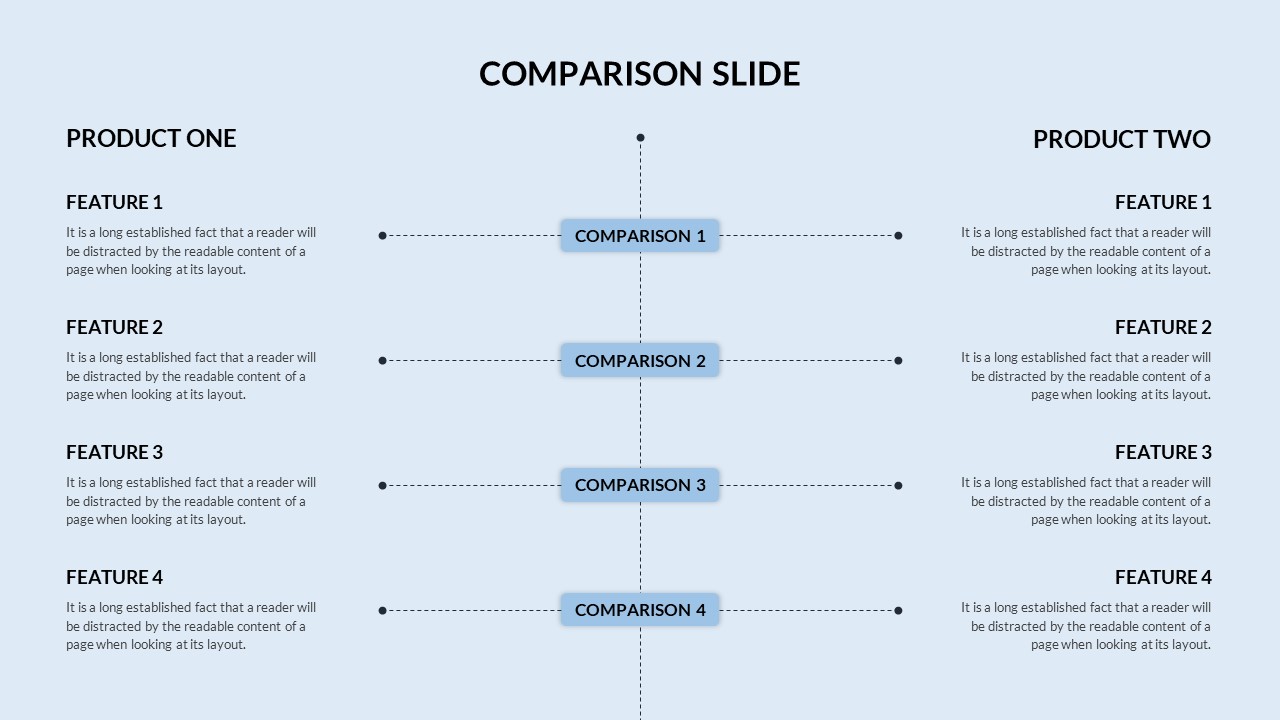
The business sales power point comparison slide is a powerful and visually appealing tool designed to present and analyze sales performance across multiple regions or business units. Available in both PowerPoint and Google Slides, this template features comparative bar graphs and insightful commentary to showcase monthly sales figures and business performance trends.
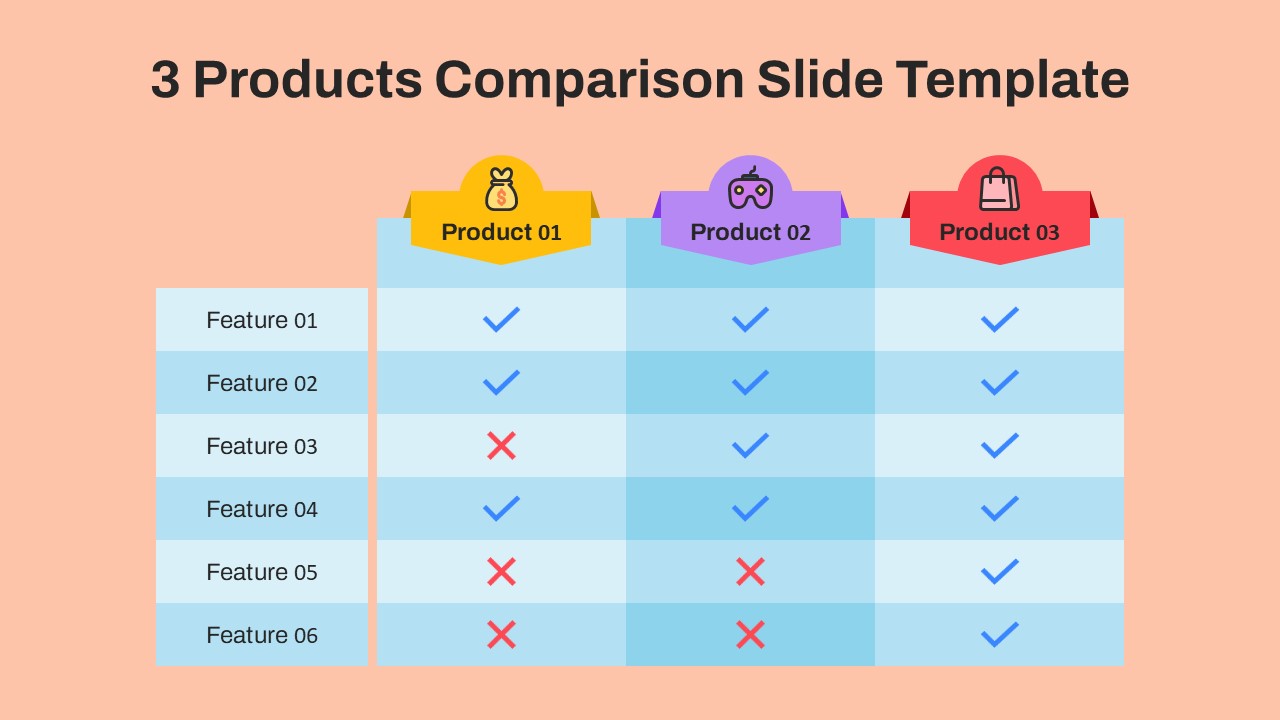
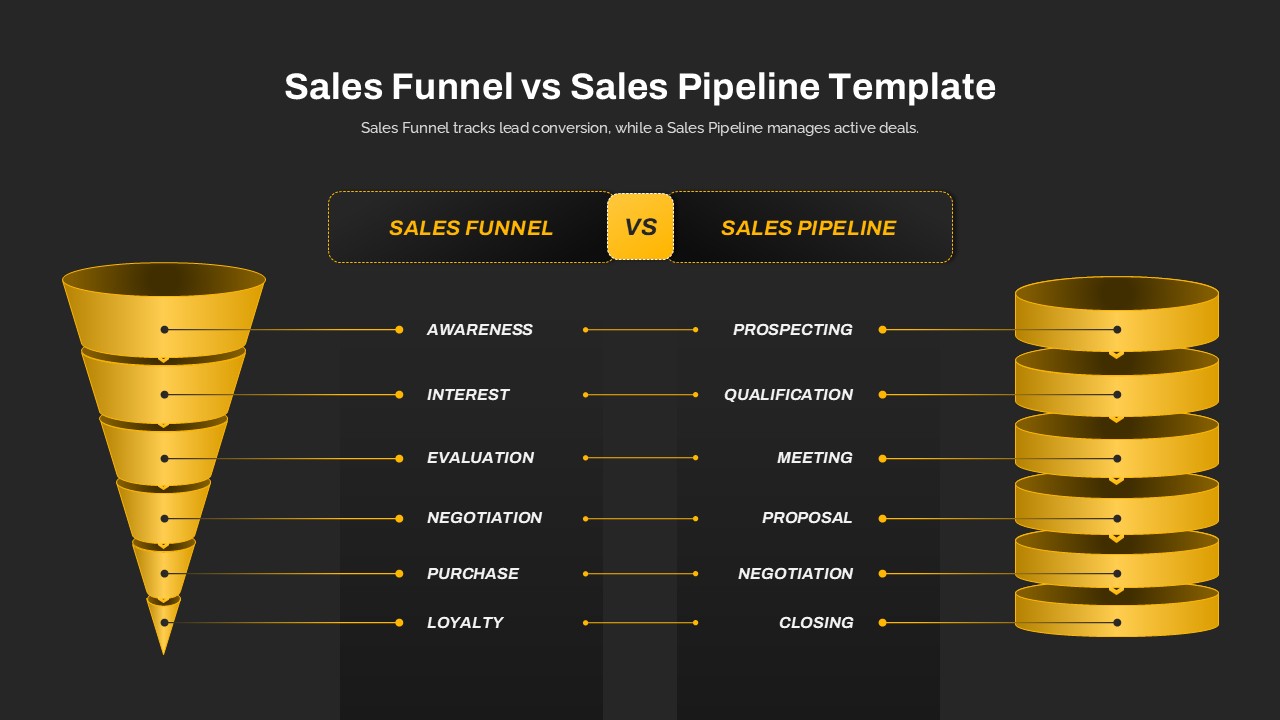
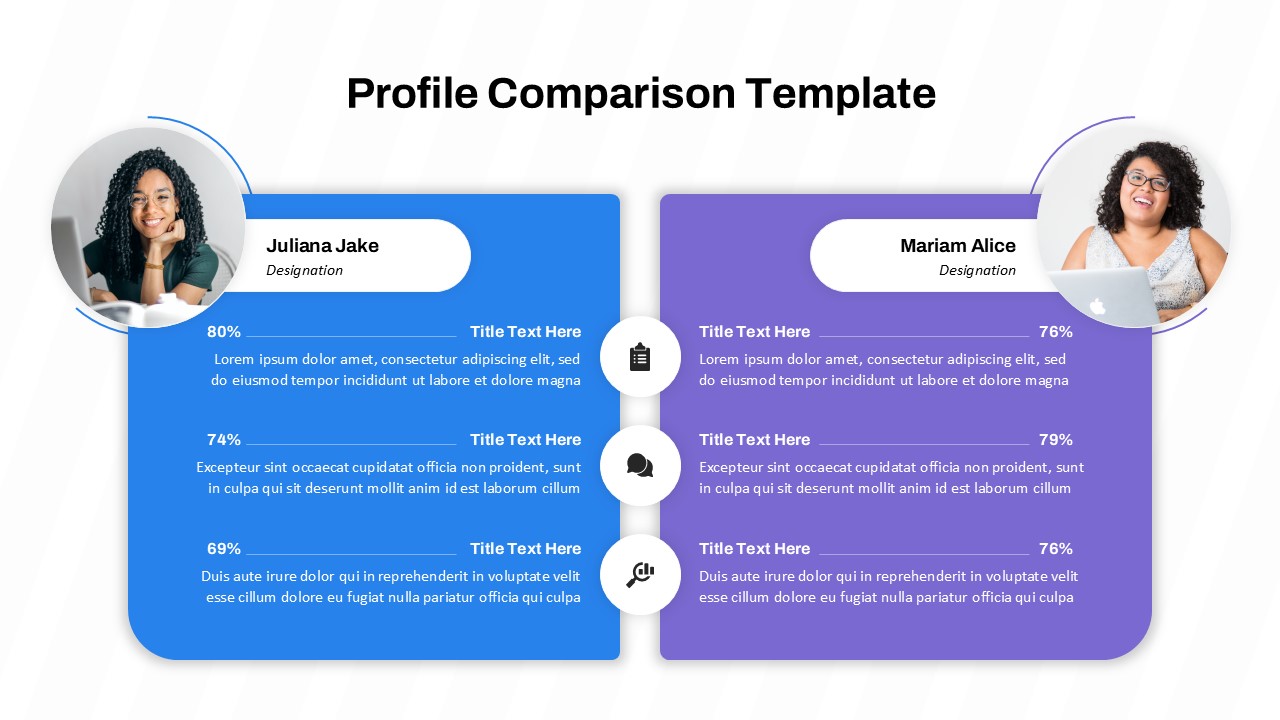
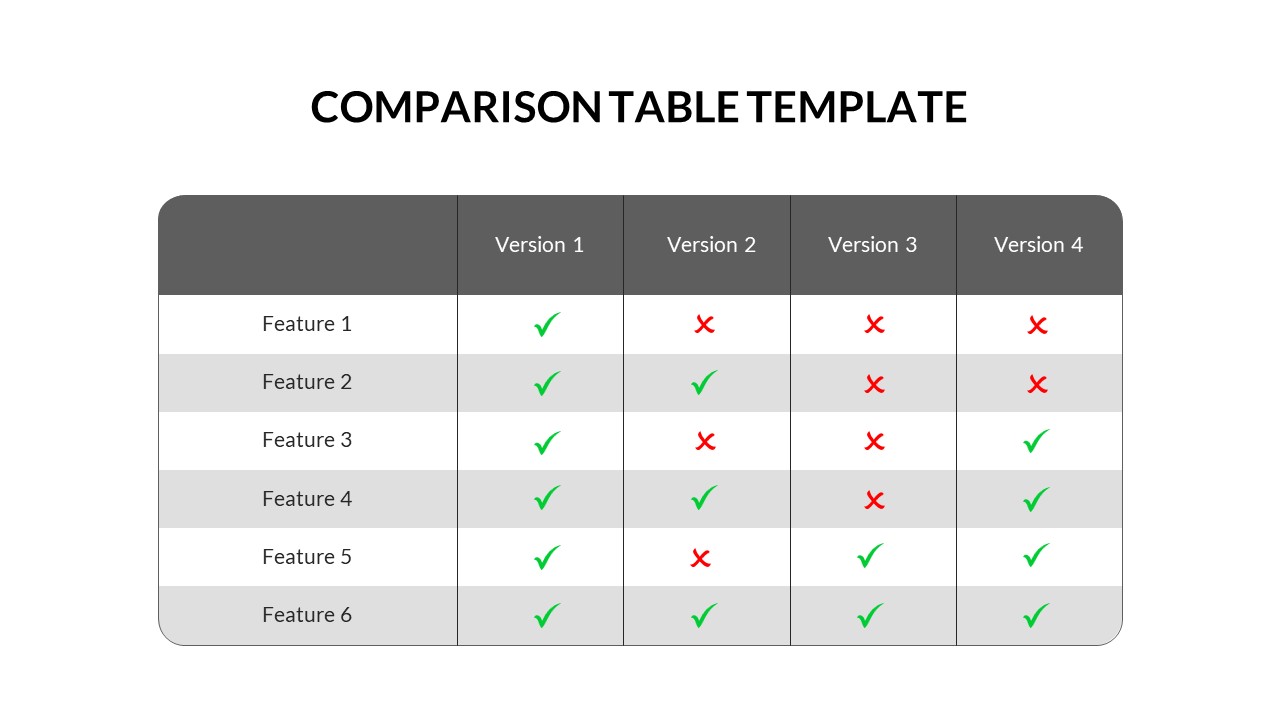
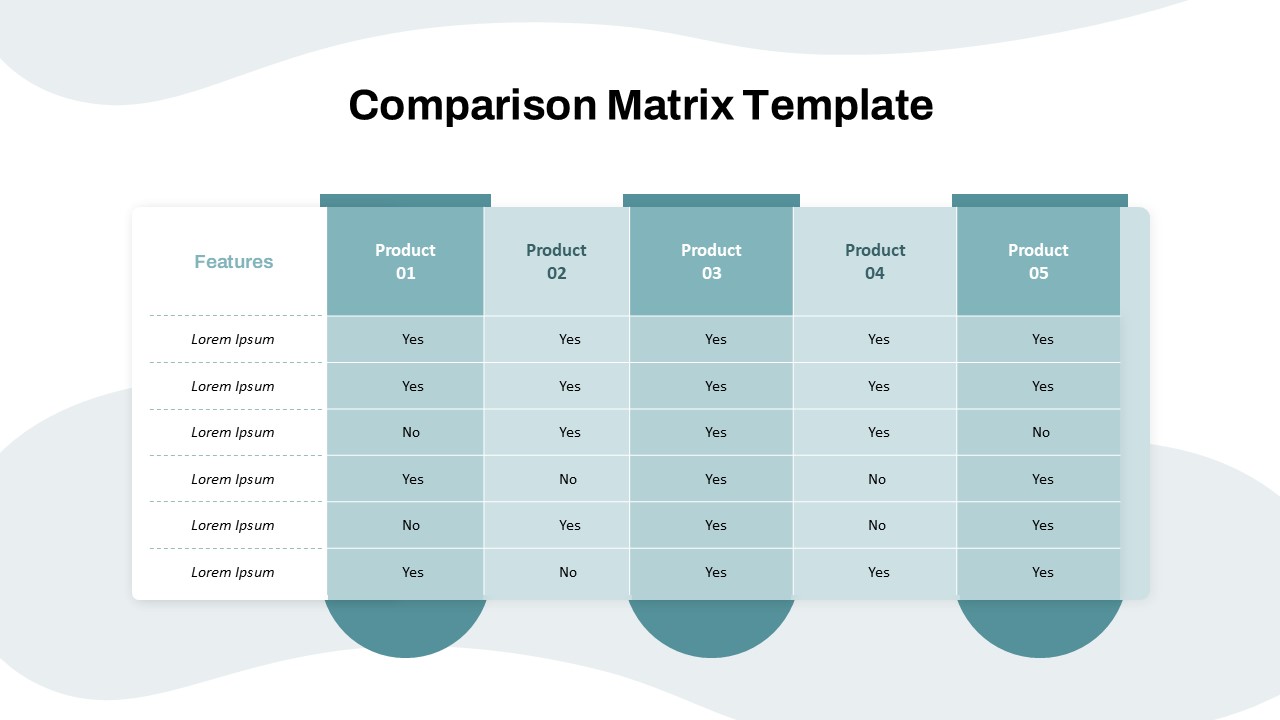
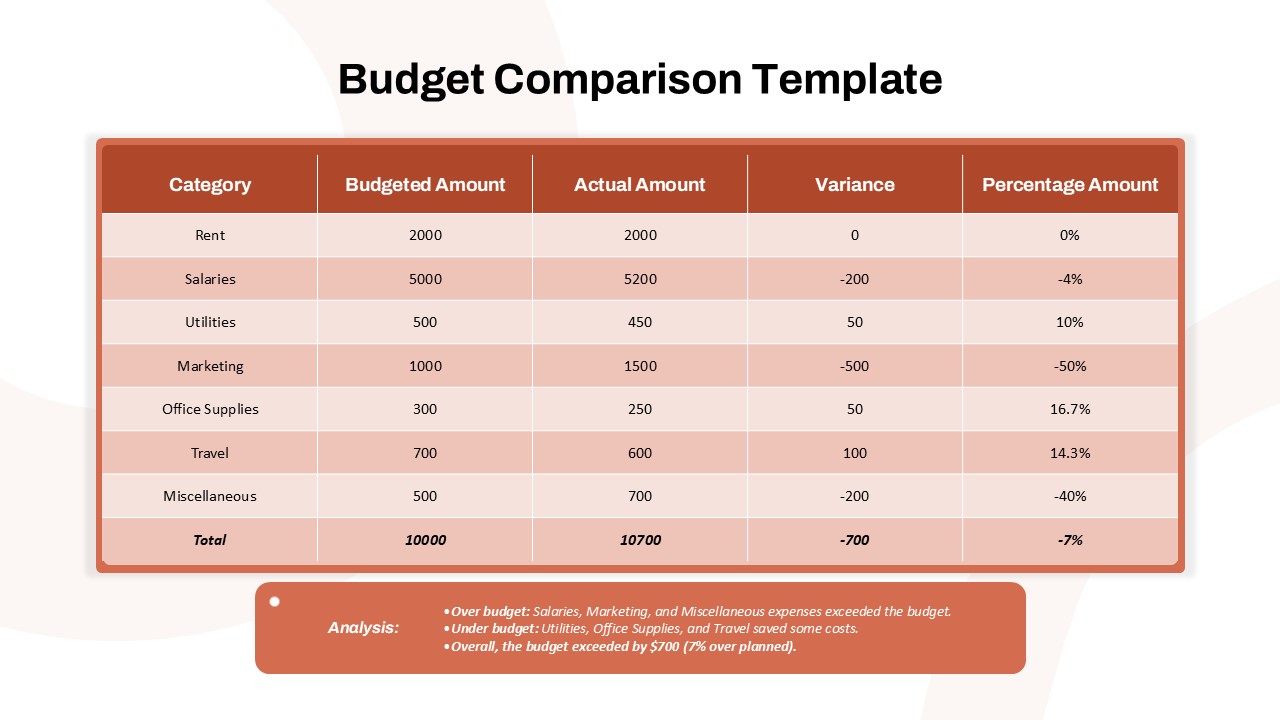
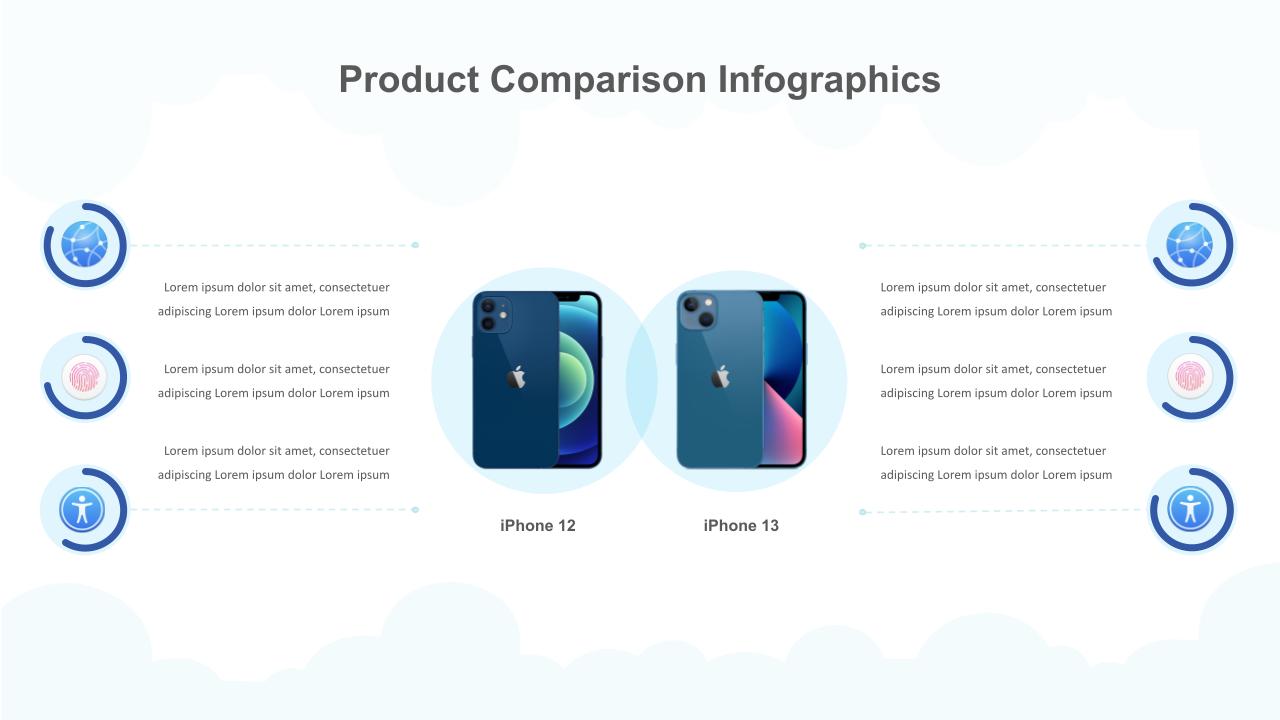
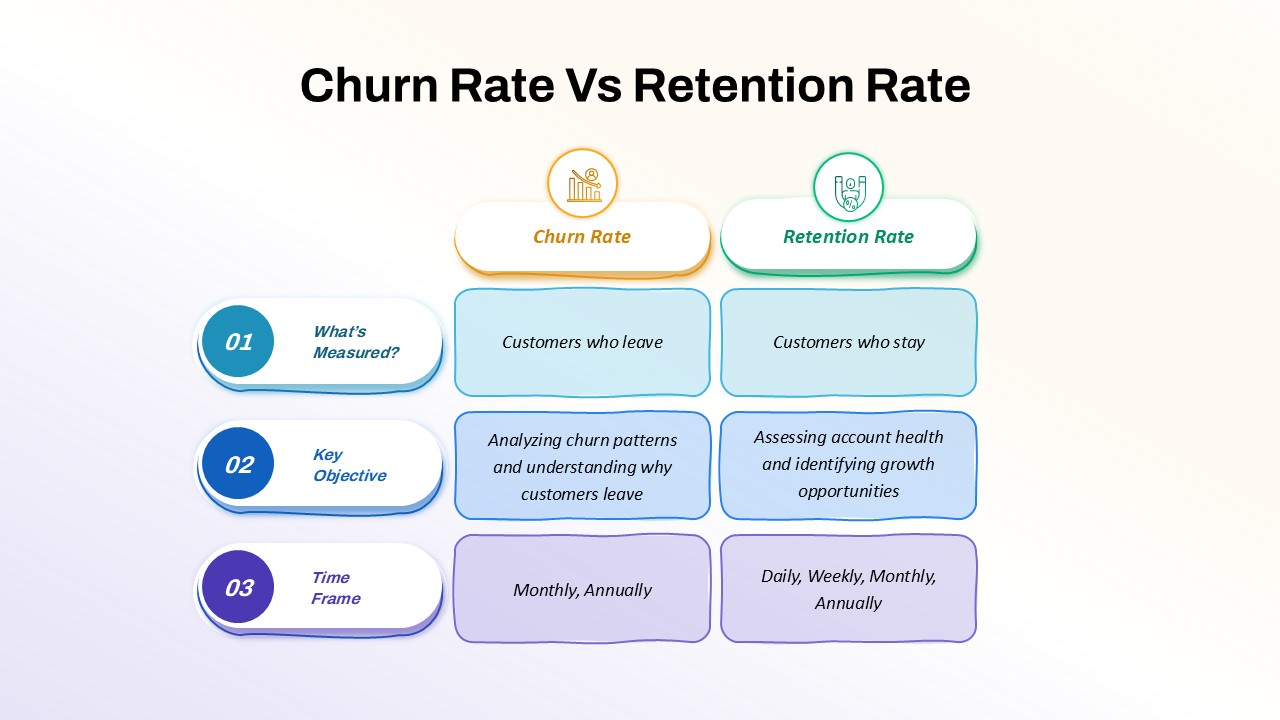
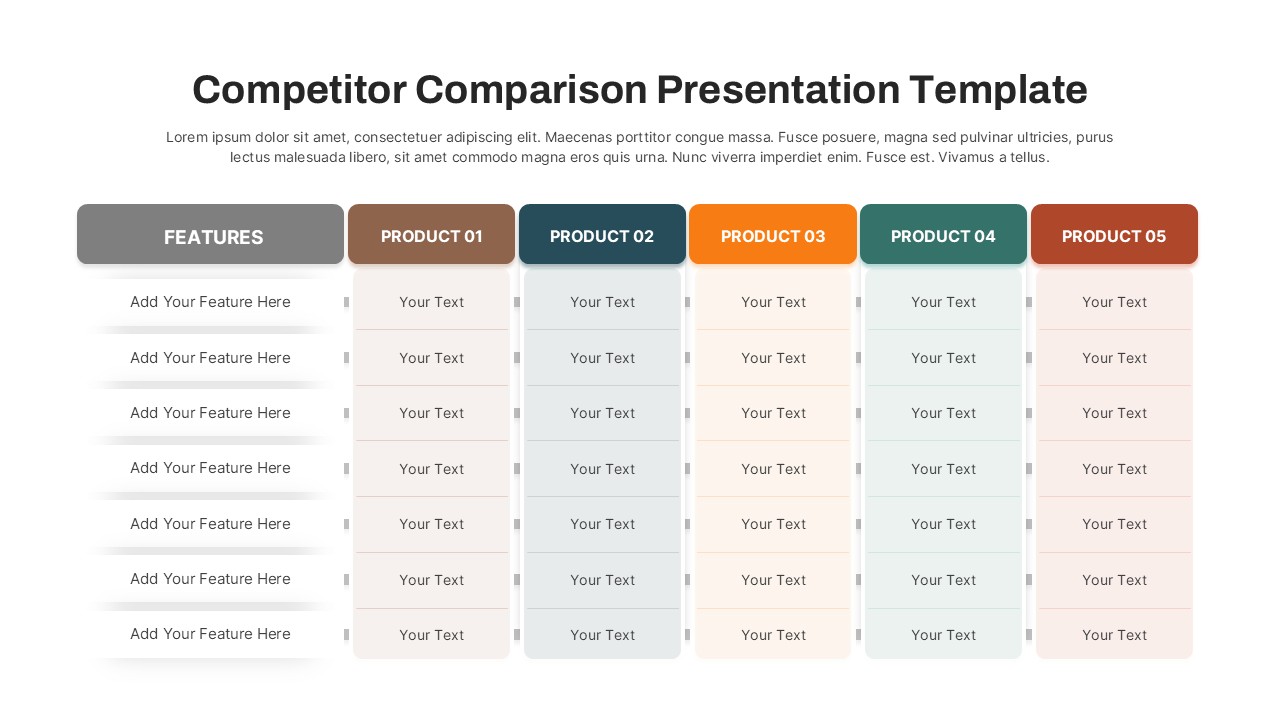
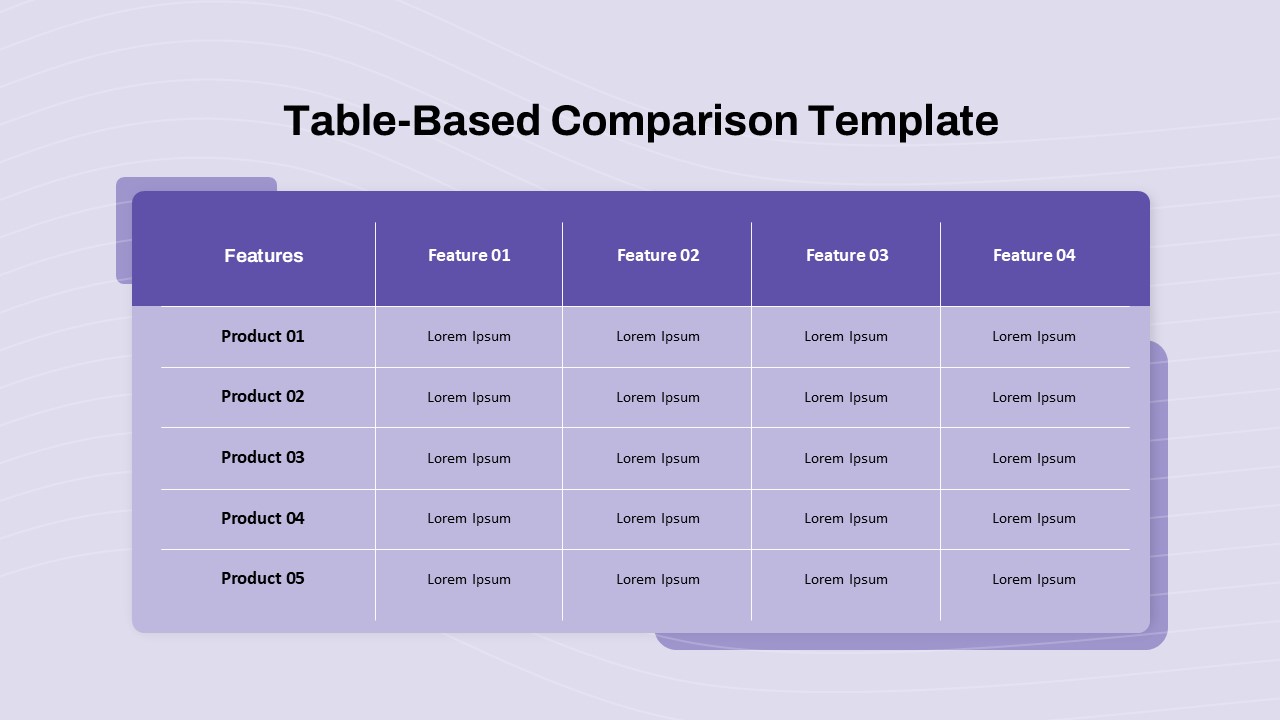
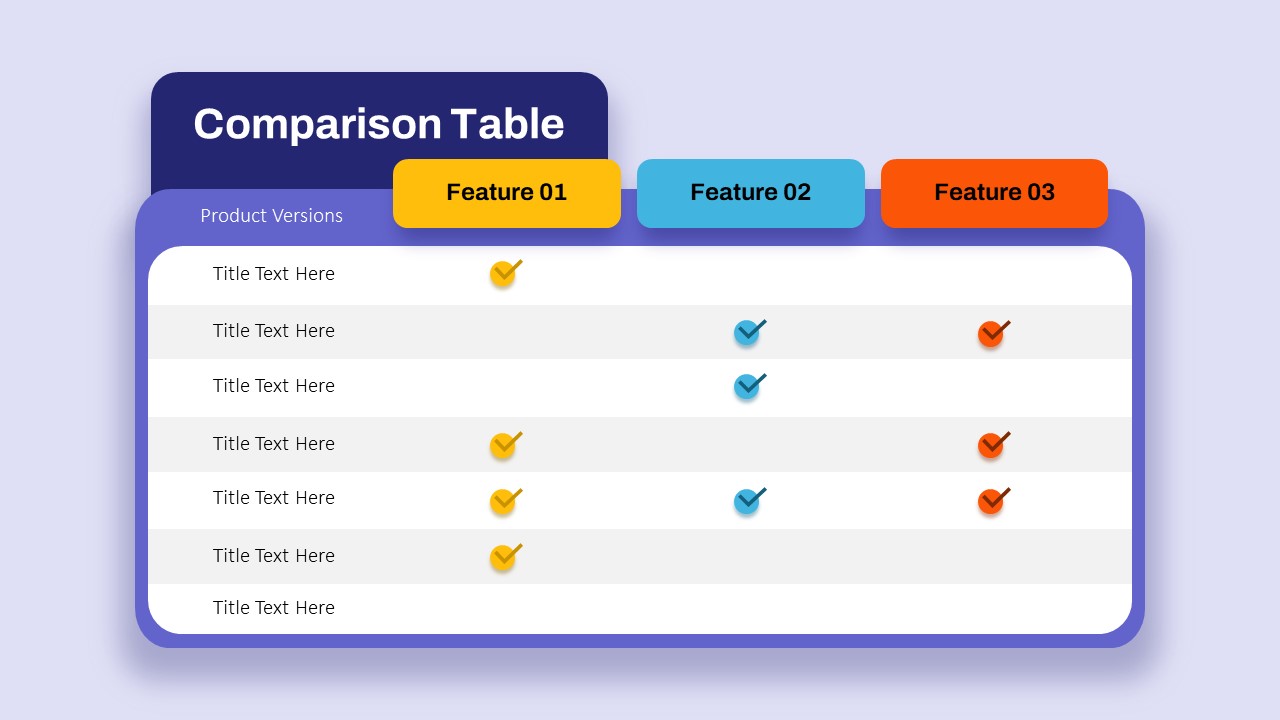
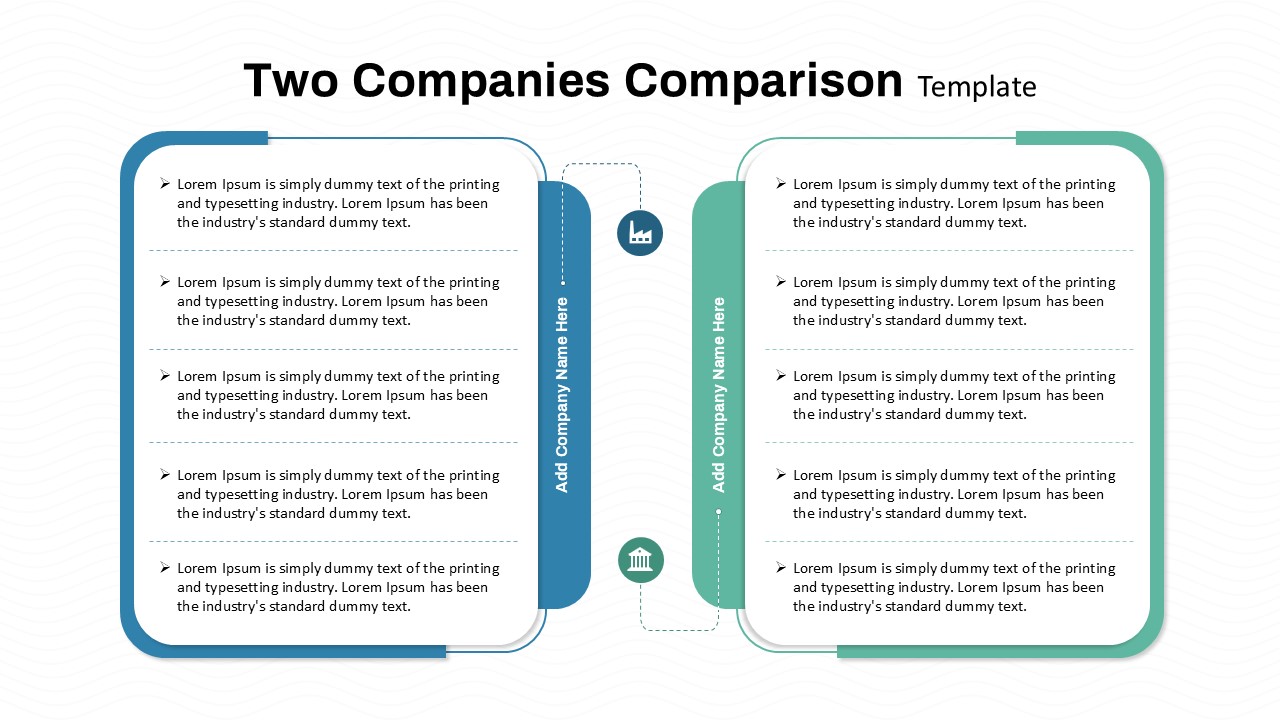
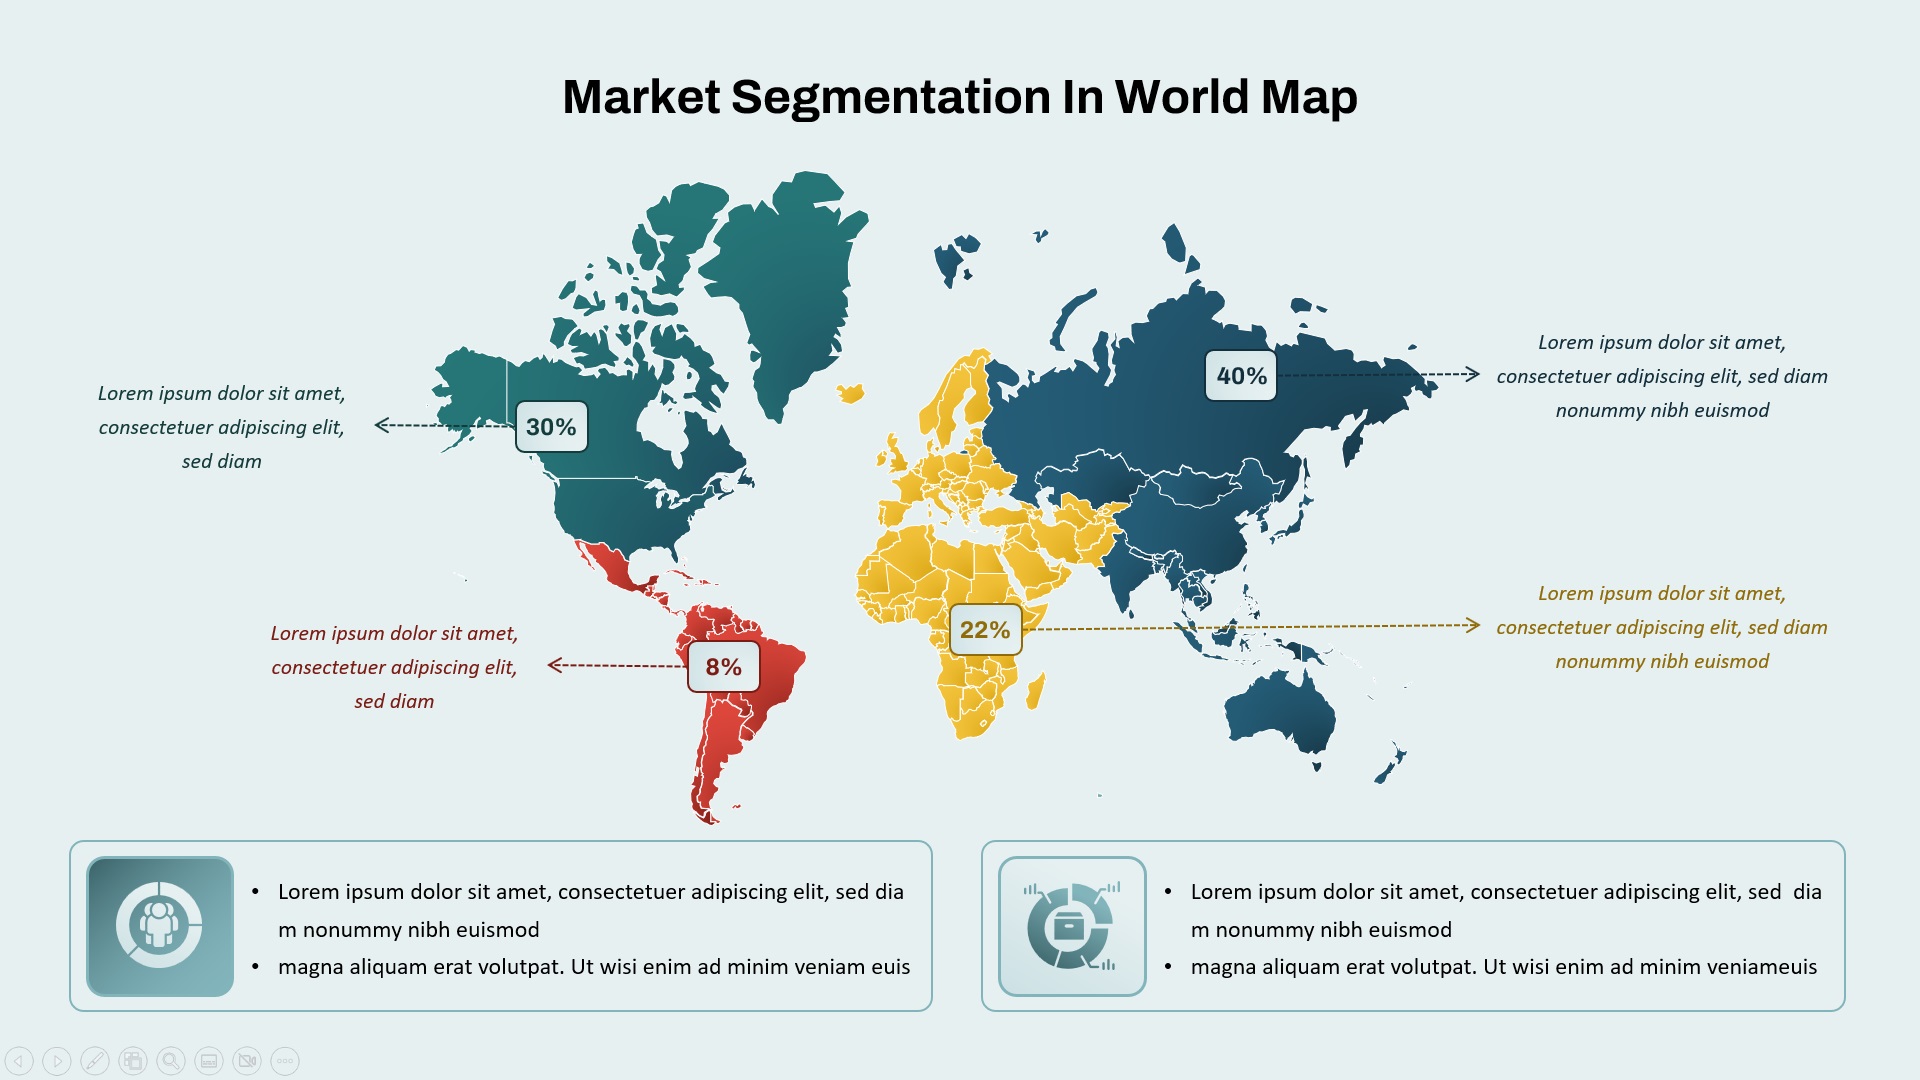
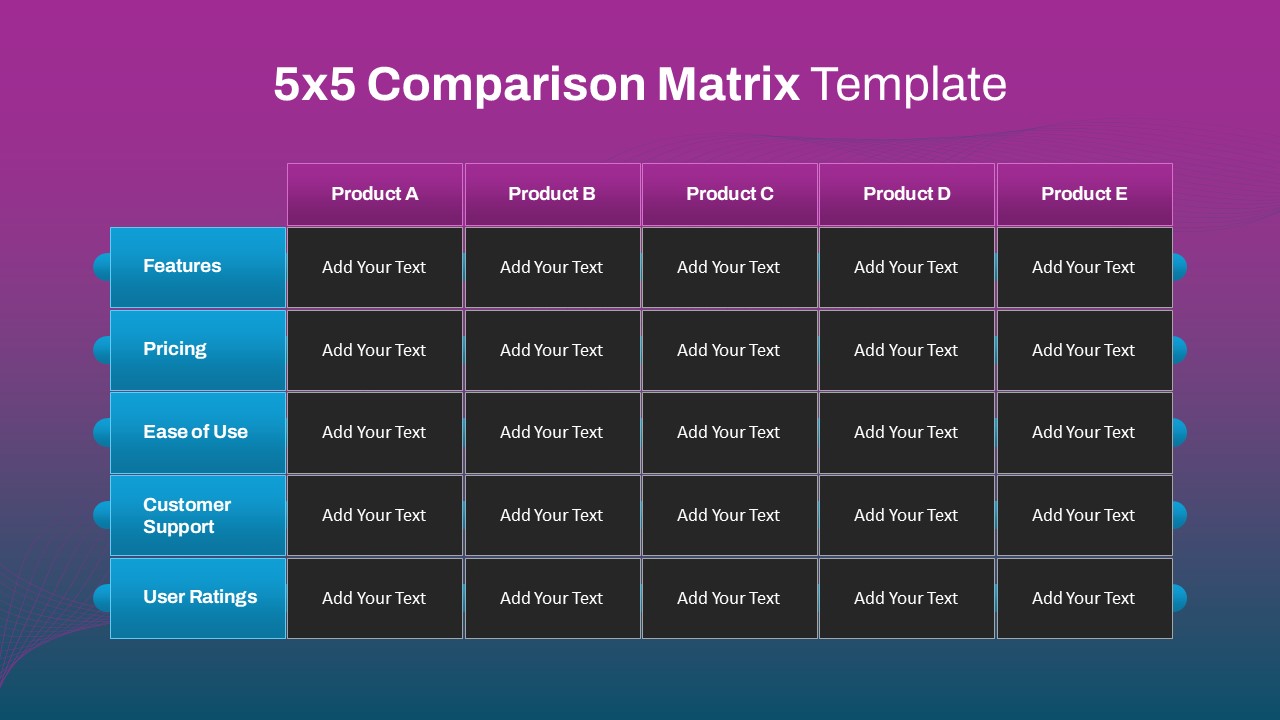
This template serves as an excellent comparison PowerPoint slide, perfect for businesses comparing sales data over time or between regions. It allows users to present key observations such as the Top Performer and Underperformer regions, providing a clear breakdown of strengths and areas for improvement. The comparison chart PowerPoint allows for easy visualization of sales trends and performance gaps, helping teams and executives understand data at a glance.
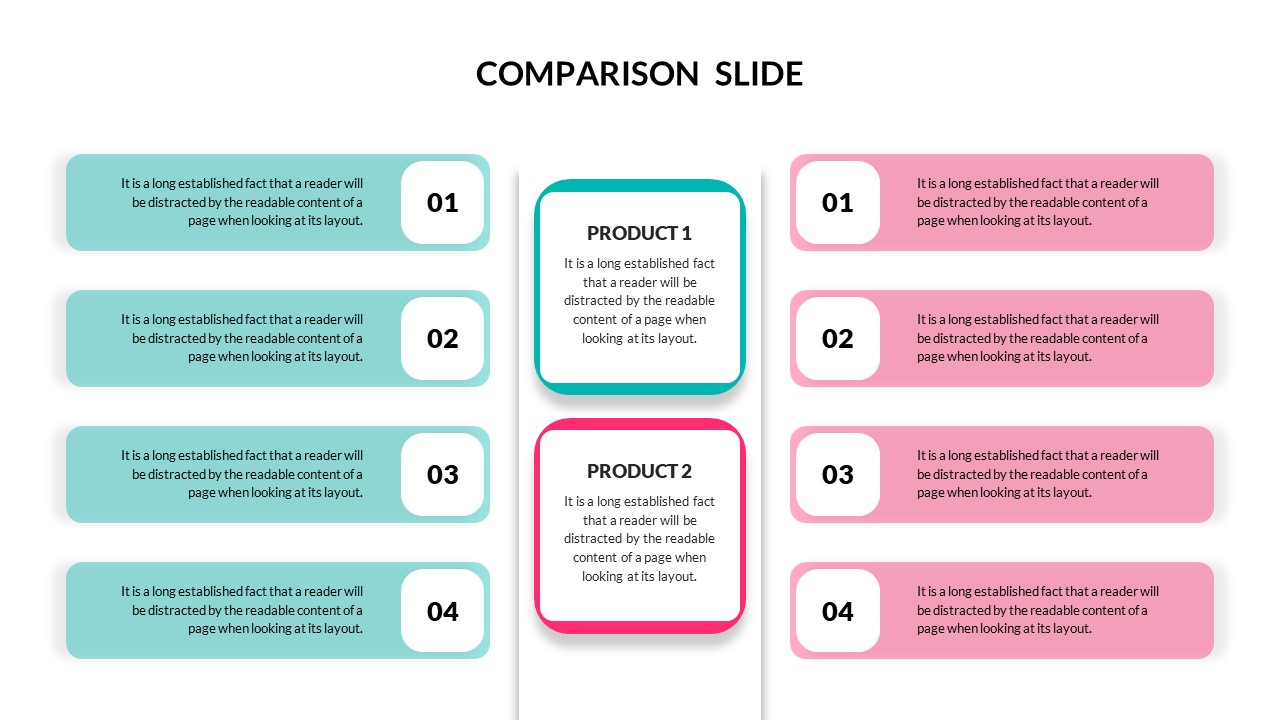
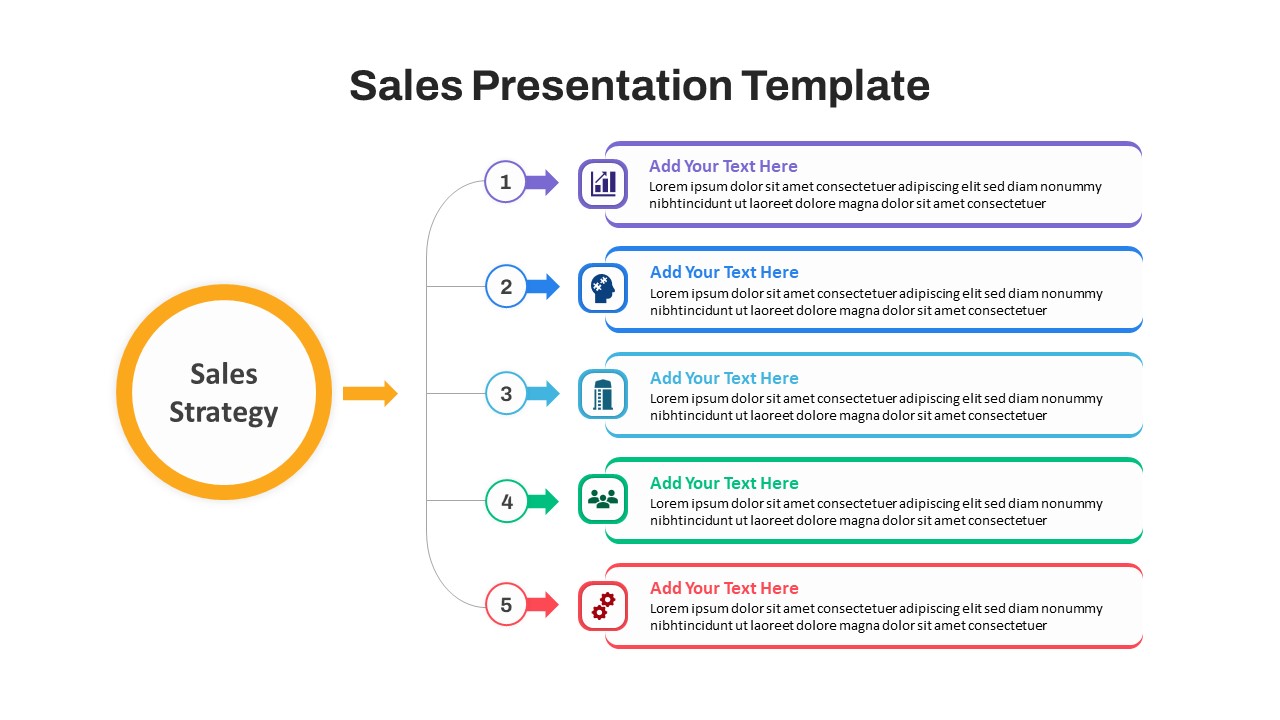
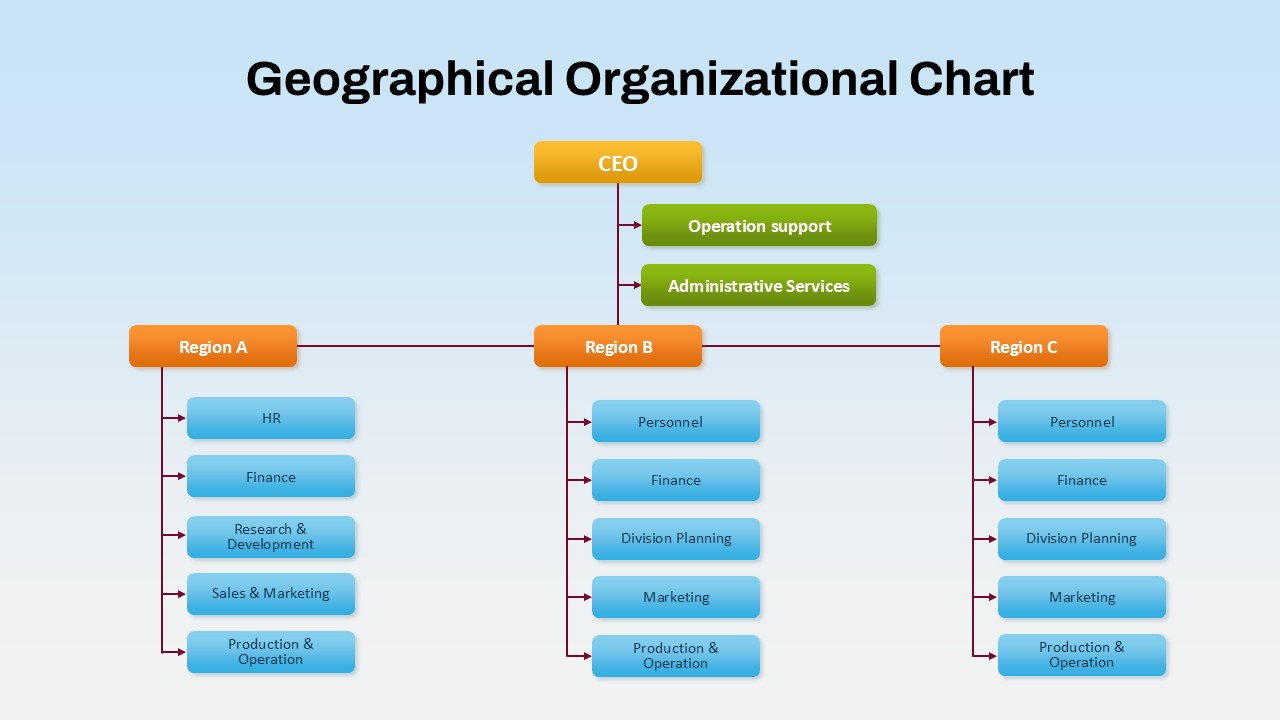
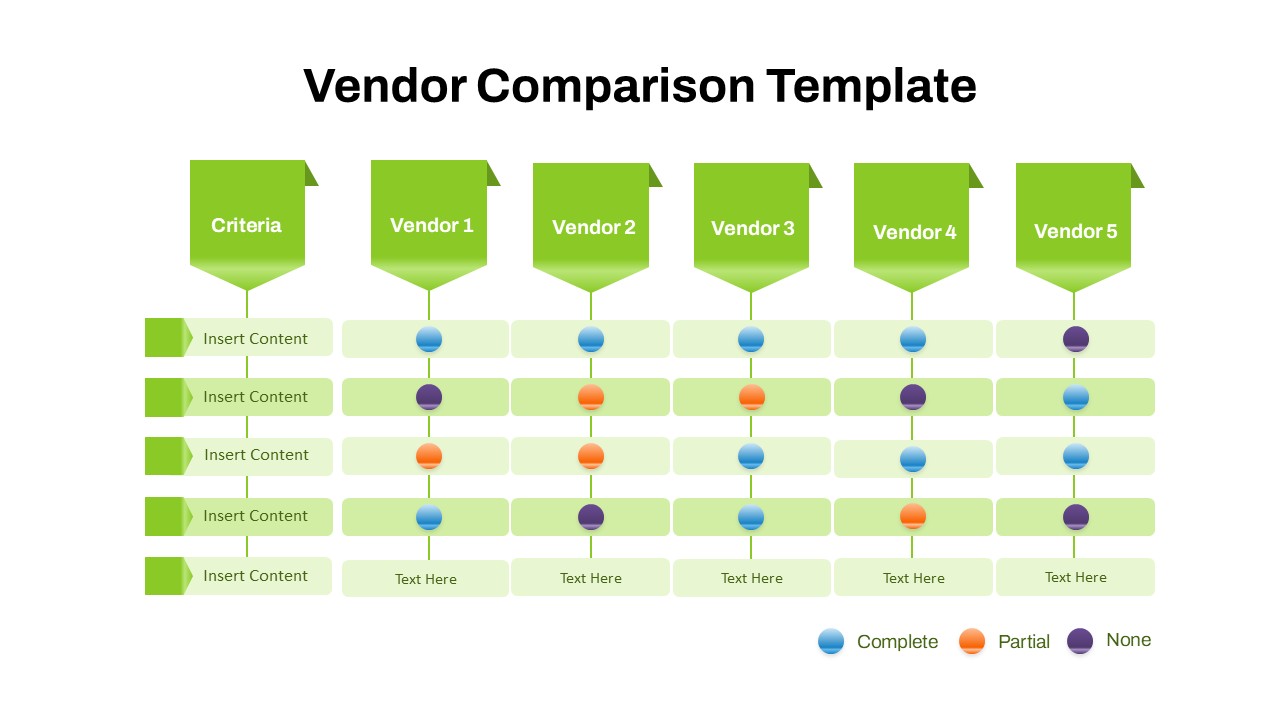
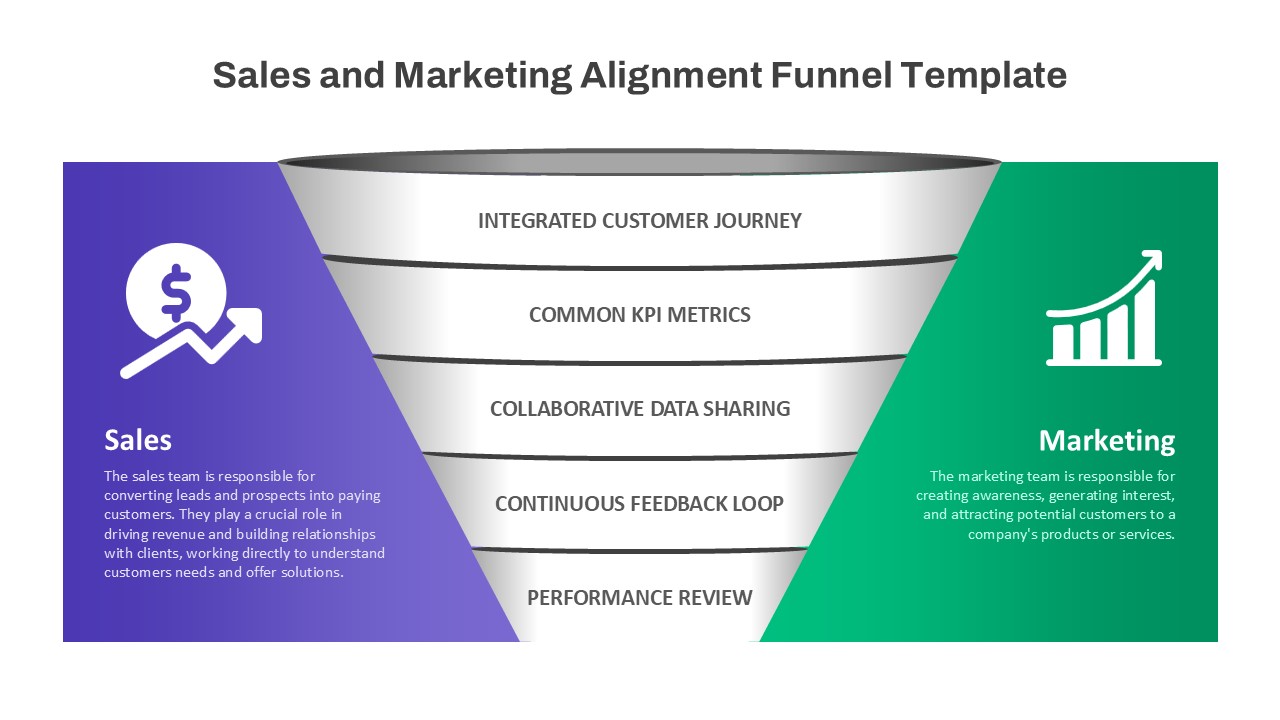
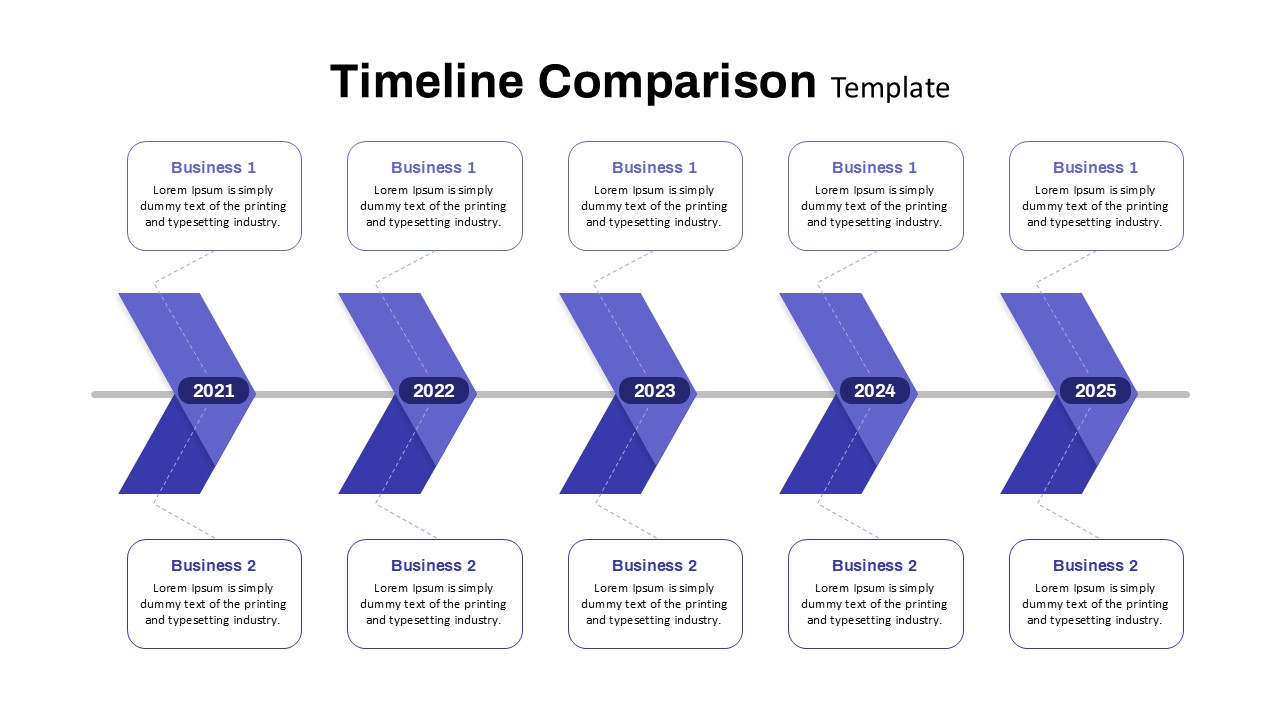
The template is divided into two key sections: one comparing multiple regions or business units over several months, and another offering detailed analysis of top and underperforming areas. This template works great for company comparison PPT presentations, especially in meetings that focus on performance evaluation and market analysis.
With its professional design and clear structure, this comparison slide template is customizable to meet the needs of any business, ensuring you can present the most relevant data to your stakeholders and make informed decisions based on sales performance metrics.
See more

Aspect Ratio
16:9Item ID
SKT03790
Features of this template
Other User Cases of the Template
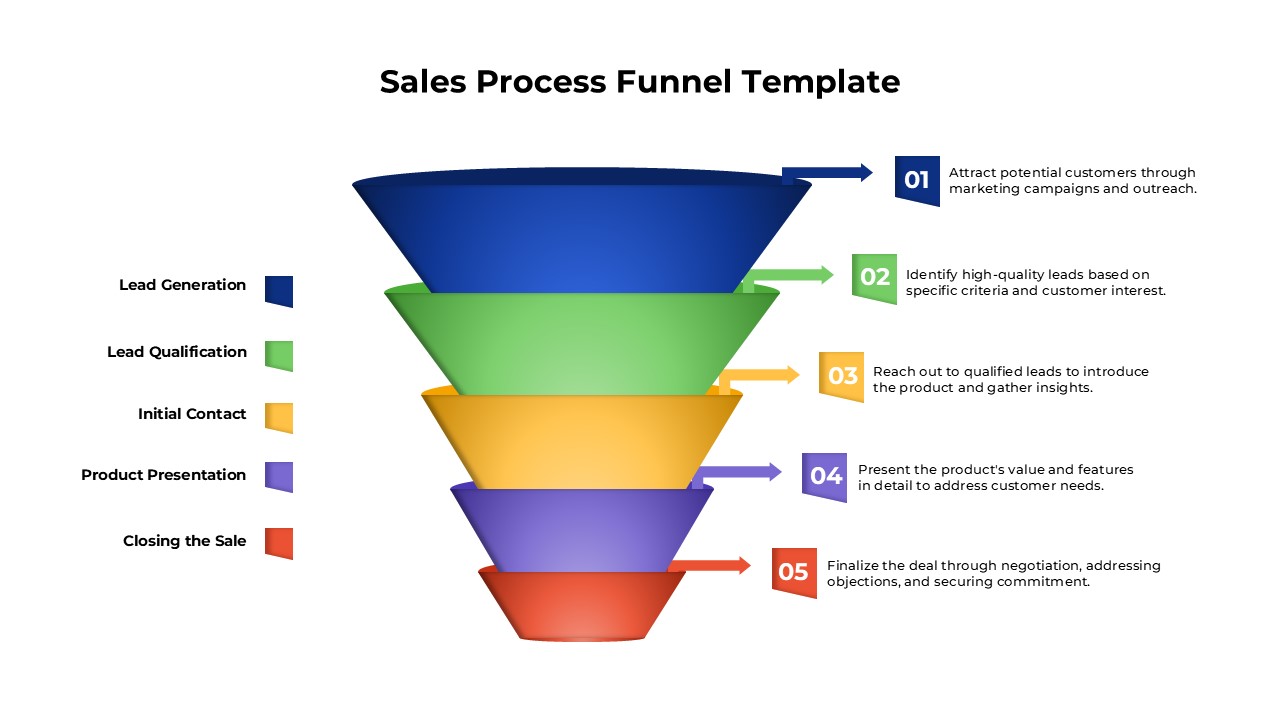
Sales performance tracking, business performance reviews, market analysis, regional sales comparison, business strategy meetings, sales trend analysis, business performance presentations, quarterly sales reports, company performance comparison, data-driven decision-making
FAQs
You May Also Like These Presentation Templates


- Free
- Free


- Free
- Free