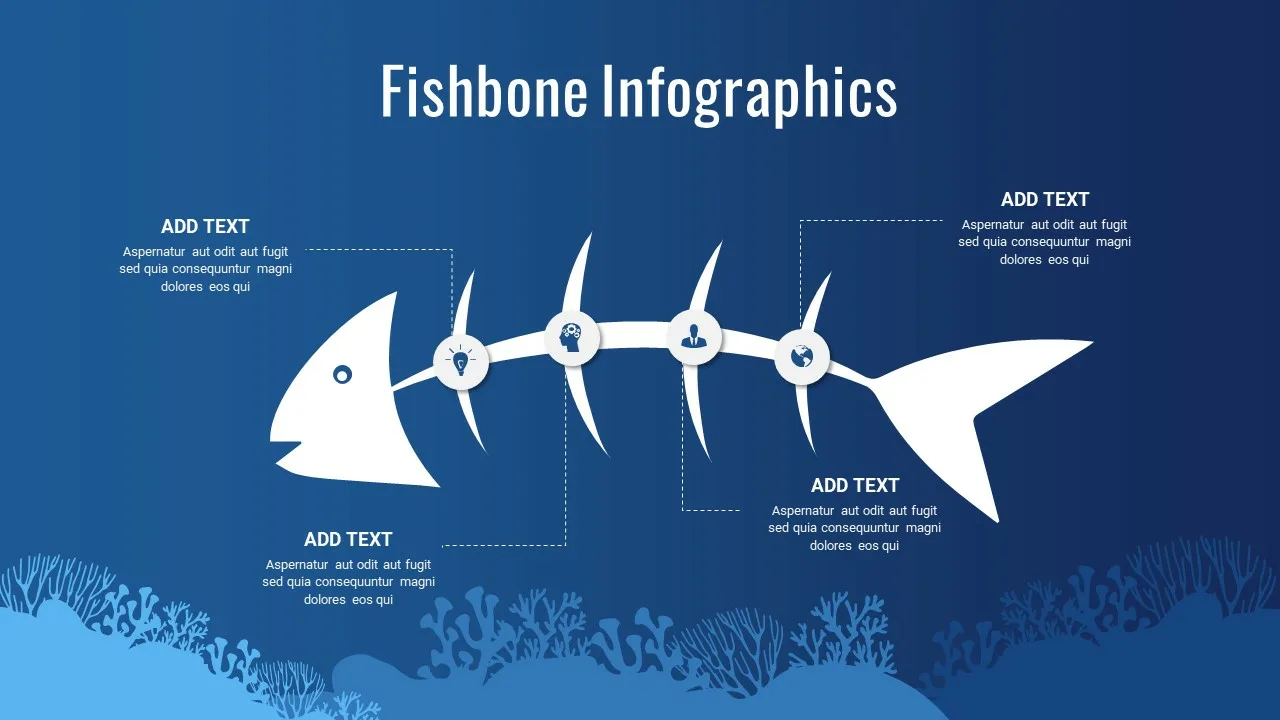
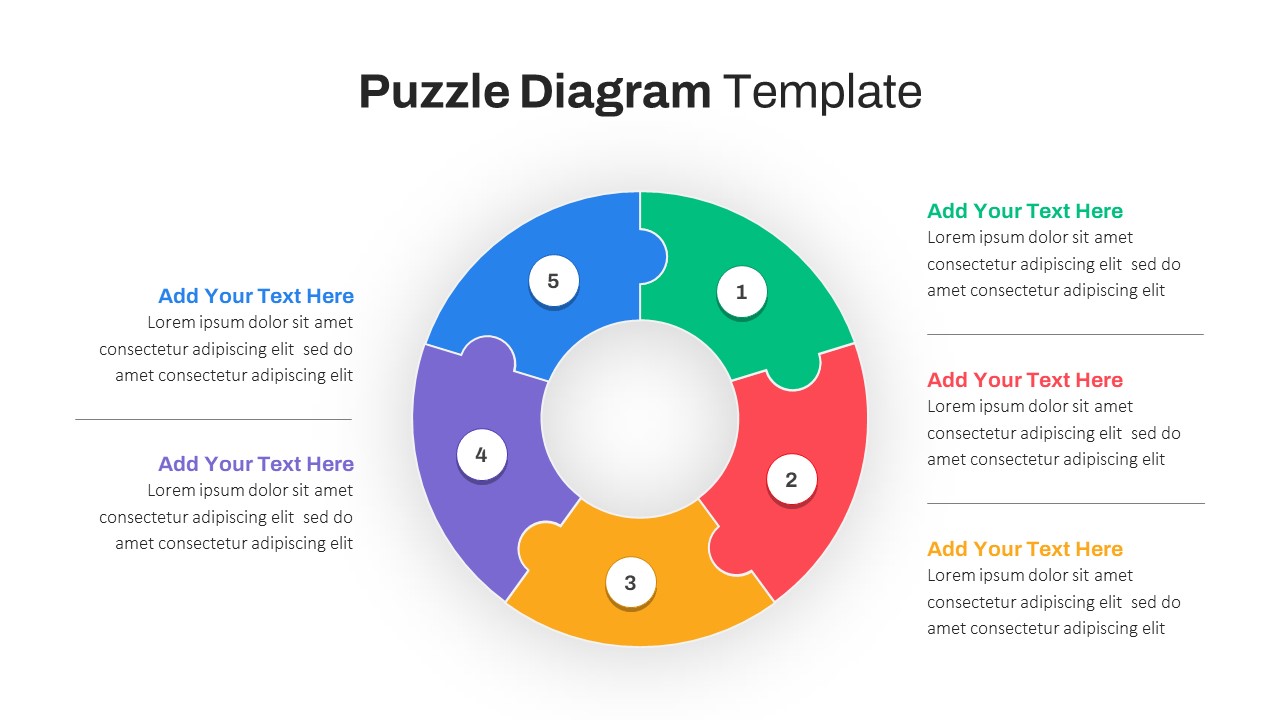
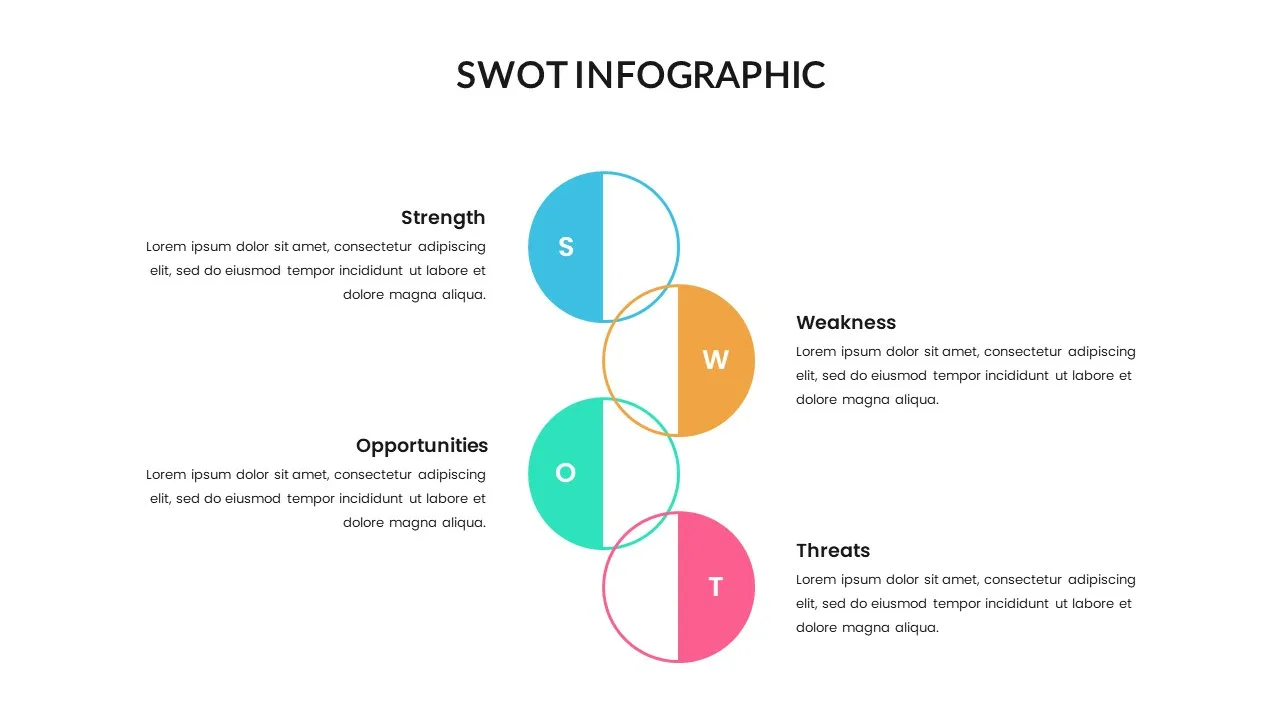
Fish Bone Analysis Template
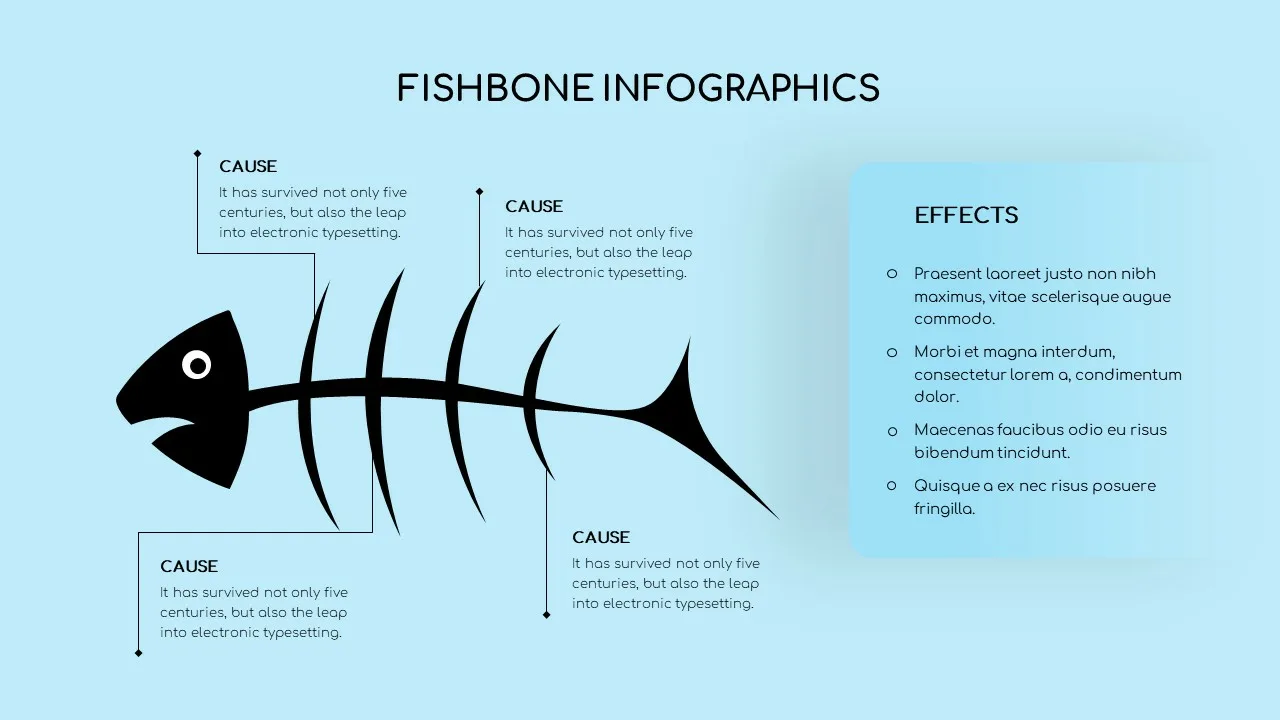
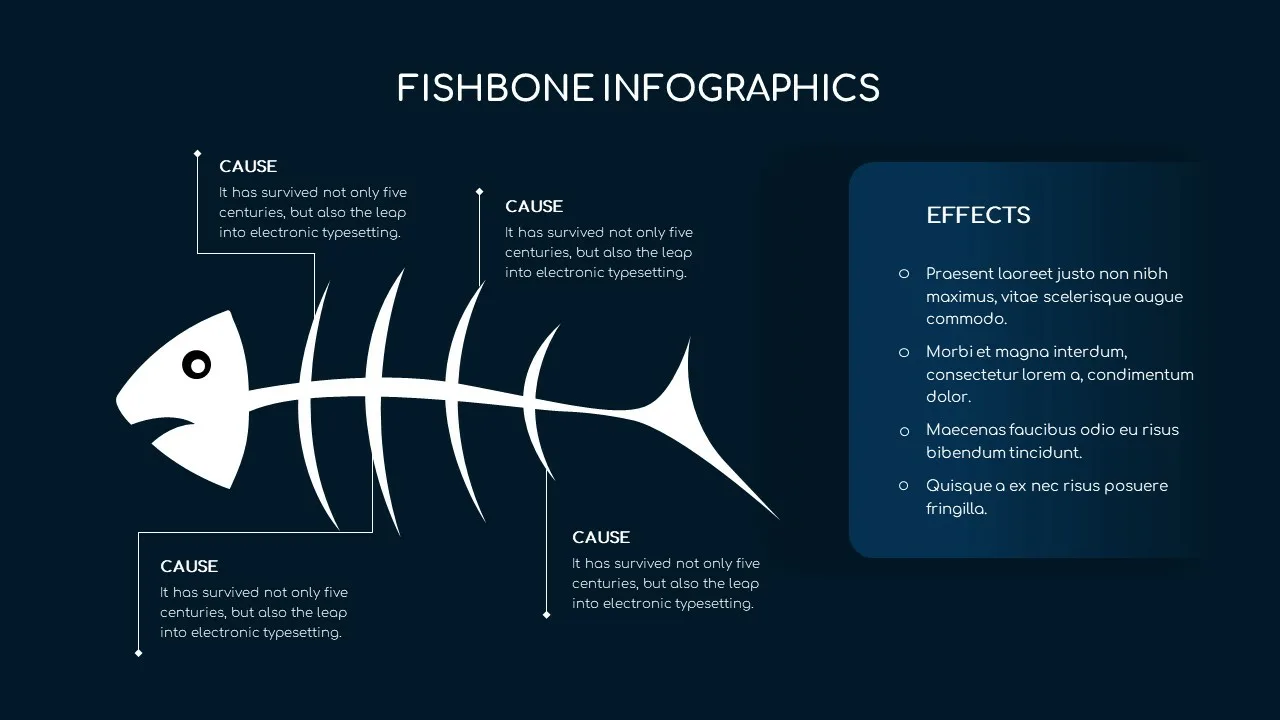
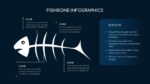
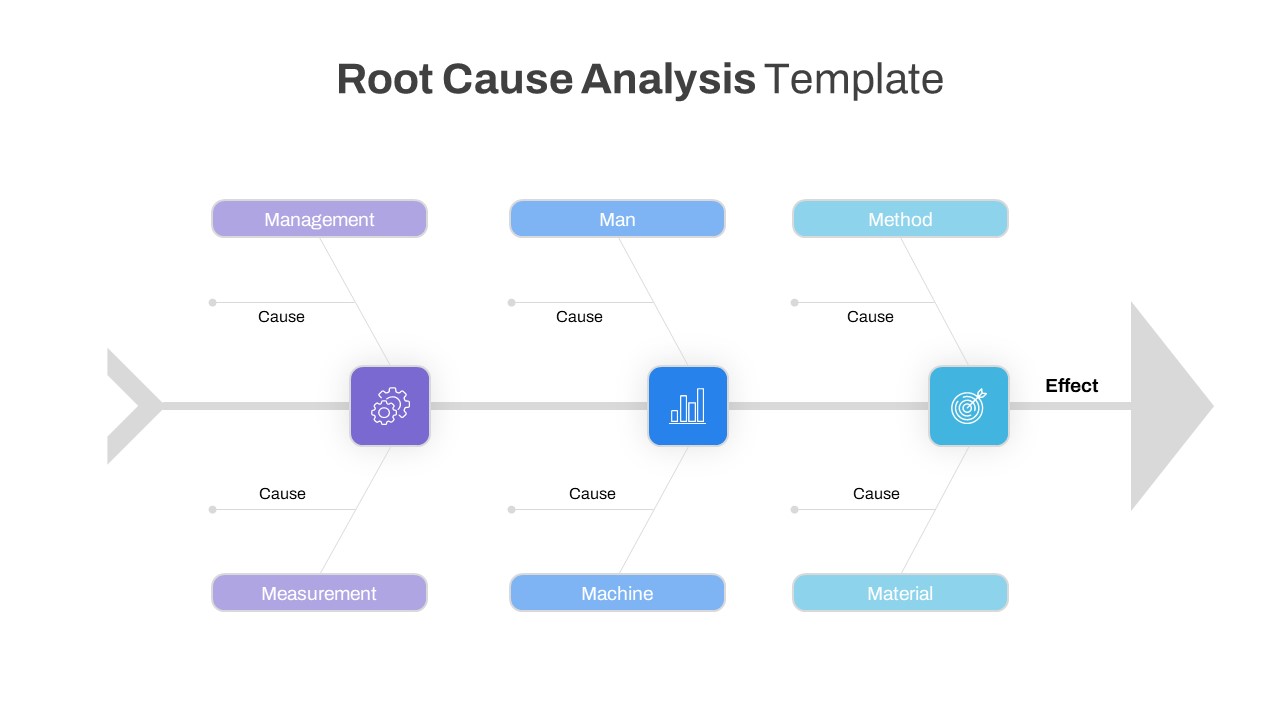
The root cause analysis fishbone template comprises skeletons, a head, and a tail. Fishbone illustration comes in a dark and light presentation background with text areas projecting cause and effect. The presenters can show their research results and the relationship between the variables using a fishbone analysis presentation. In a fishbone diagram, bones or skeletons represent the cause of a problem, while the head represents the effect. In this fishbone template, the presenters can insert the text of reasons on the near side of the bone, whereas the effect can be displayed on the box on the right-hand side. The fishbone or Ishikawa diagrams are perfect for analyzing processes and identifying problems in them. Download the fully customizable fishbone templates now.
See more

Aspect Ratio
16:9Item ID
SKT00312
You May Also Like These Presentation Templates
- Free
- Free
- Free
- Free
- Free
- Free
- Free