Six Sigma Presentation Template for PowerPoint and Google Slides
Quality improvement teams and operations professionals often need a clear way to present process improvement structures to leadership and stakeholders. A visual layout makes it easier for audiences to follow each phase of a quality management process without relying on dense text. The Six Sigma Presentation Template gives teams a ready-to-use slide layout for presenting the five-phase DMAIC cycle in a professional format.
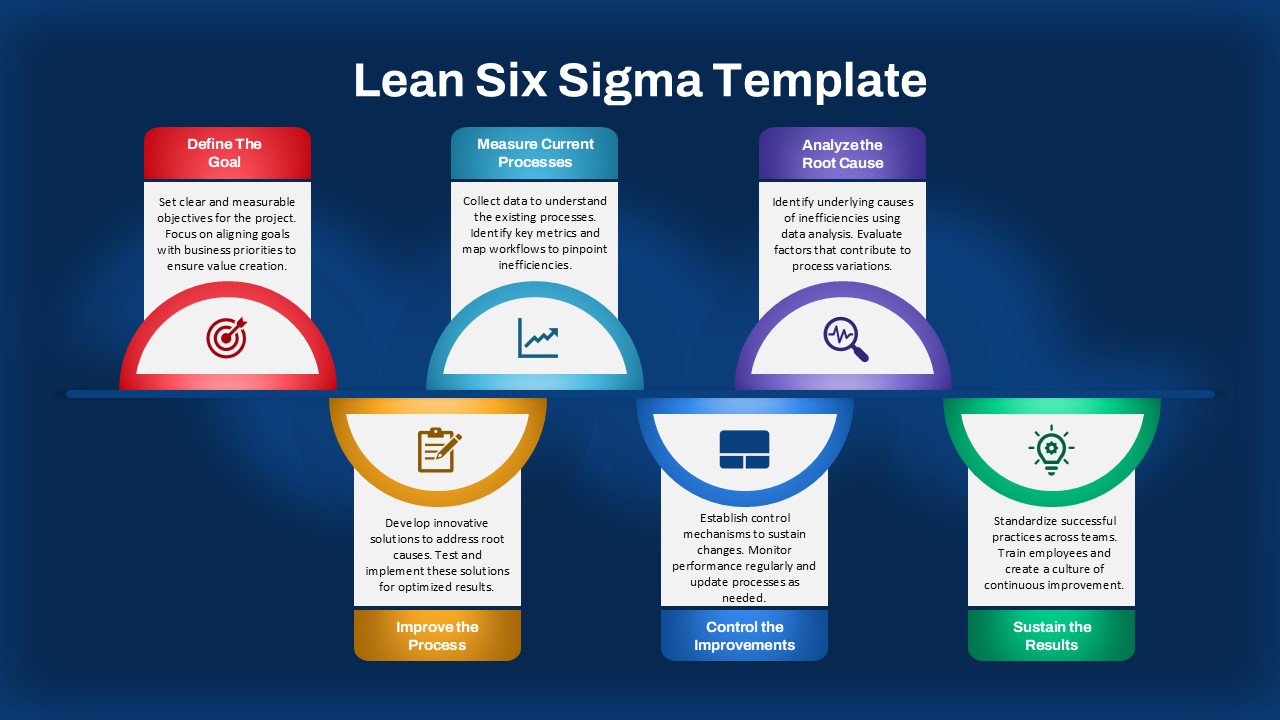
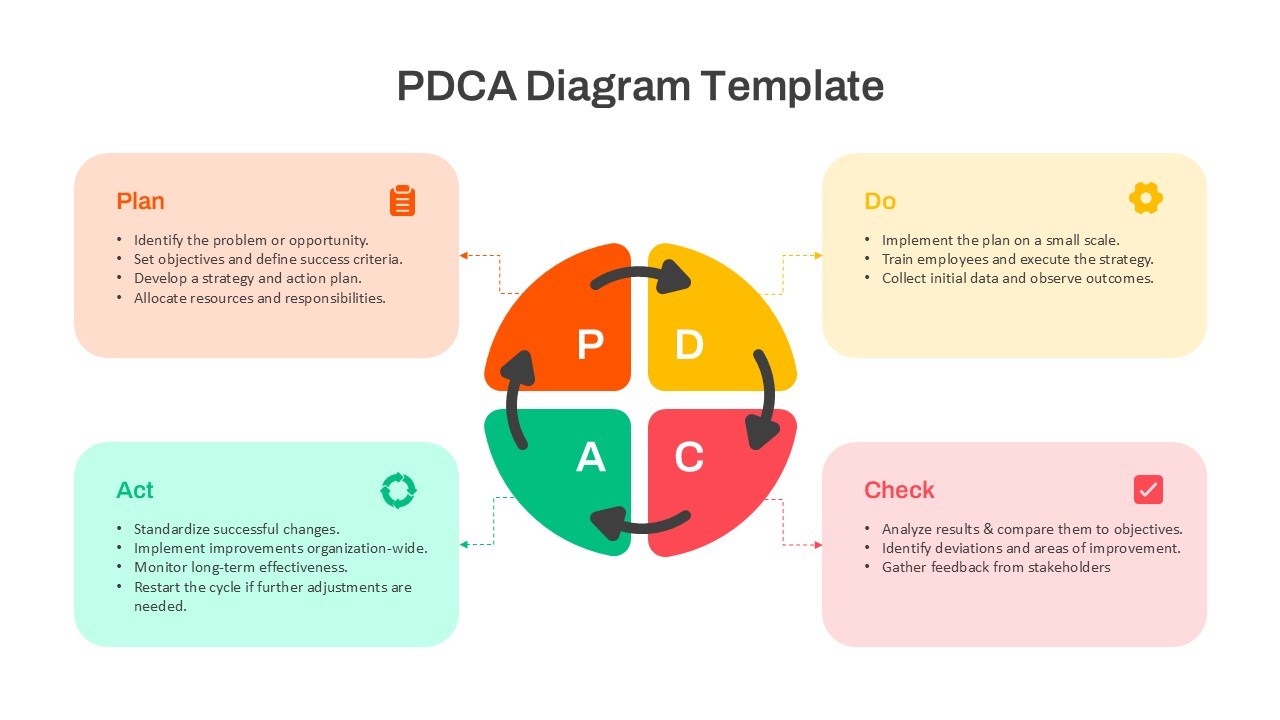
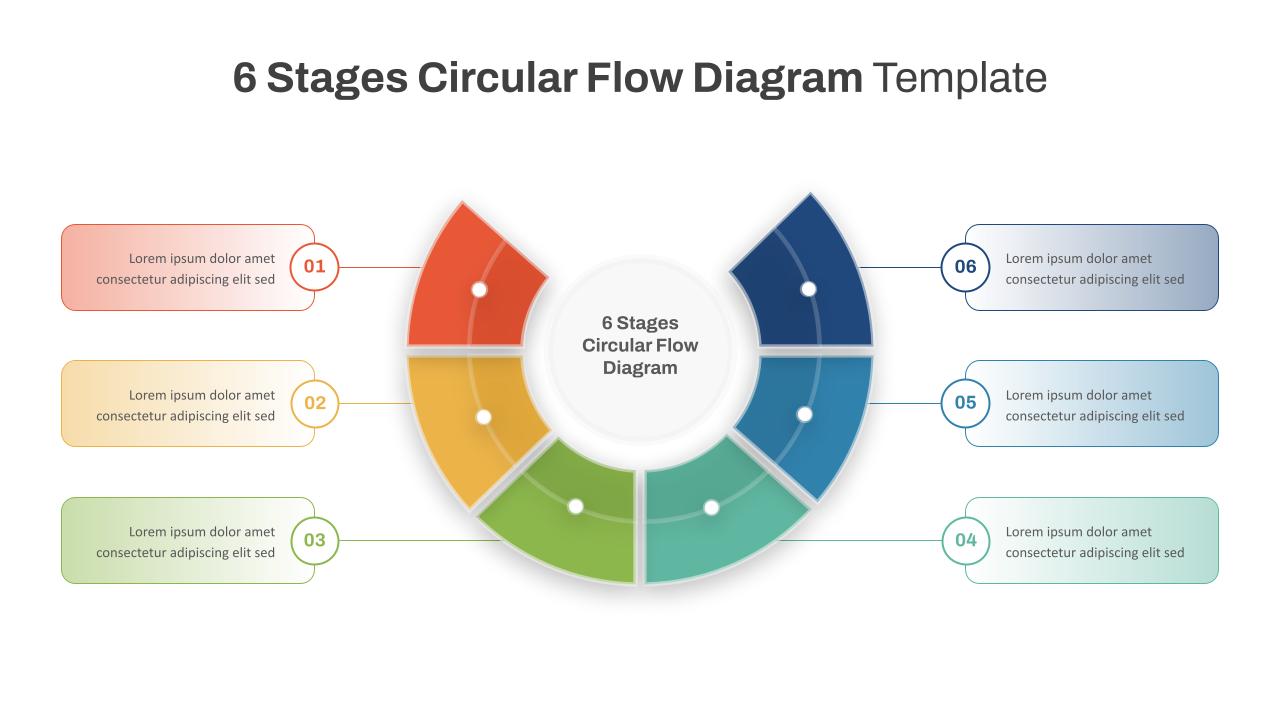
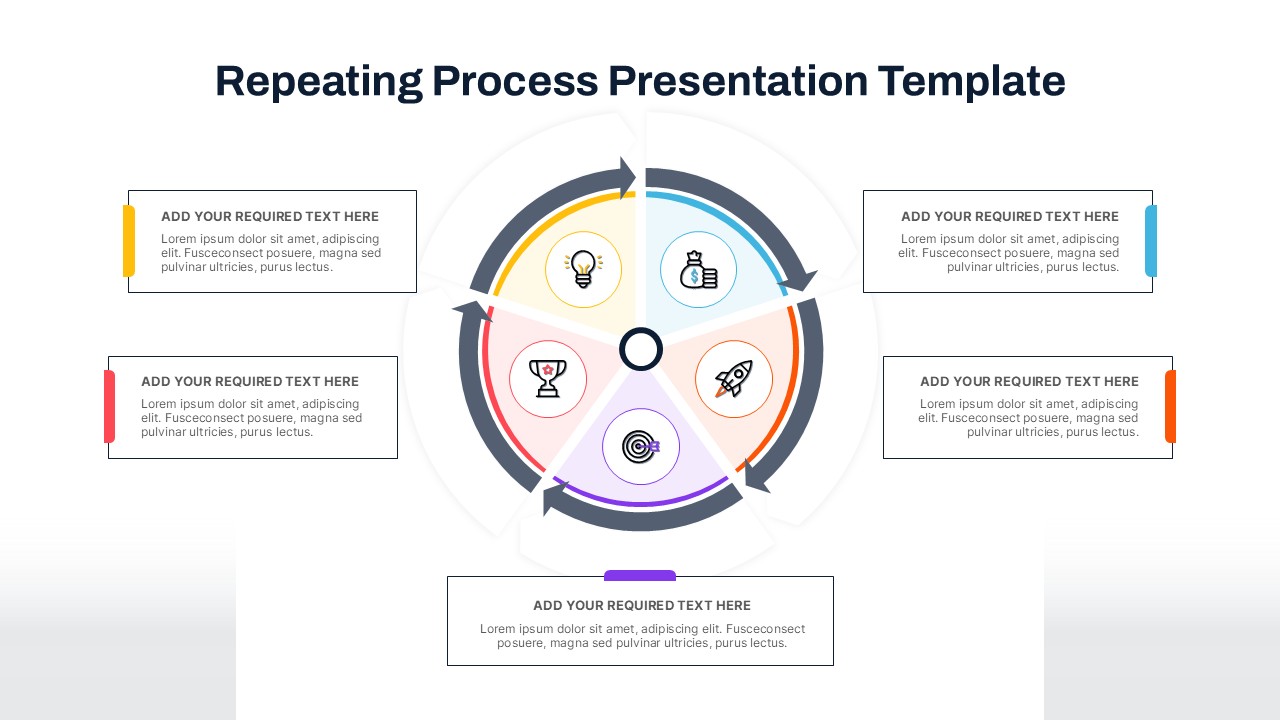
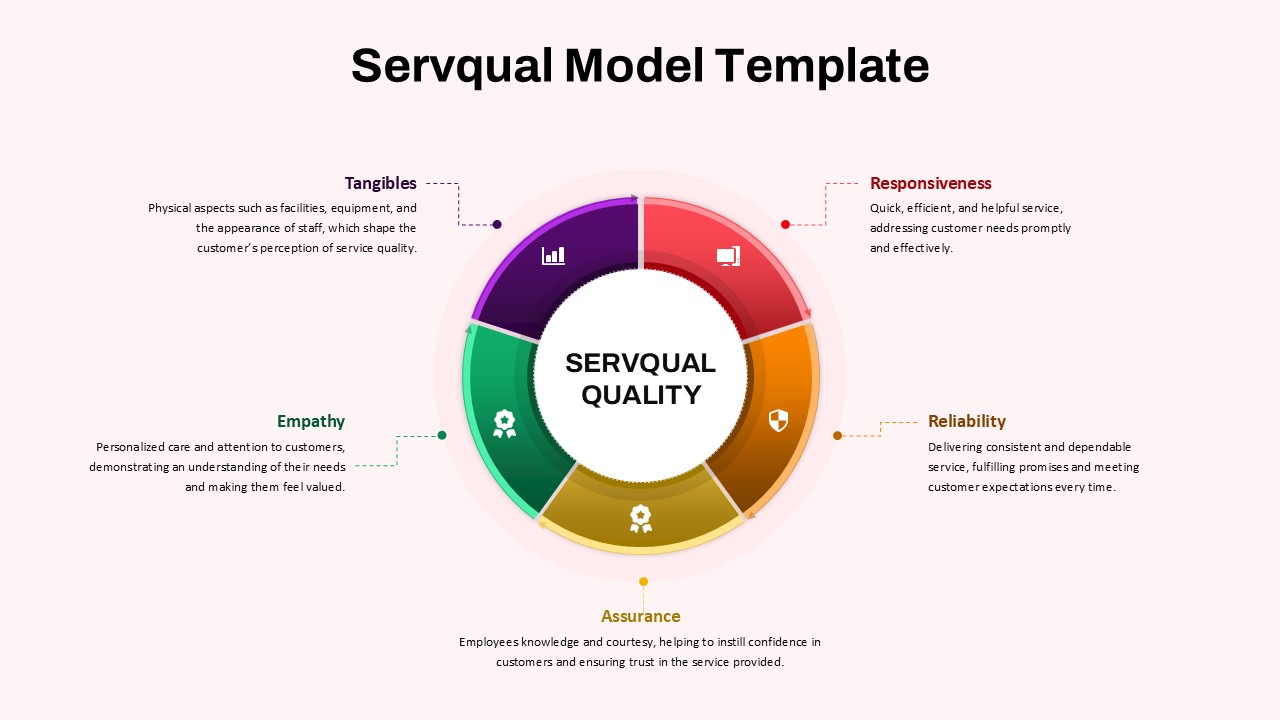
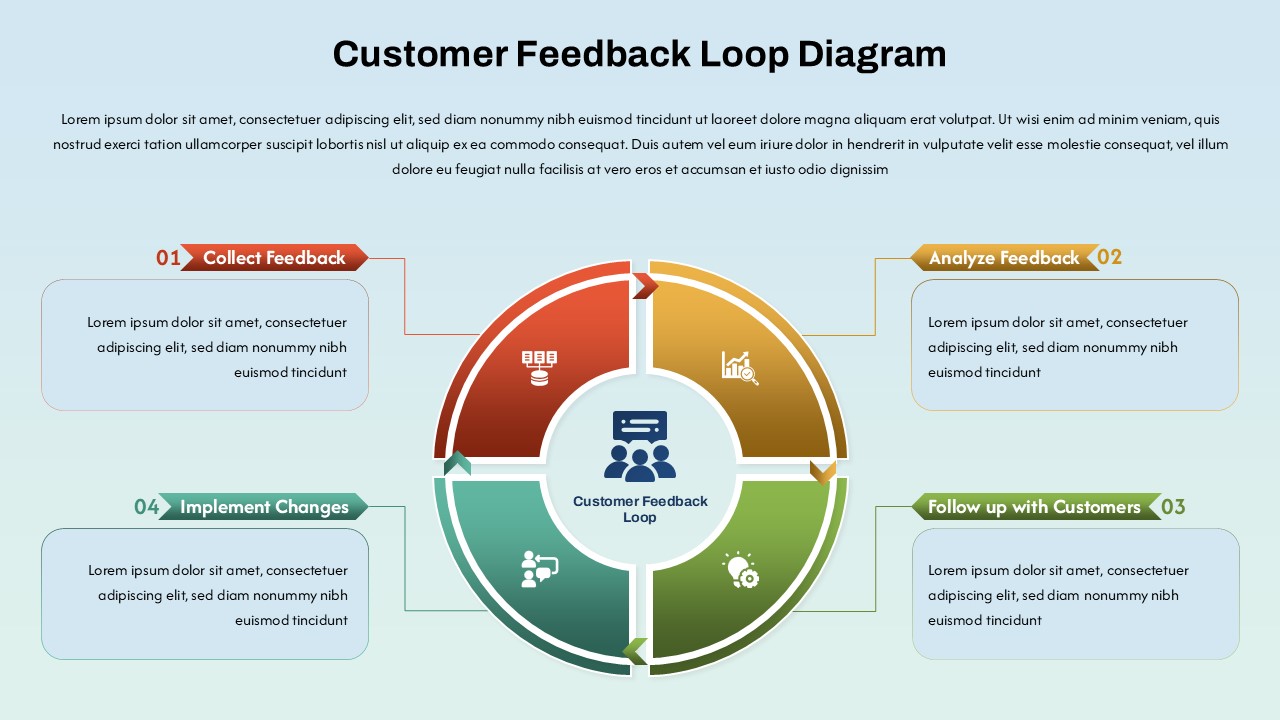
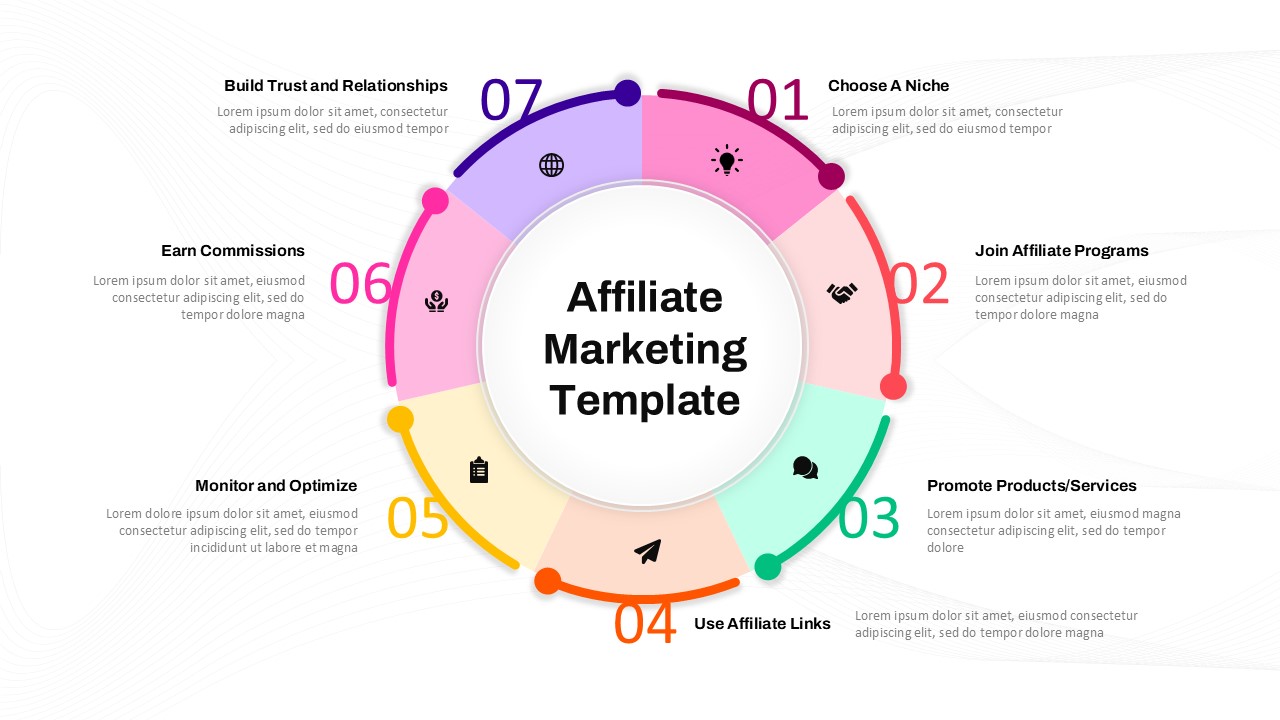
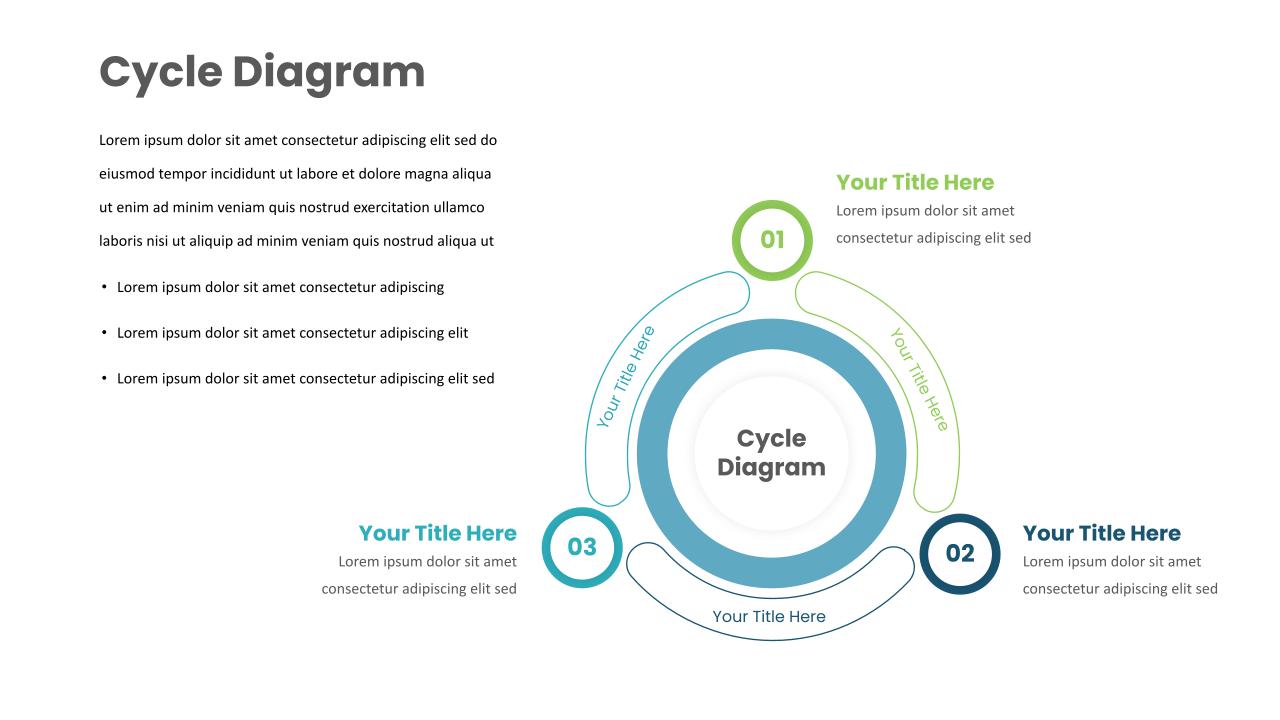
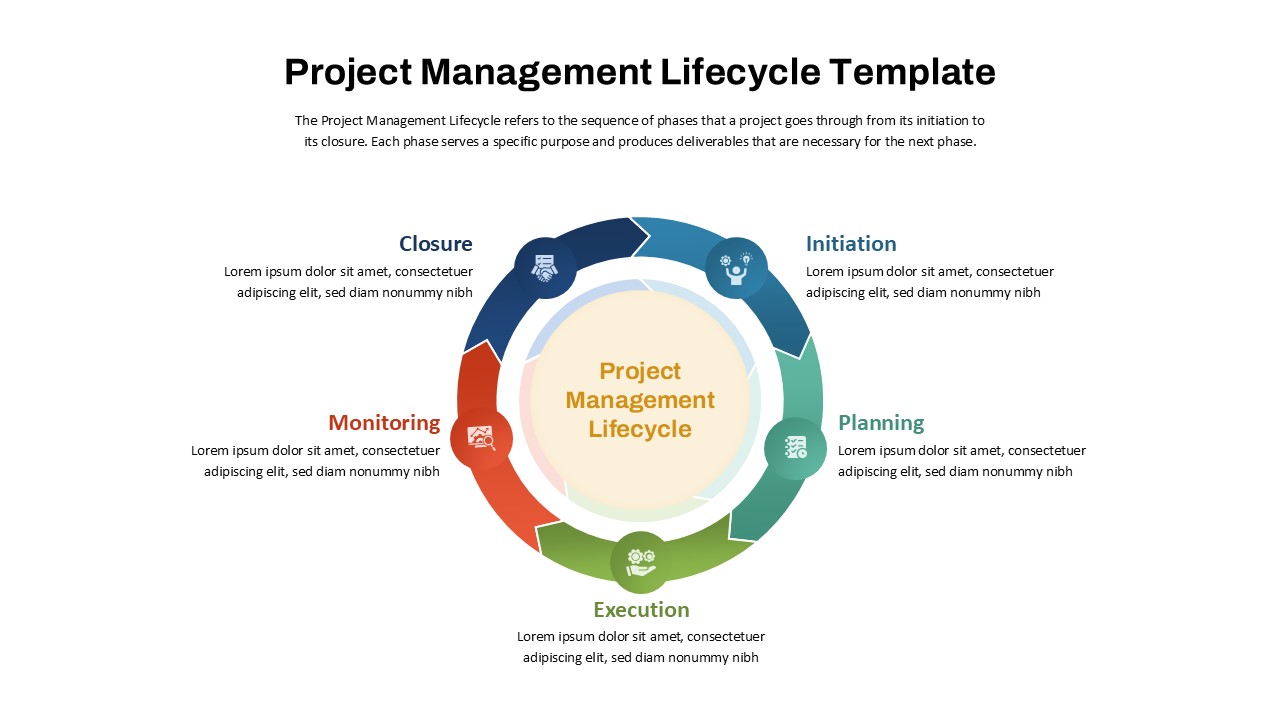
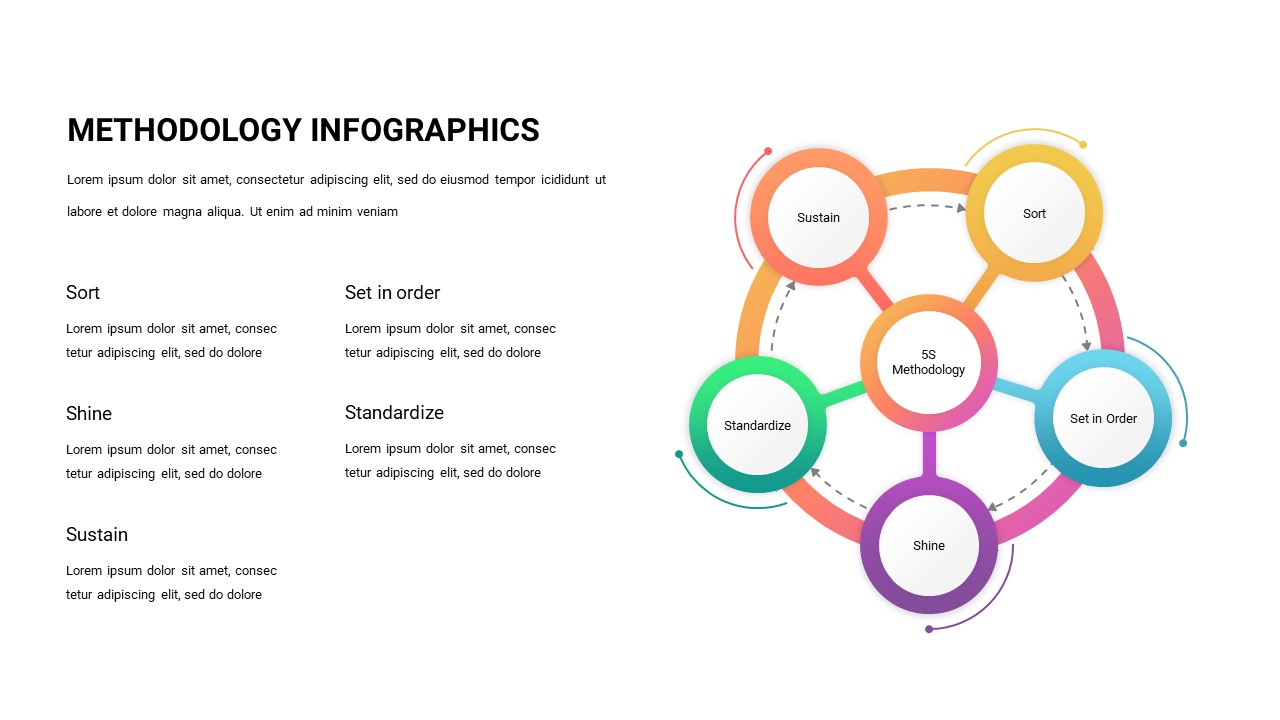
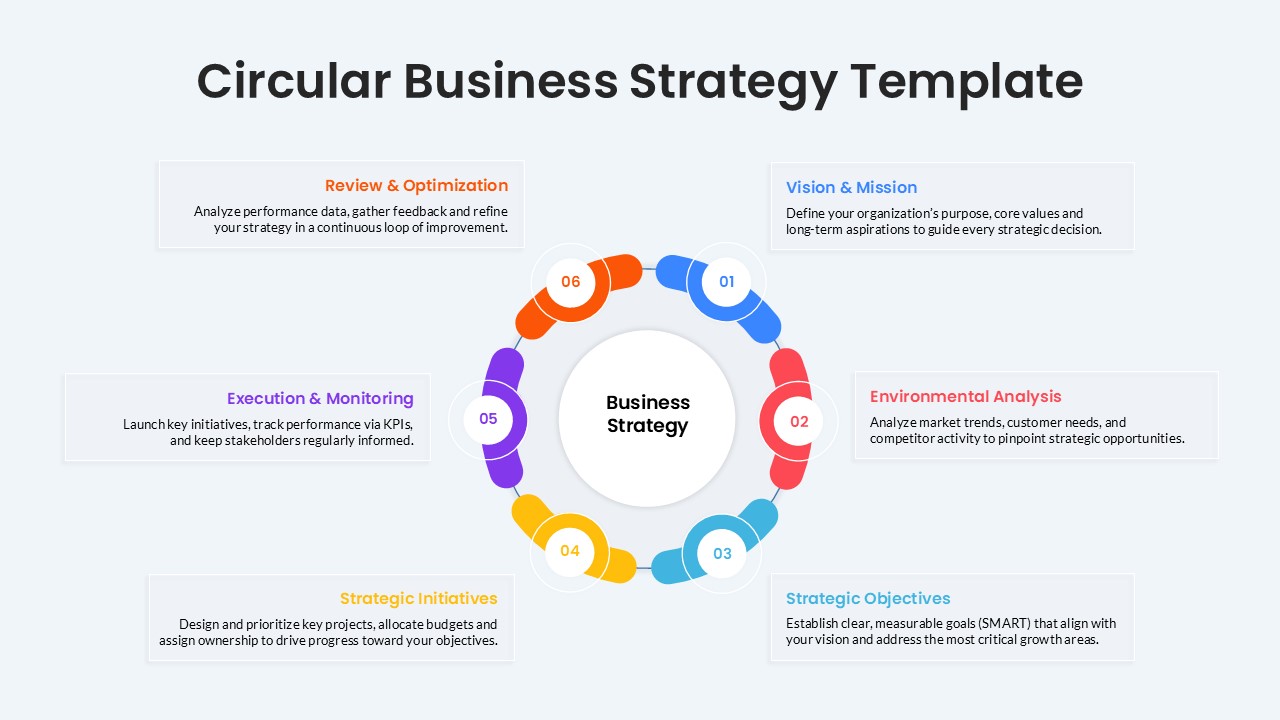
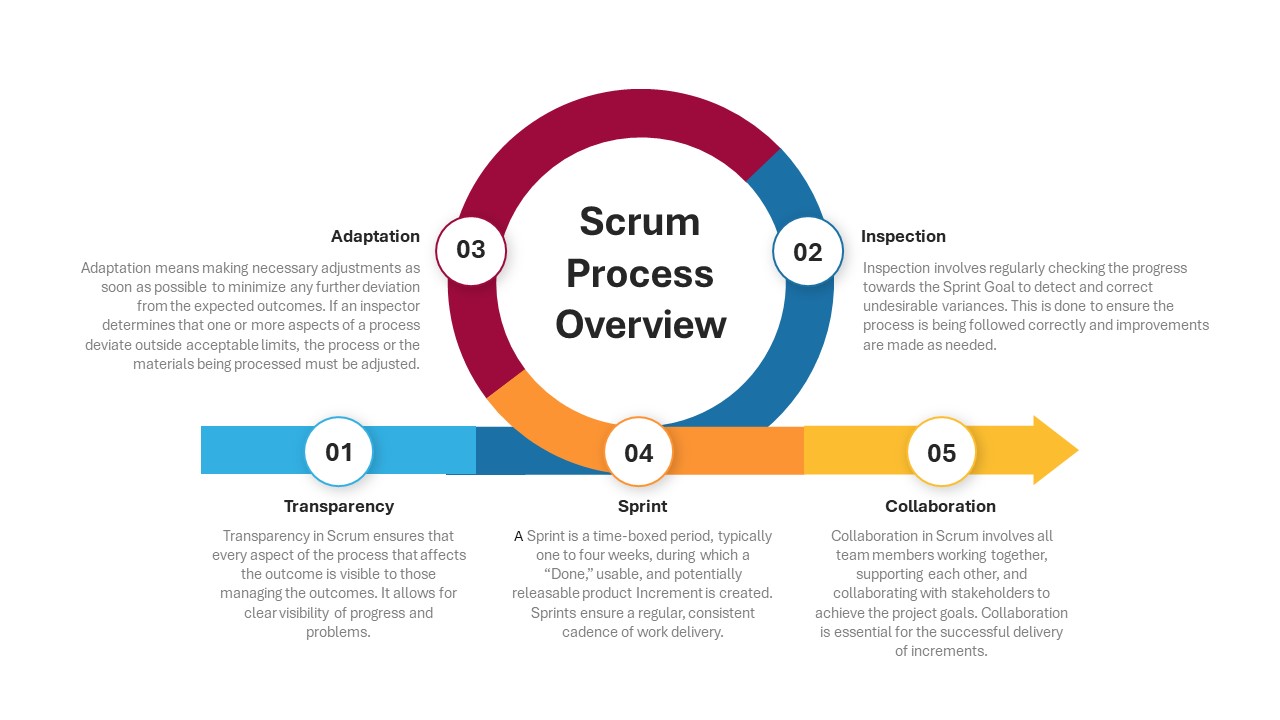
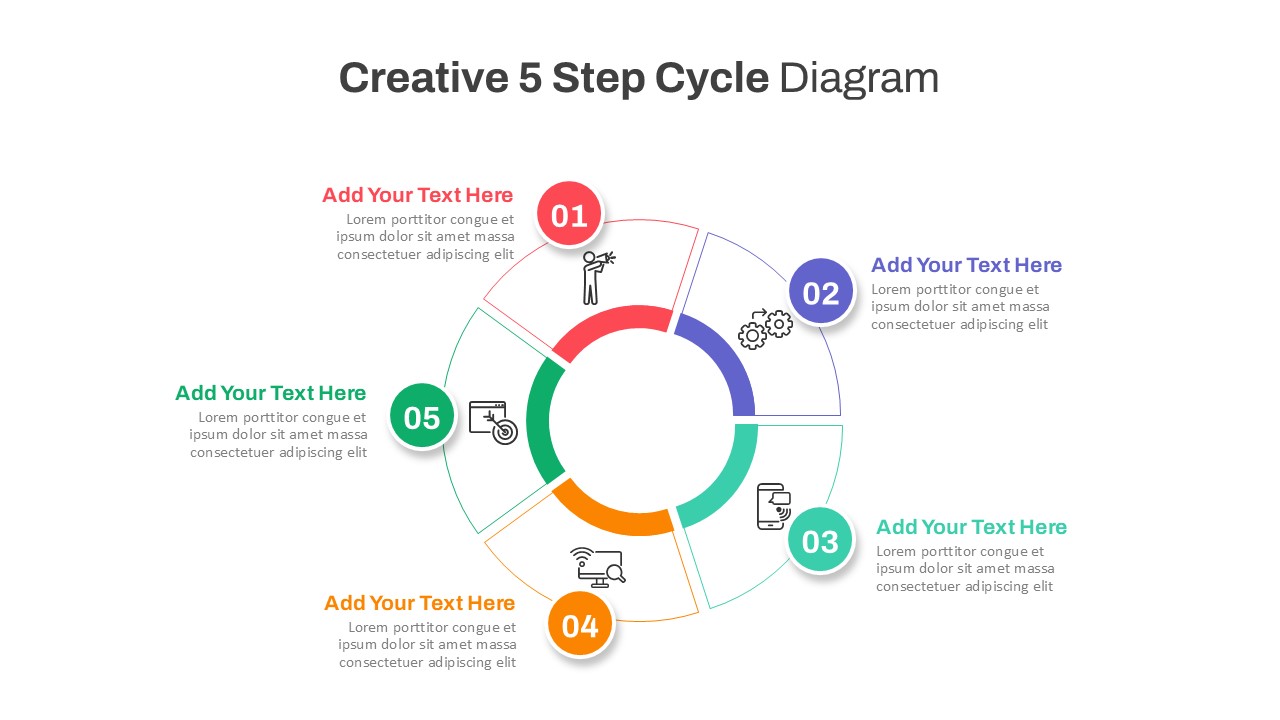
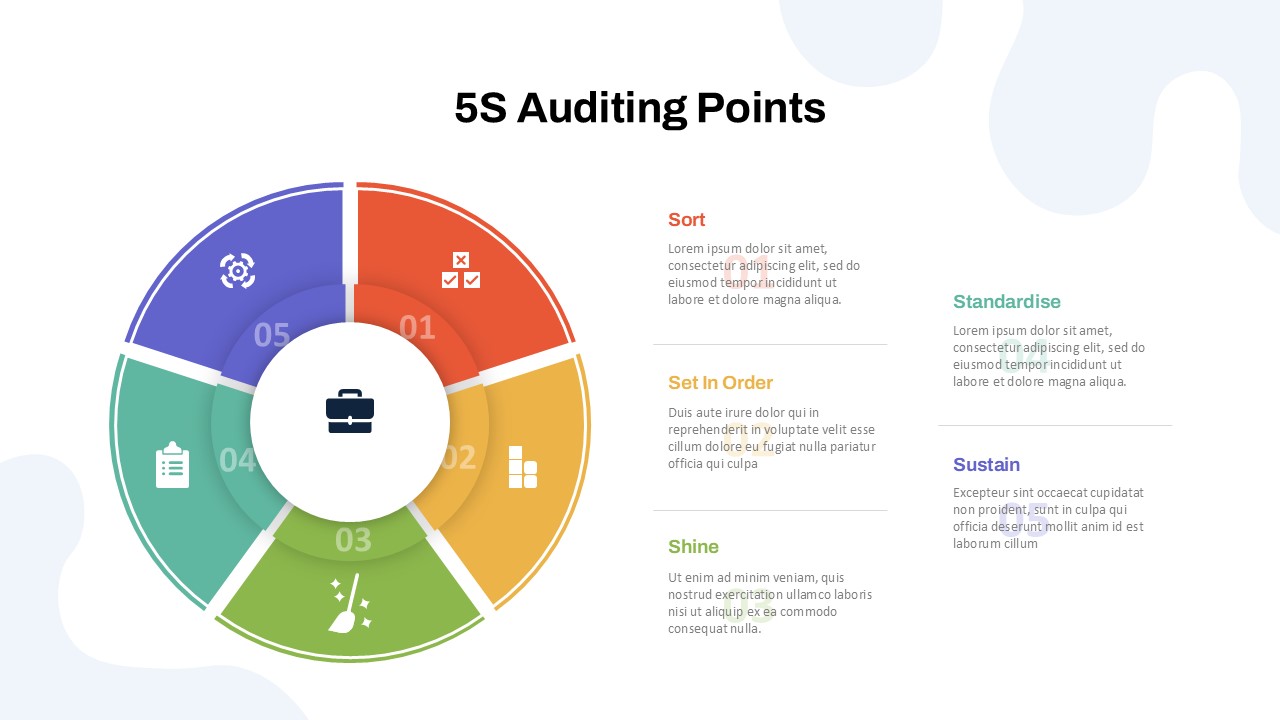
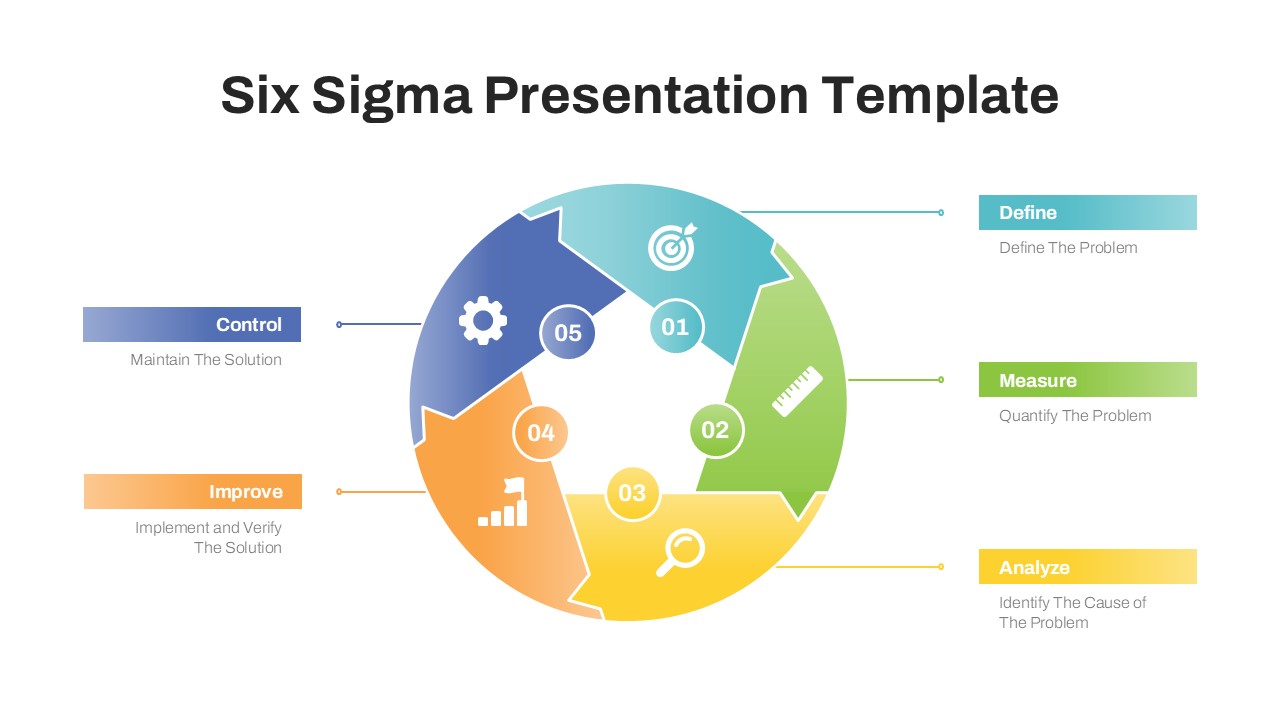
This template features a circular five-segment diagram on a white background. Each segment represents one phase of the cycle and uses a distinct color. Teal represents Define, green represents Measure, yellow represents Analyze, orange represents Improve, and blue represents Control. Numbered labels from 01 to 05 mark each segment clearly. Icons inside each segment visually reinforce the phase theme. Connector lines link each segment to labeled callout boxes positioned on the left and right sides of the diagram.
The template is available in both PowerPoint and Google Slides. Operations managers, quality analysts, business consultants, and process improvement teams can use it to present DMAIC workflows, quality initiatives, and process review frameworks to professional audiences.
What Is This Six Sigma Presentation Template?
The Six Sigma Presentation Template is a single-slide presentation layout built around a five-segment circular DMAIC diagram. It organizes the five phases into a continuous cycle with numbered segments and color-coded sections. Each phase connects to a labeled callout box that includes the phase name and a short description. Define links to “Define The Problem.” Measure links to “Quantify The Problem.” Analyze links to “Identify The Cause of The Problem.” Improve links to “Implement and Verify The Solution.” Control links to “Maintain The Solution.”
The diagram uses a clean white background with multicolor segments in teal, green, yellow, orange, and blue. Each segment also carries a distinct icon representing the nature of that phase. Together, these elements provide a complete one-slide overview of a structured quality improvement process suitable for any professional presentation context.
When to Use This Template
This template works well when a team needs to present a structured quality improvement process to management, clients, or cross-functional stakeholders. It suits process review meetings, quality assurance briefings, and operational improvement presentations. The circular DMAIC layout clearly shows how each phase connects to the next in a continuous improvement cycle. It is also a practical choice for project kickoff presentations and training sessions where teams need to align on a shared improvement methodology before execution begins.
Customization and Editing Options
All text labels in this template are fully editable. The slide title, phase names, callout box labels, and short descriptions below each label can all be updated directly in PowerPoint or Google Slides. Each callout description can be expanded to include additional detail relevant to a specific project or industry context.
The five segment colors can each be changed individually using the shape fill option in either platform. Teams can apply brand colors or a single consistent color scheme across all segments if preferred. Additionally, the icons inside each segment are replaceable using the standard icon or image insert function. Connector lines between the diagram and the callout boxes can be repositioned or restyled as needed.
Furthermore, the numbered labels on each segment can be updated or removed entirely. Font size, weight, and alignment are adjustable throughout. The entire diagram can also be scaled up or down without losing layout consistency.
PowerPoint and Google Slides Compatibility
The Six Sigma Presentation Template works fully with Microsoft PowerPoint and Google Slides. Both formats are available for immediate download and use. No additional plugins, fonts, or software installations are required for either platform.
The white background, multicolor circular diagram, icon elements, and callout box layout render consistently across both platforms. Google Slides users can open and edit the file directly in a browser and share it with team members for real-time collaboration. In contrast, the PowerPoint version supports offline editing and allows further customization of shapes, colors, and slide transitions. The widescreen 16:9 format shown in the template image carries over to both versions, making it suitable for screen presentations, projector displays, and digital sharing.
See more

Aspect Ratio
16:9Item ID
SKT04523
Features of this template
Other Use Cases of This Template
Quality management and process improvement presentations, Operations review and efficiency planning decks, Manufacturing quality control briefings, Business process reengineering proposal presentations, Lean and Six Sigma training and onboarding slides, Project management methodology overview decks, Corporate continuous improvement initiative presentations, Supply chain and logistics quality review decks, Healthcare process improvement and compliance presentations, Financial services operational risk management briefings, IT service management and process optimization decksFAQs
You May Also Like These Presentation Templates


- Free
- Free
- Free
- Free