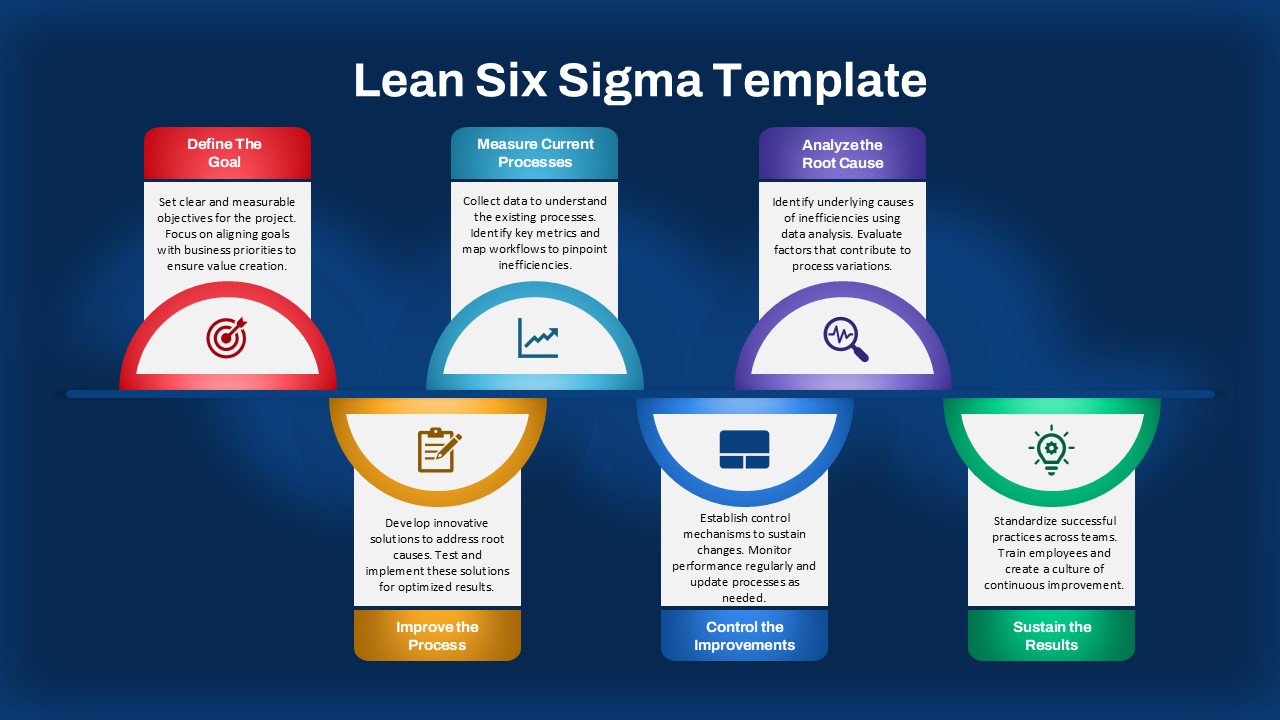
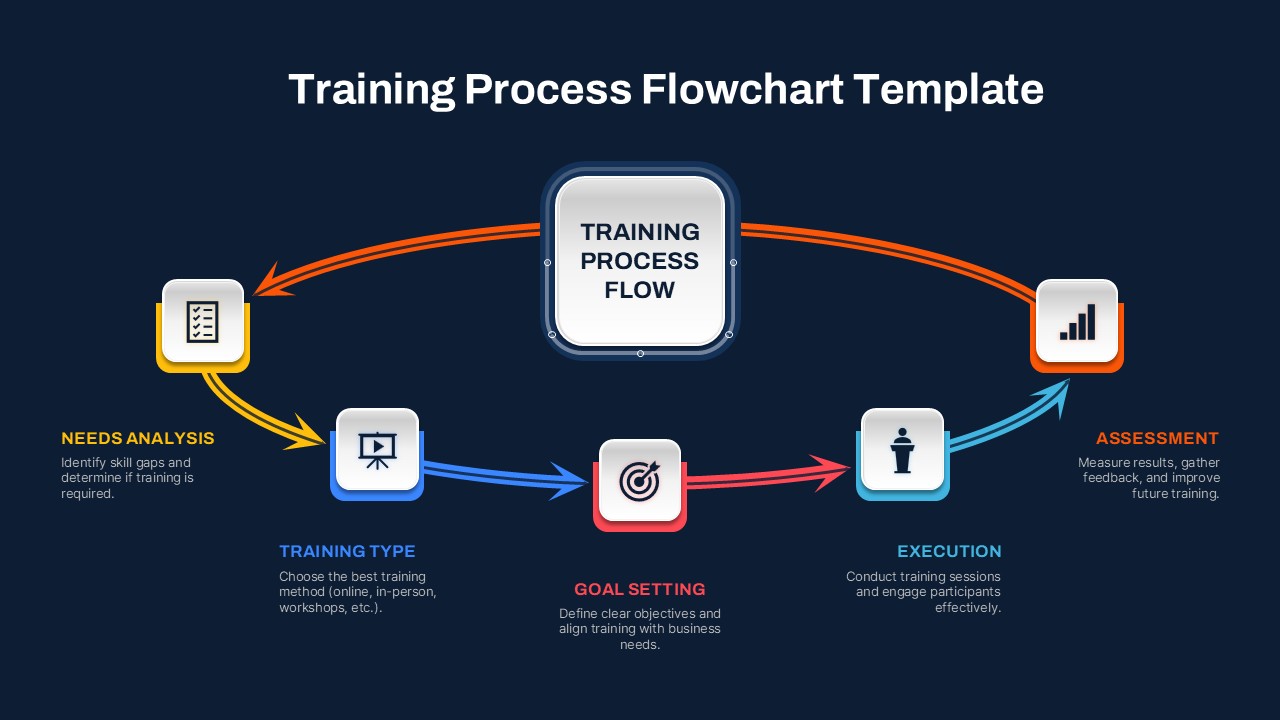
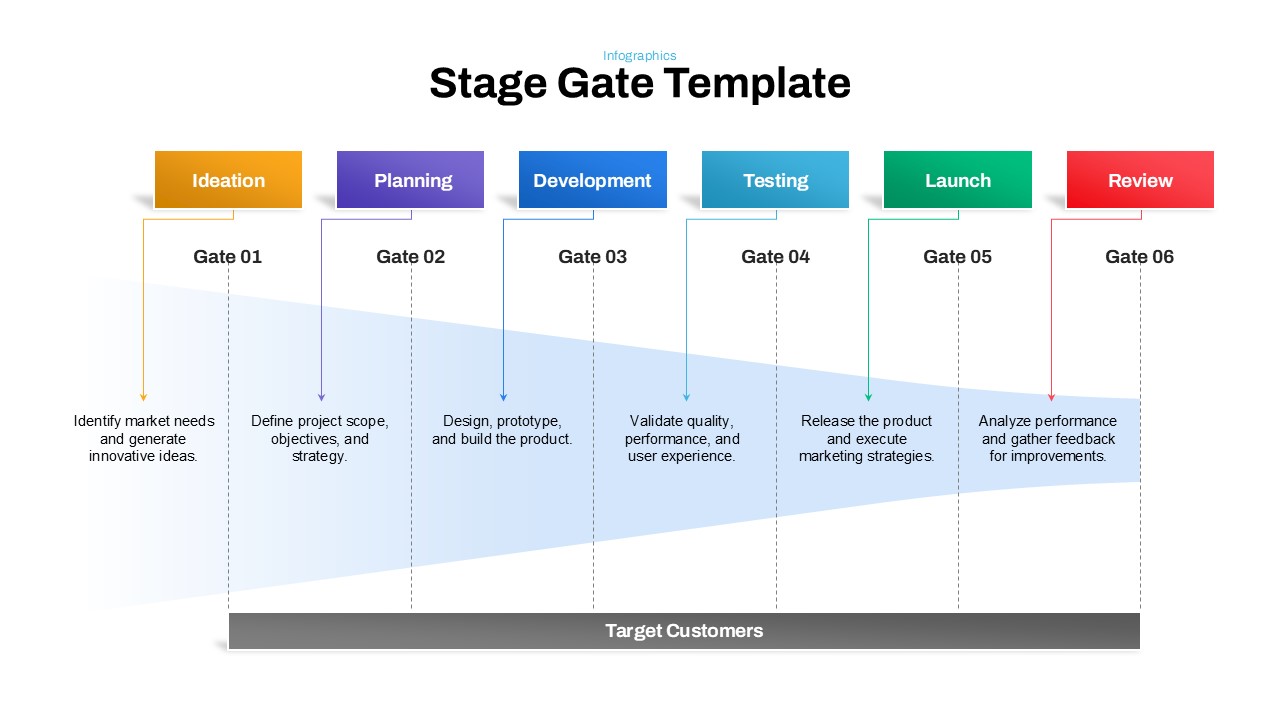
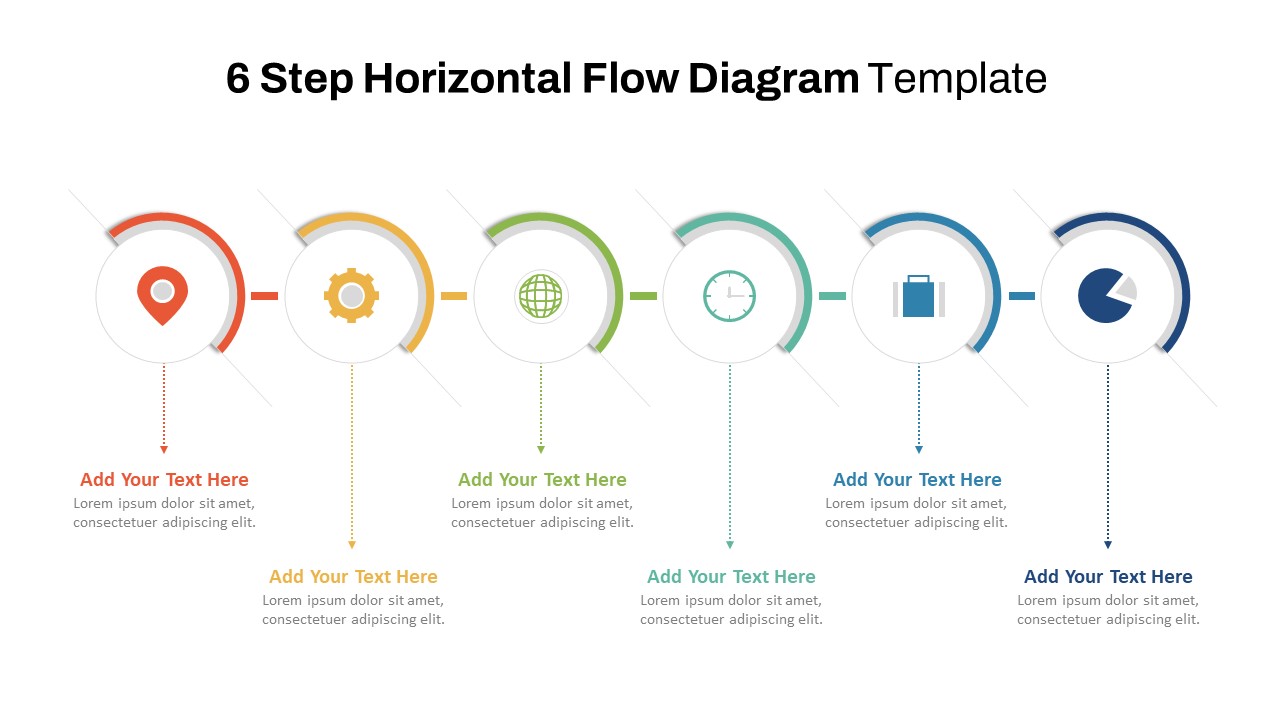
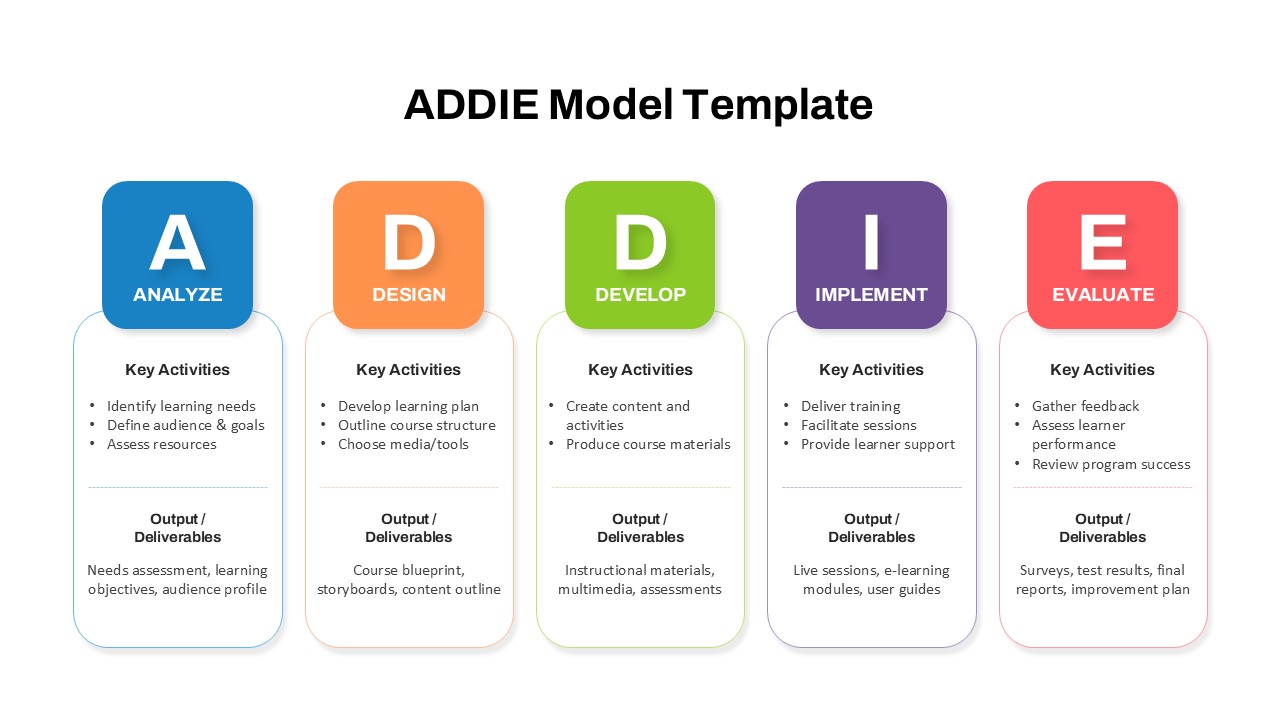
Lean Six Sigma DMAIC Framework Slide for PowerPoint & Google Slides
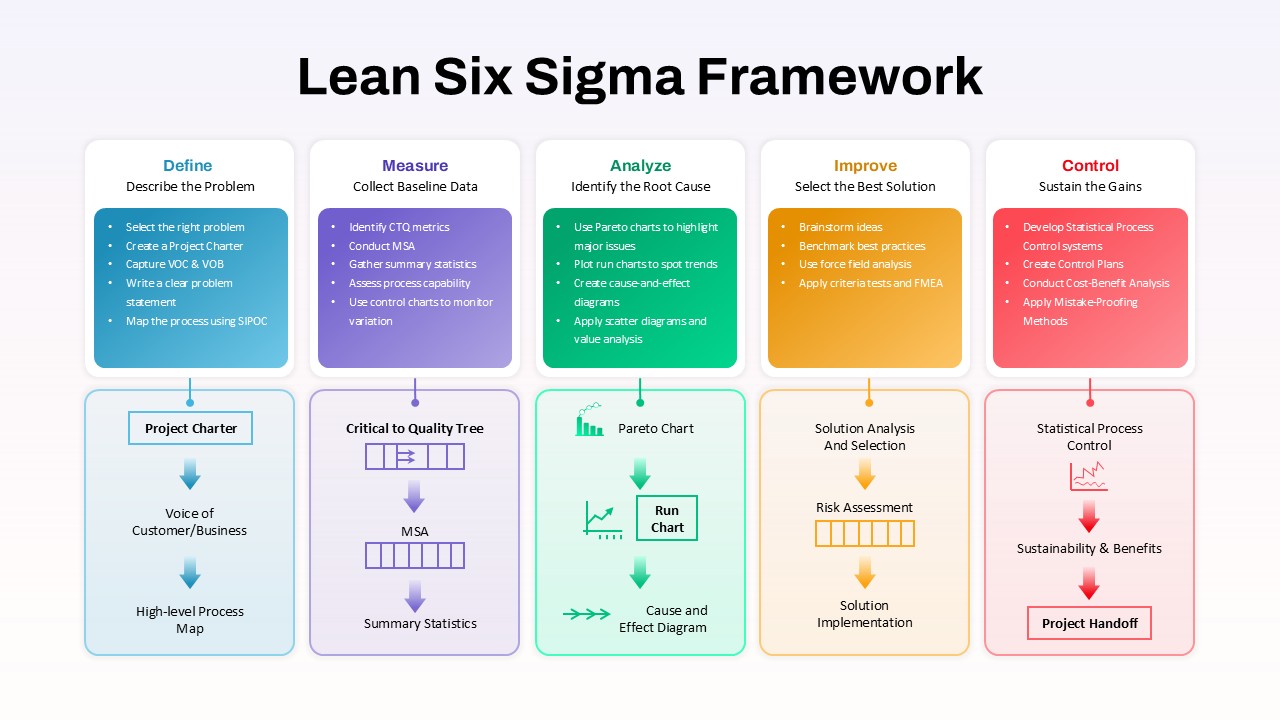
This slide offers a complete visual overview of the Lean Six Sigma DMAIC (Define, Measure, Analyze, Improve, Control) methodology, structured for clarity and practical use. Each phase is represented by a distinct color-coded column, detailing its key objectives and tools—ranging from Project Charters and SIPOC diagrams to Run Charts, FMEA, and Control Plans. A second row visually reinforces each phase with associated techniques and process maps, giving teams a quick-reference blueprint to guide continuous improvement efforts.
The minimalist grid layout and vibrant palette (blue, purple, green, orange, red) aid visual separation and retention, making it easy to follow the sequential flow of activities. Supporting icons and tool names such as “Pareto Chart,” “Solution Analysis,” and “Statistical Process Control” add contextual depth without visual clutter. Ideal for training, quality reviews, or strategic planning, the slide balances theoretical rigor with actionable visuals.
Fully customizable in both PowerPoint and Google Slides, users can easily edit text blocks, replace icons, or rearrange phases to suit specific workflows or industry needs. Whether leading a Six Sigma workshop or reporting improvement outcomes, this framework slide equips presenters with a clean, professional tool to drive lean conversations.
See more

Aspect Ratio
16:9Item ID
SKT04070
Features of this template
Other Uses
Can be adapted for project audits, performance optimization planning, risk assessments, or root-cause training. Rebrand it for internal SOPs, ISO certification programs, or continuous improvement initiatives.
FAQs
You May Also Like These Presentation Templates

- Free
- Free

- Free
- Free
- Free
- Free

- Free