Sales Performance Dashboard with Forecast & Growth Metrics Template for PowerPoint & Google Slides
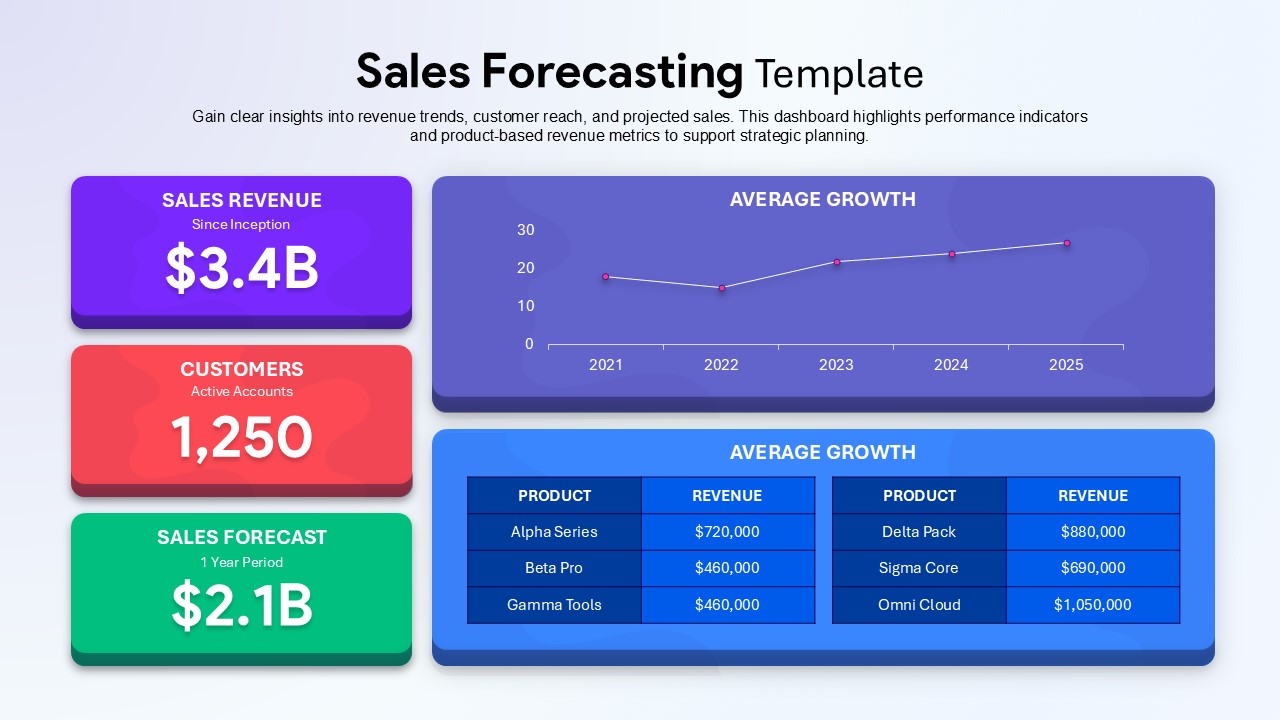
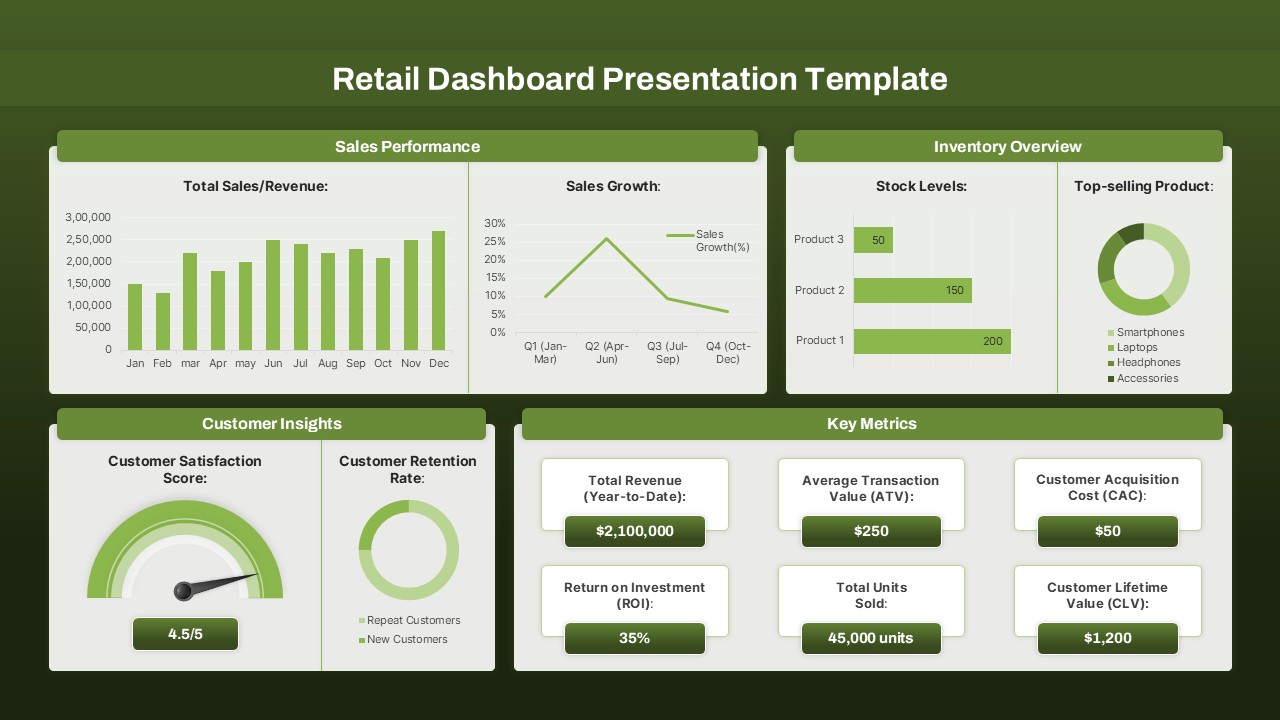
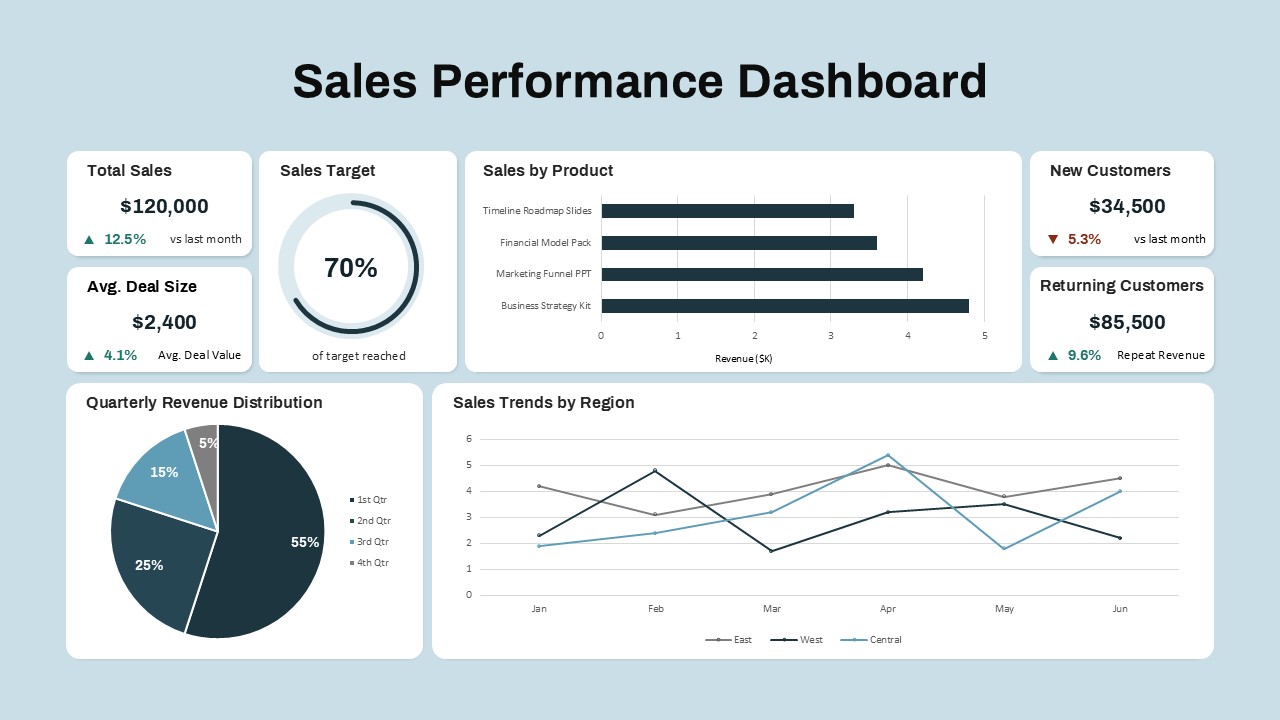
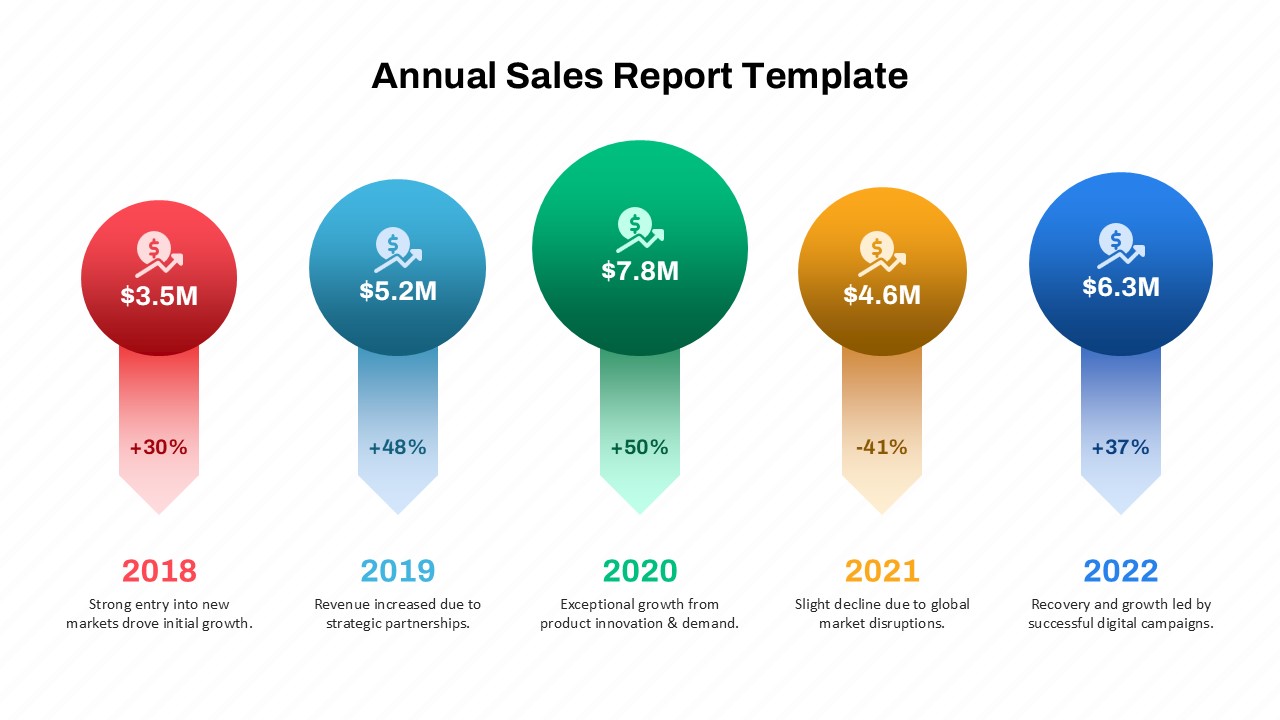
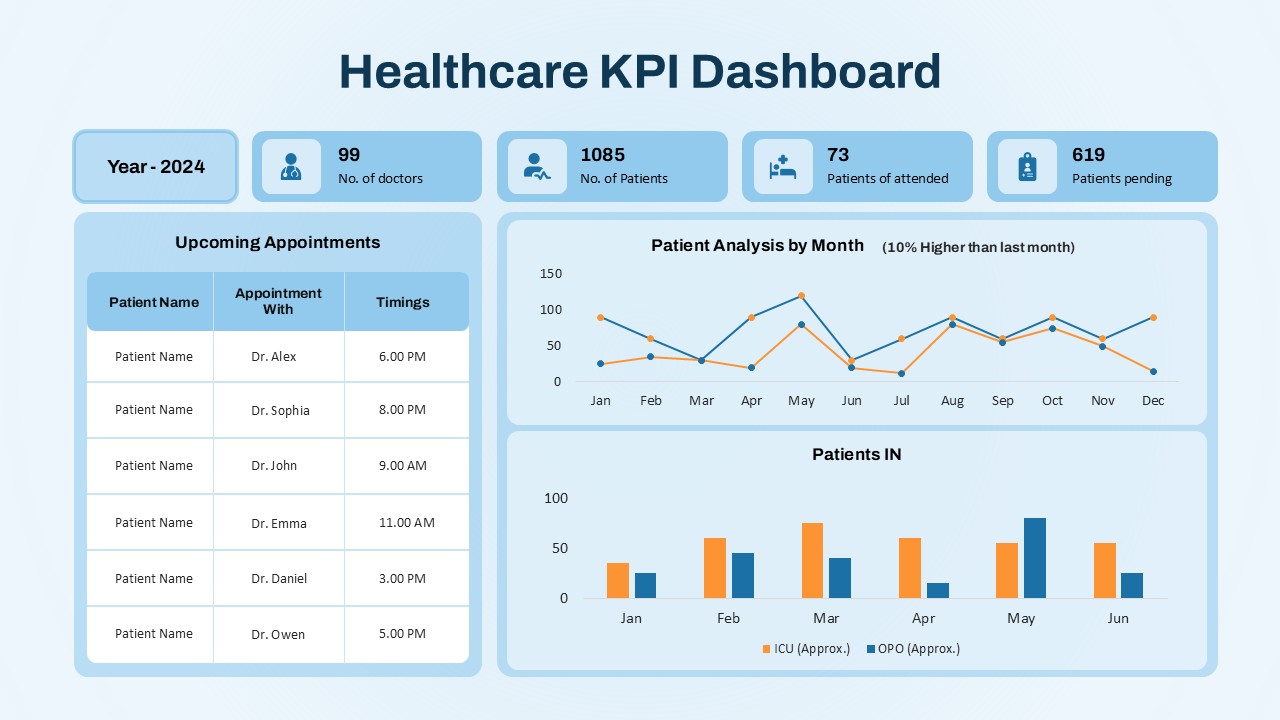
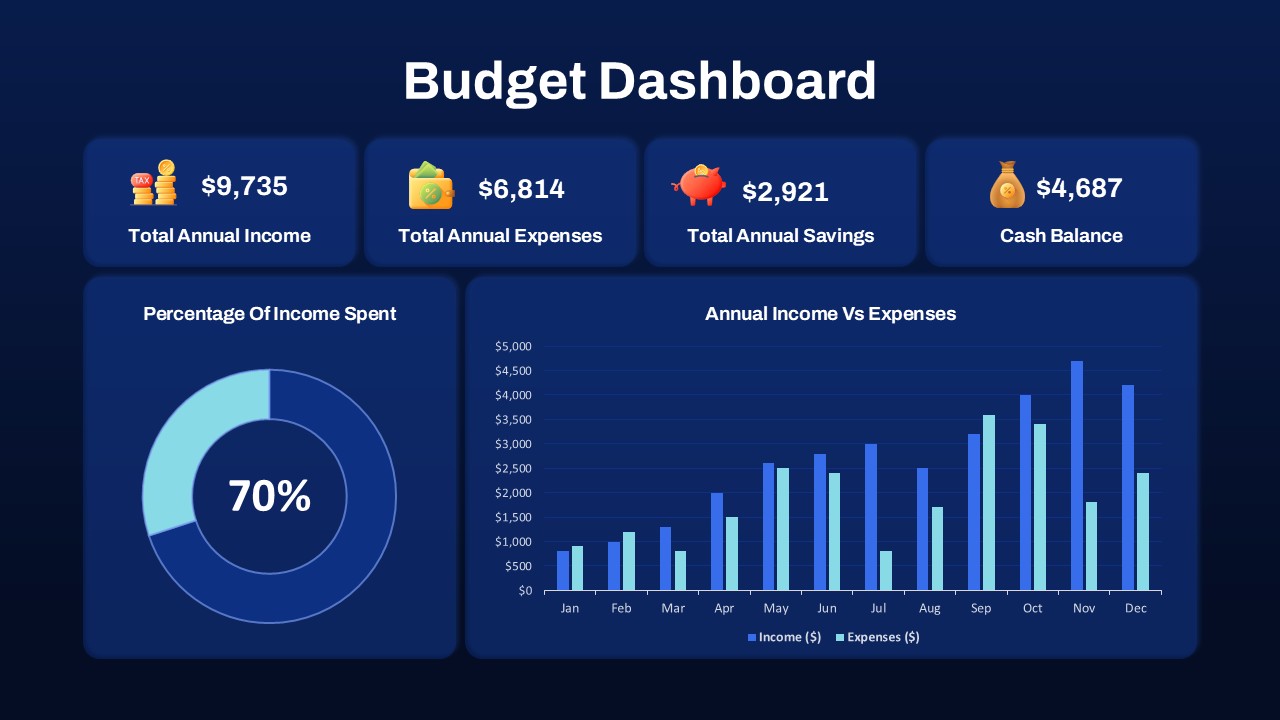
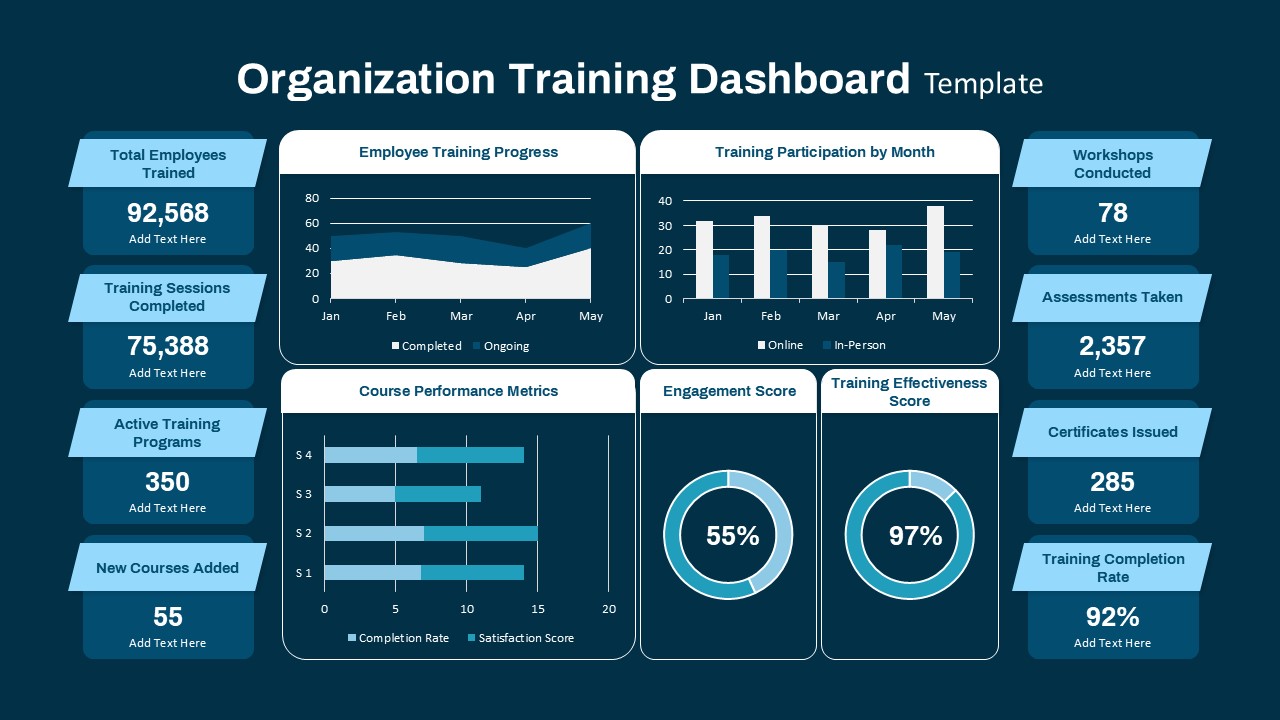
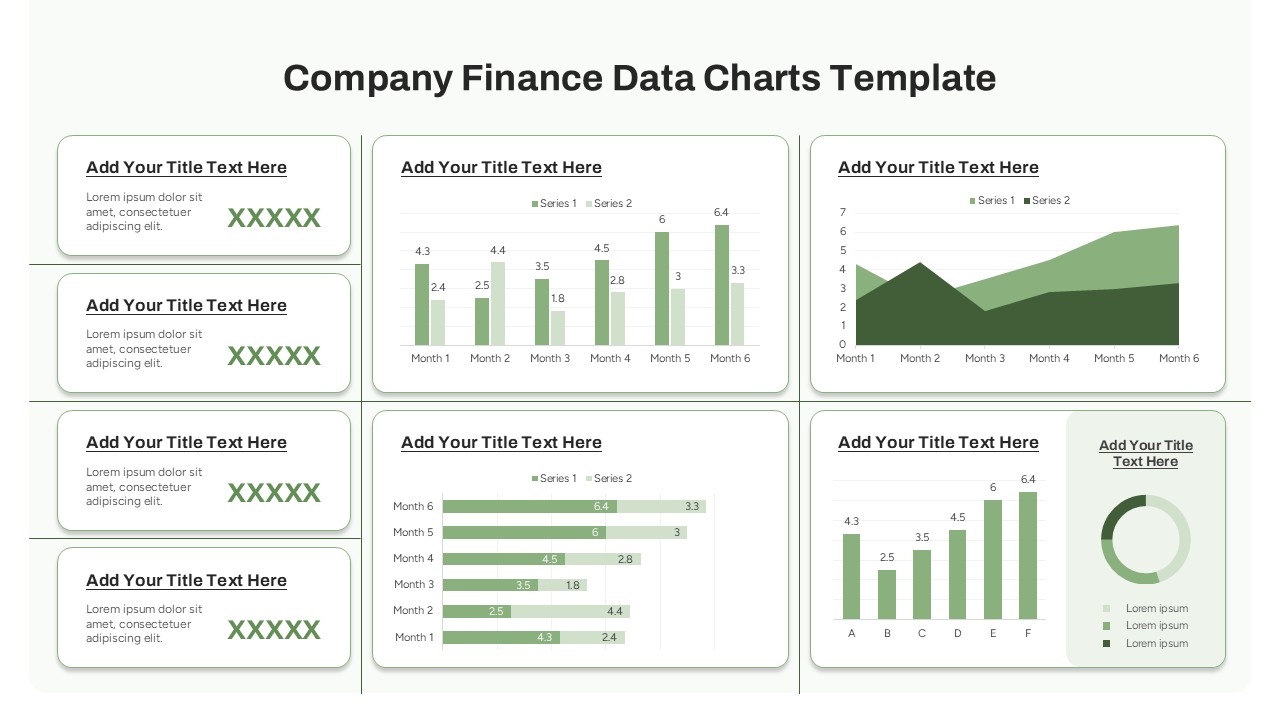
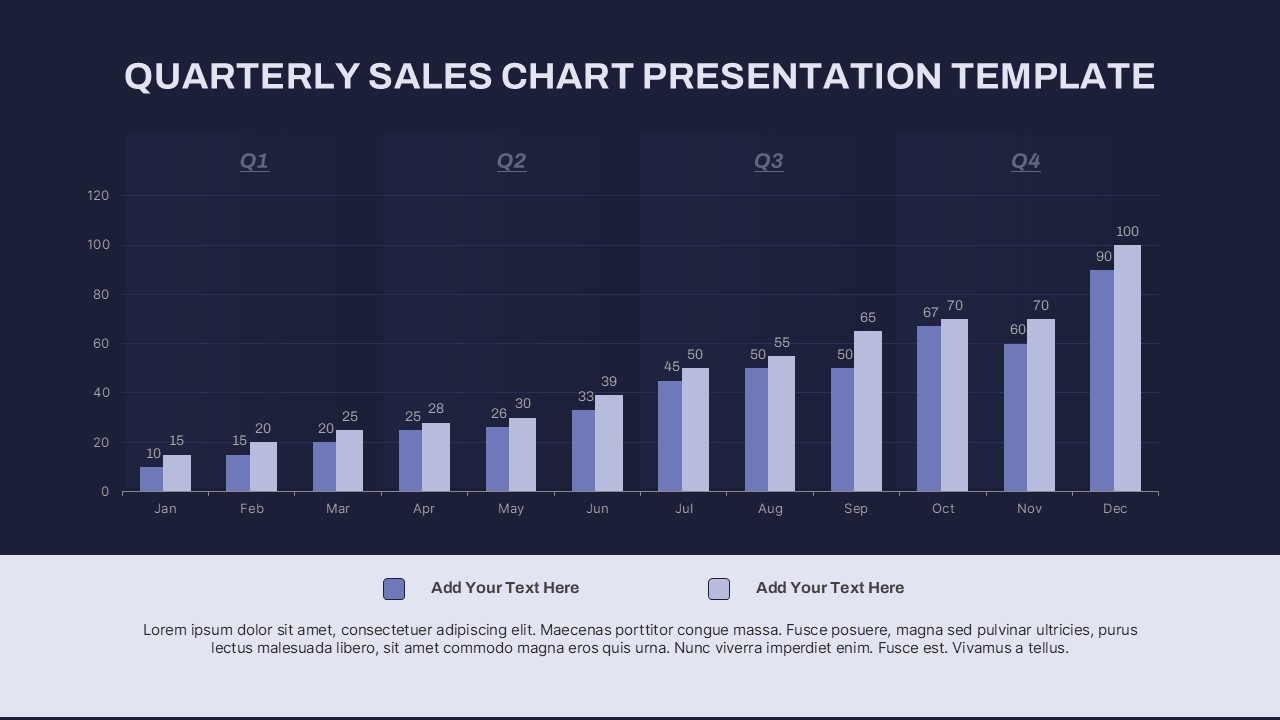
This sales forecasting dashboard slide offers a visually compelling overview of critical business performance metrics. Designed to support data-driven decision-making, the slide integrates core indicators such as total sales revenue, customer base, and sales forecast in prominent, color-coded blocks. It features a smooth, upward-trending growth chart from 2021 to 2025, enabling presenters to highlight business trajectory and strategic milestones. Additionally, the bottom segment delivers granular insight into revenue contributions from key products—like Omni Cloud, Alpha Series, and Delta Pack—using a bifurcated table format that simplifies comparisons.
With its vibrant layout and modern card design, this template delivers information with clarity and visual impact. Each element is fully editable, allowing teams to easily update figures, adjust timeframes, or rebrand visuals. The color-coded cards and gradient backgrounds enhance data segmentation and audience engagement while maintaining a polished, corporate aesthetic.
Perfect for performance reviews, investor presentations, or quarterly planning meetings, this layout helps stakeholders grasp revenue distribution, assess customer reach, and evaluate forecast accuracy at a glance. The slide is optimized for both PowerPoint and Google Slides, ensuring seamless presentation across platforms with no formatting errors.
See more

Aspect Ratio
16:9Item ID
SKT04178
Features of this template
Other Uses
This template also suits annual reports, product performance reviews, strategic planning sessions, or client presentations. It can be adapted to show marketing ROI, investor traction metrics, or departmental financial outcomes, making it a versatile dashboard for business intelligence.
FAQs
You May Also Like These Presentation Templates


- Free
- Free

- Free
- Free

- Free

- Free