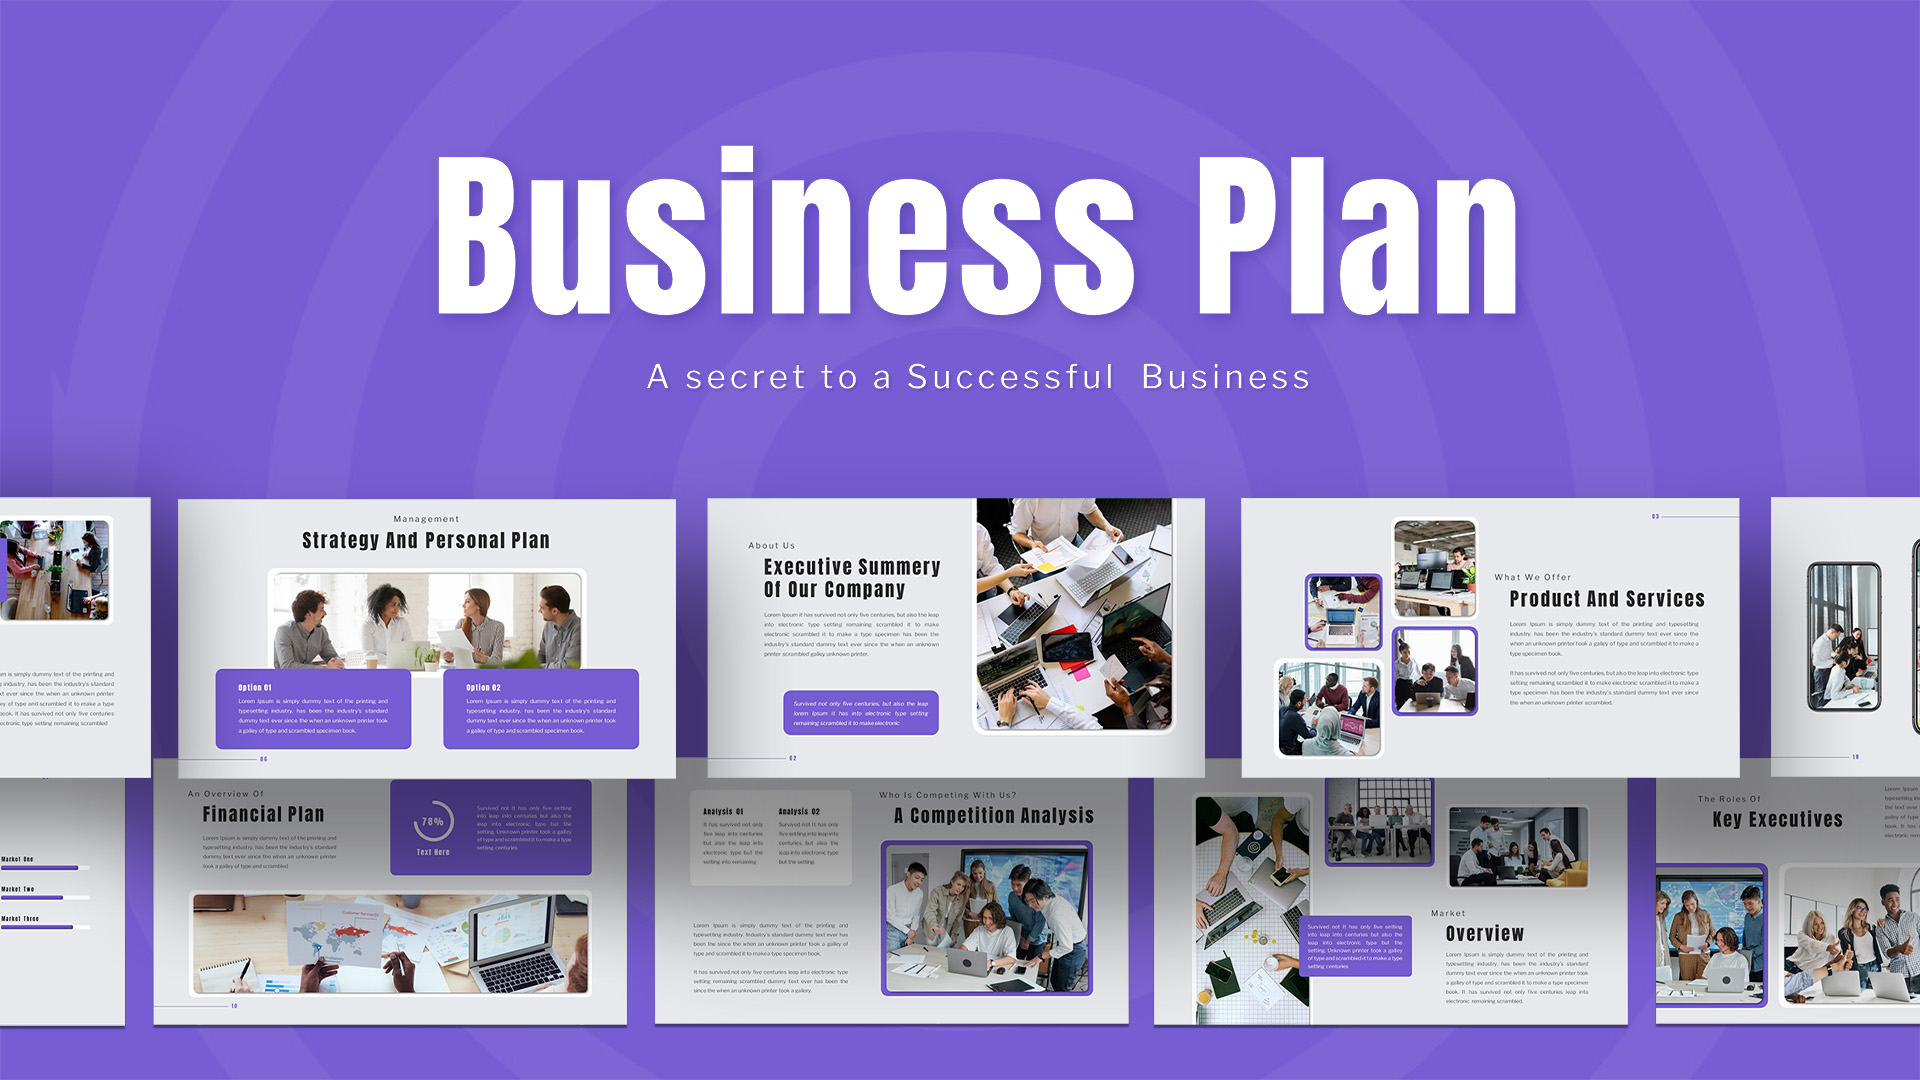
KPI Presentation Google Slides & PowerPoint Templates

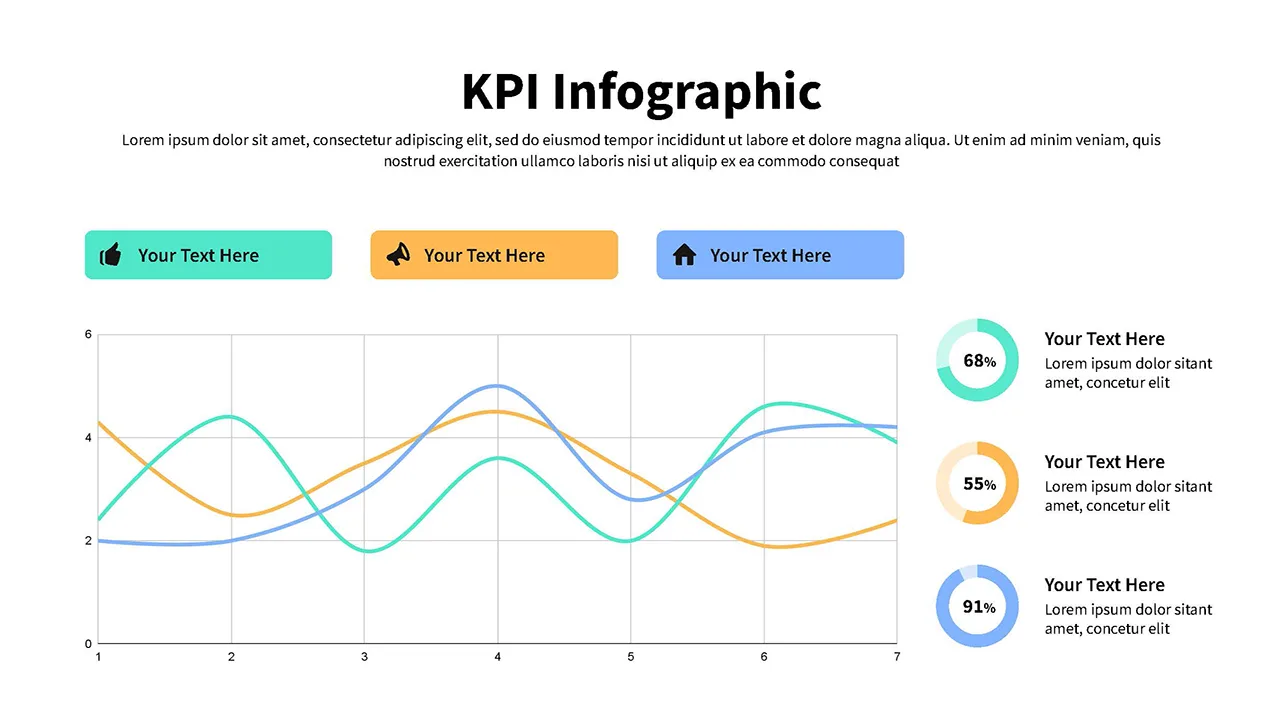

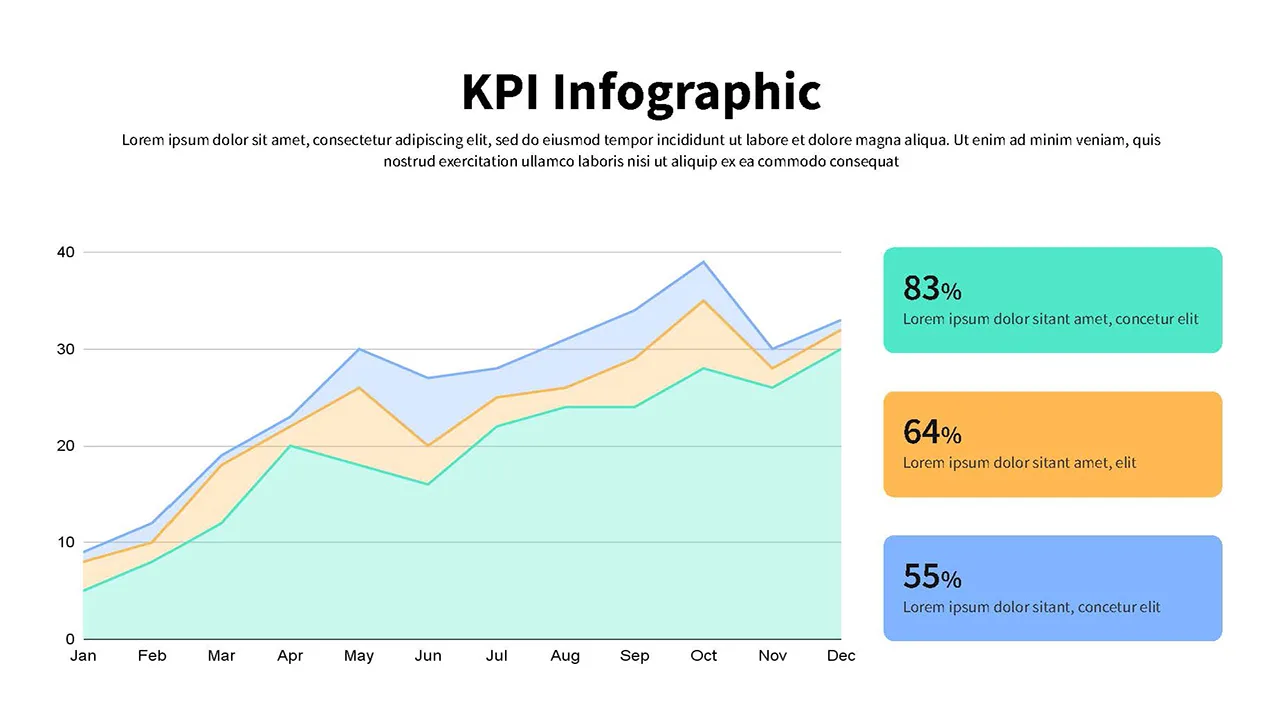
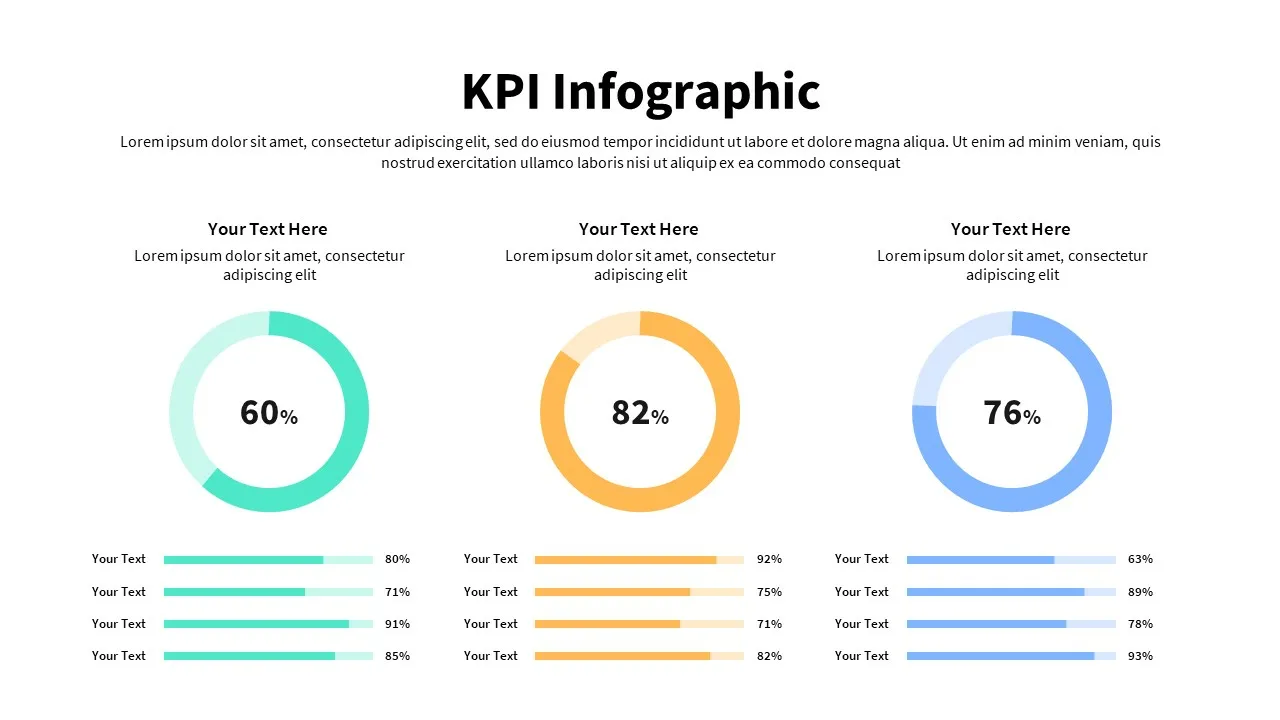
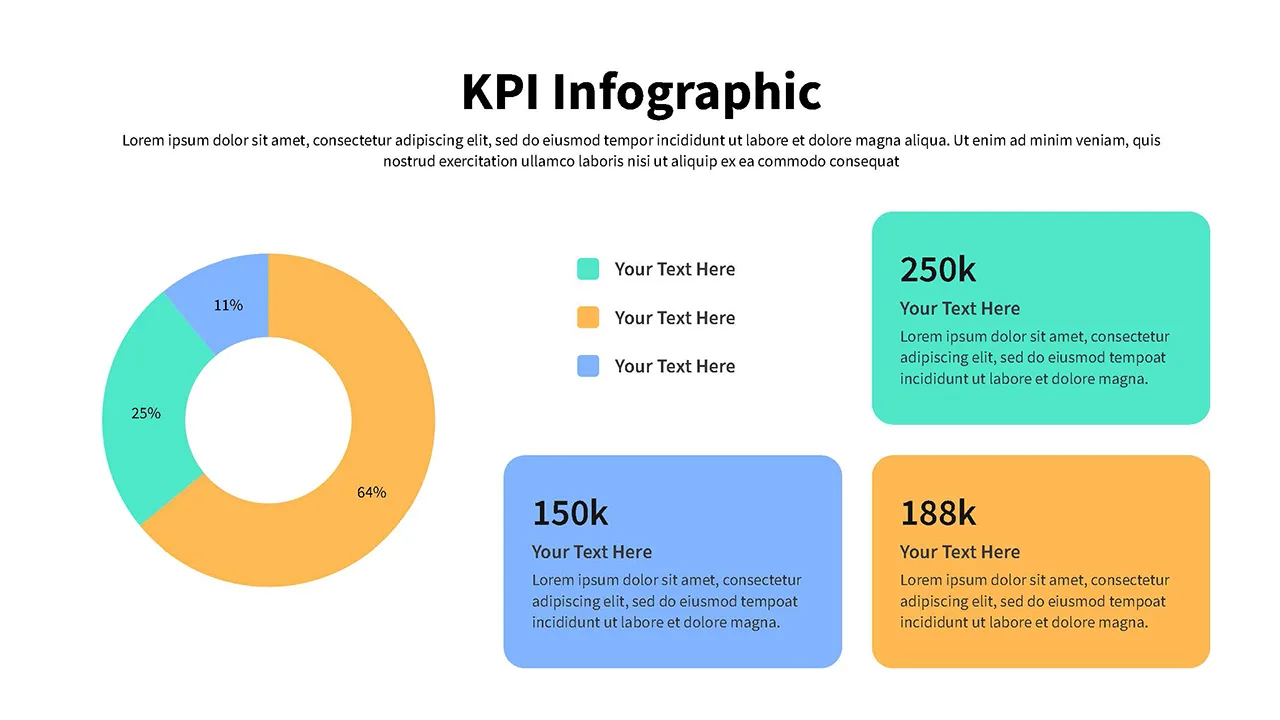
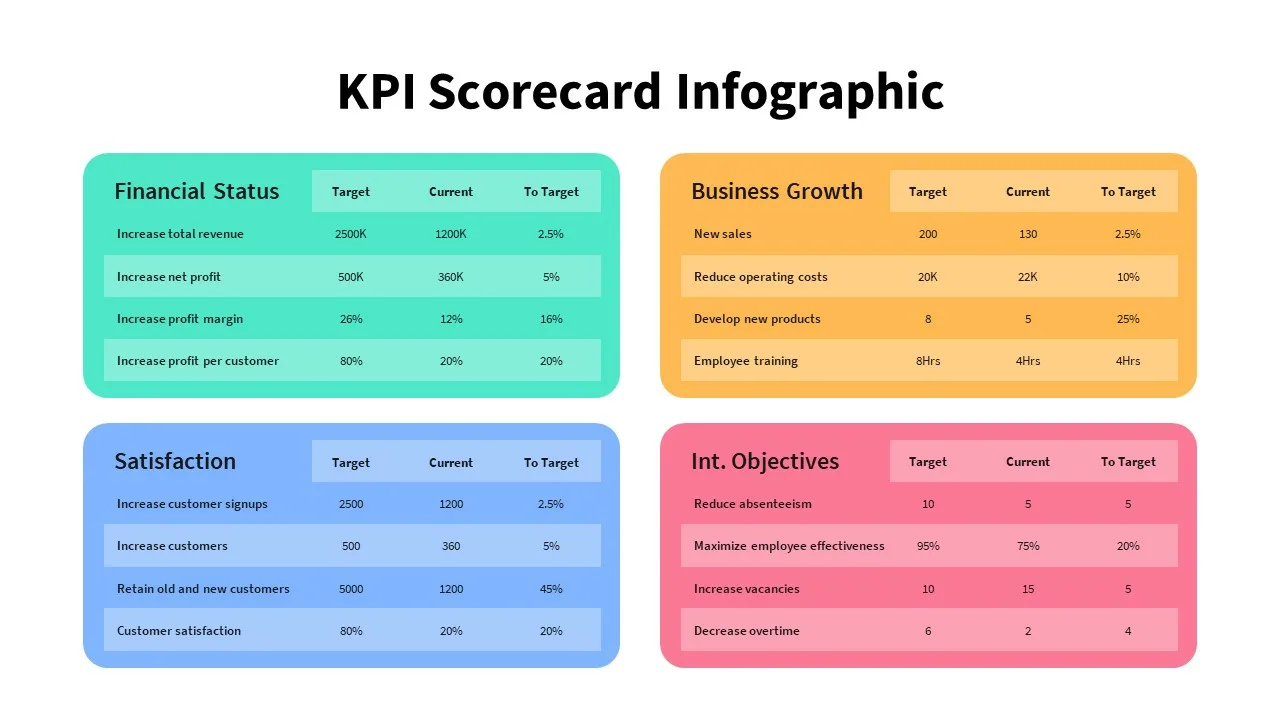
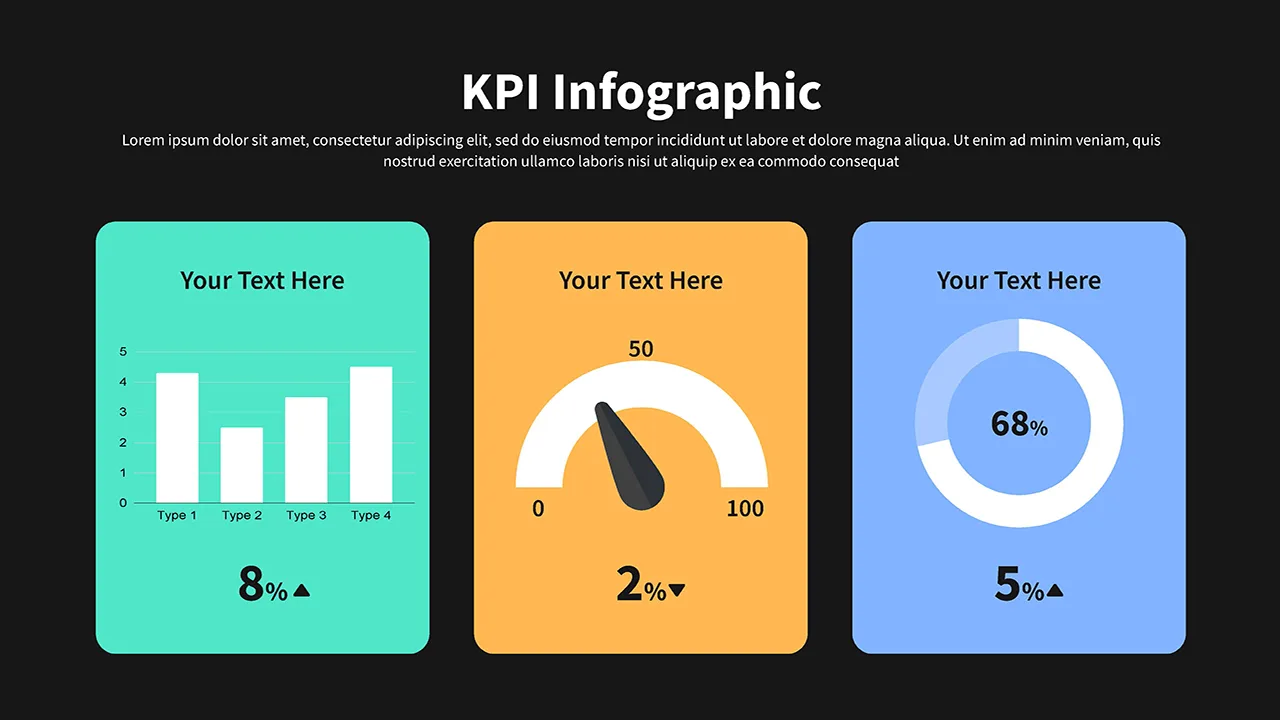
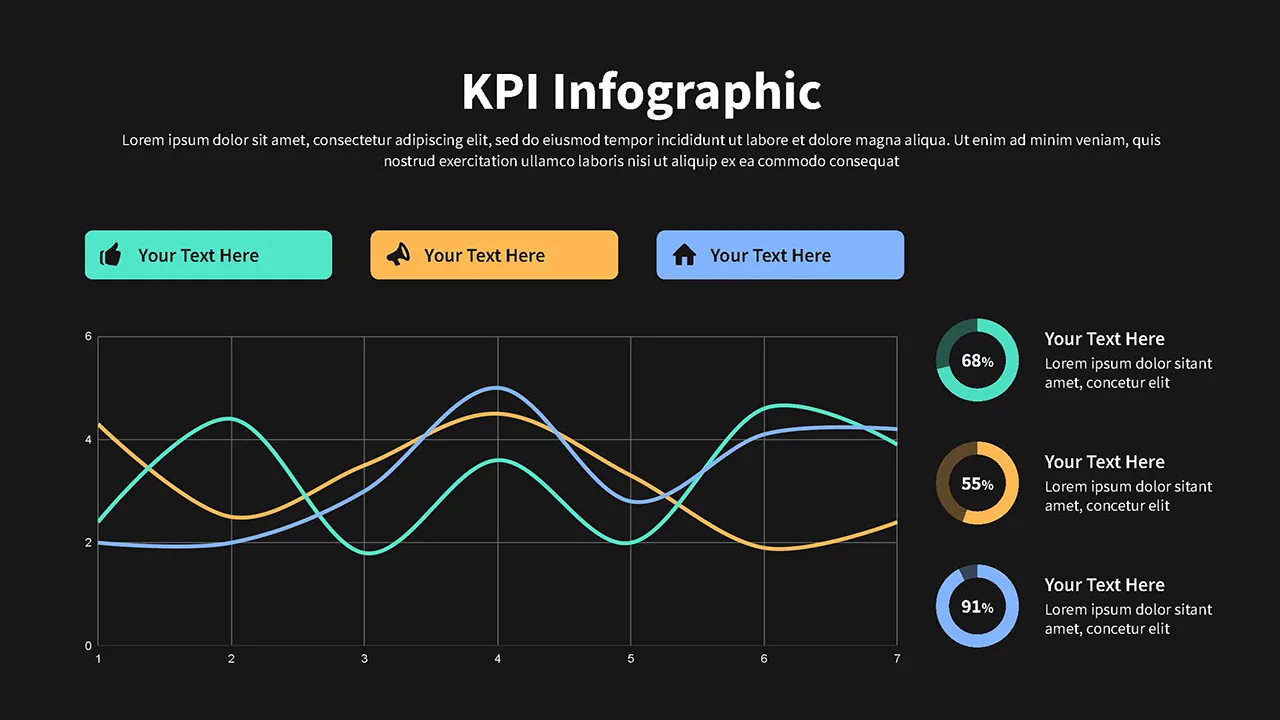
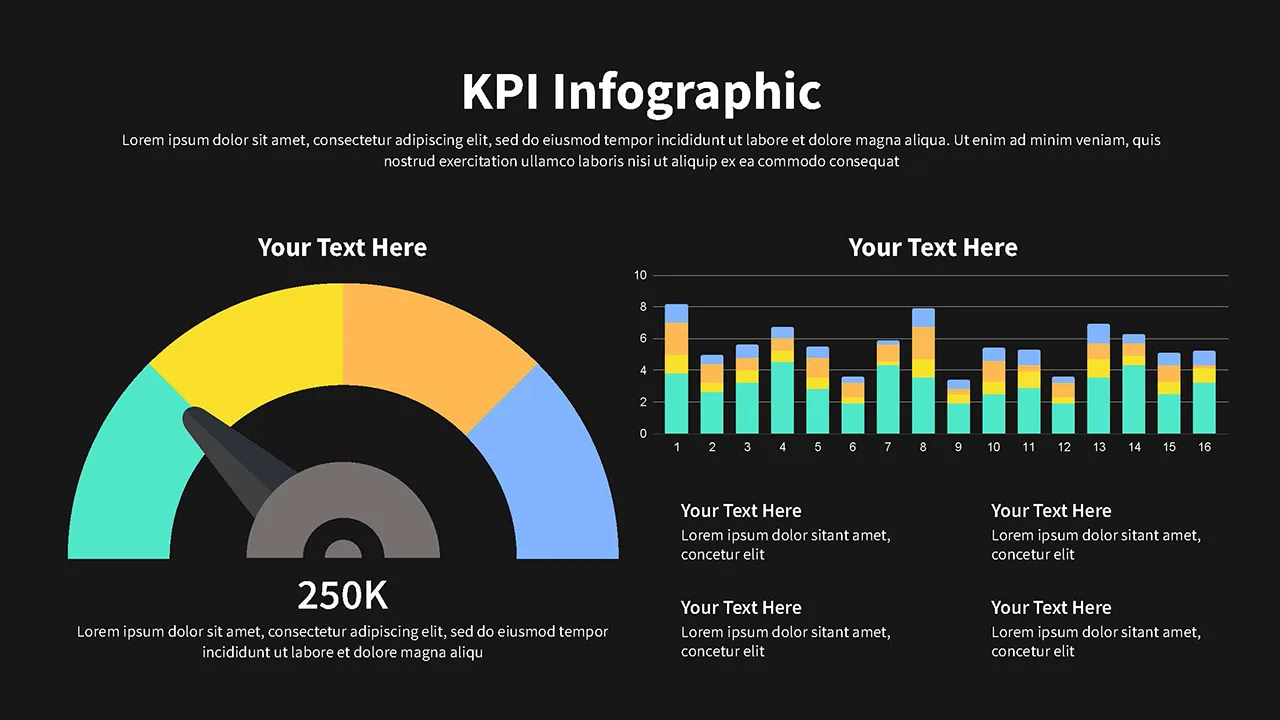
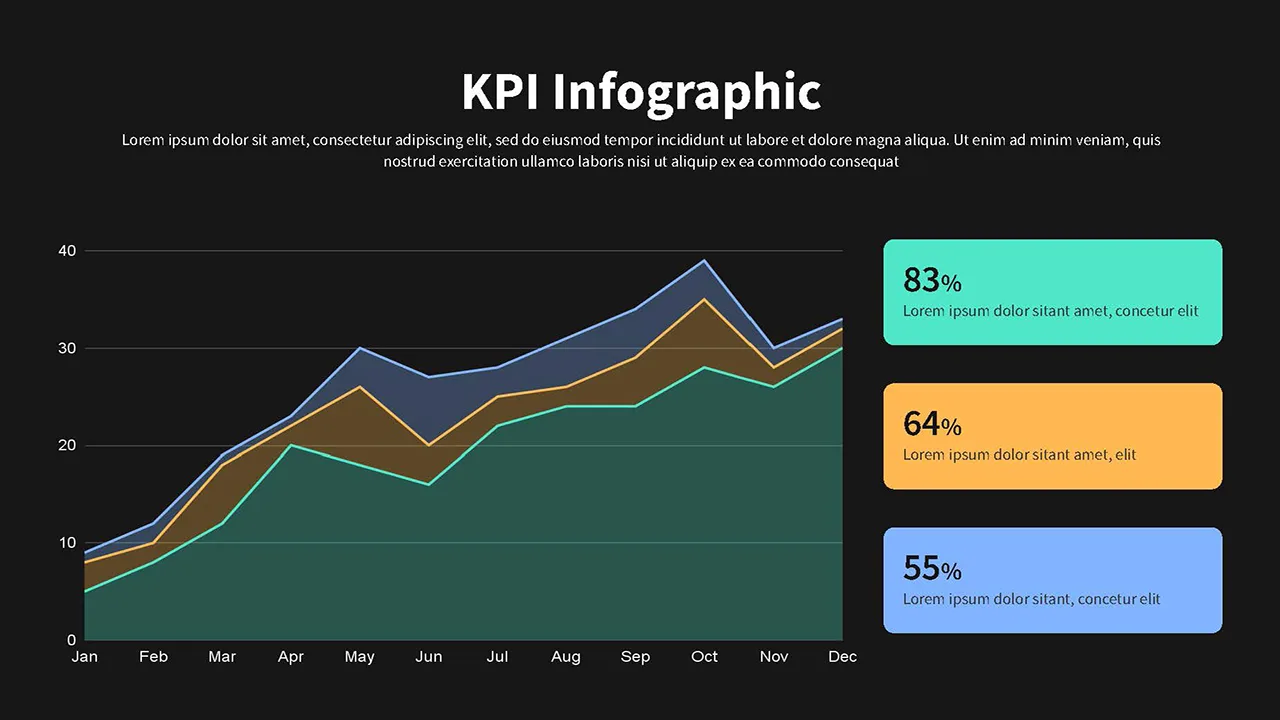
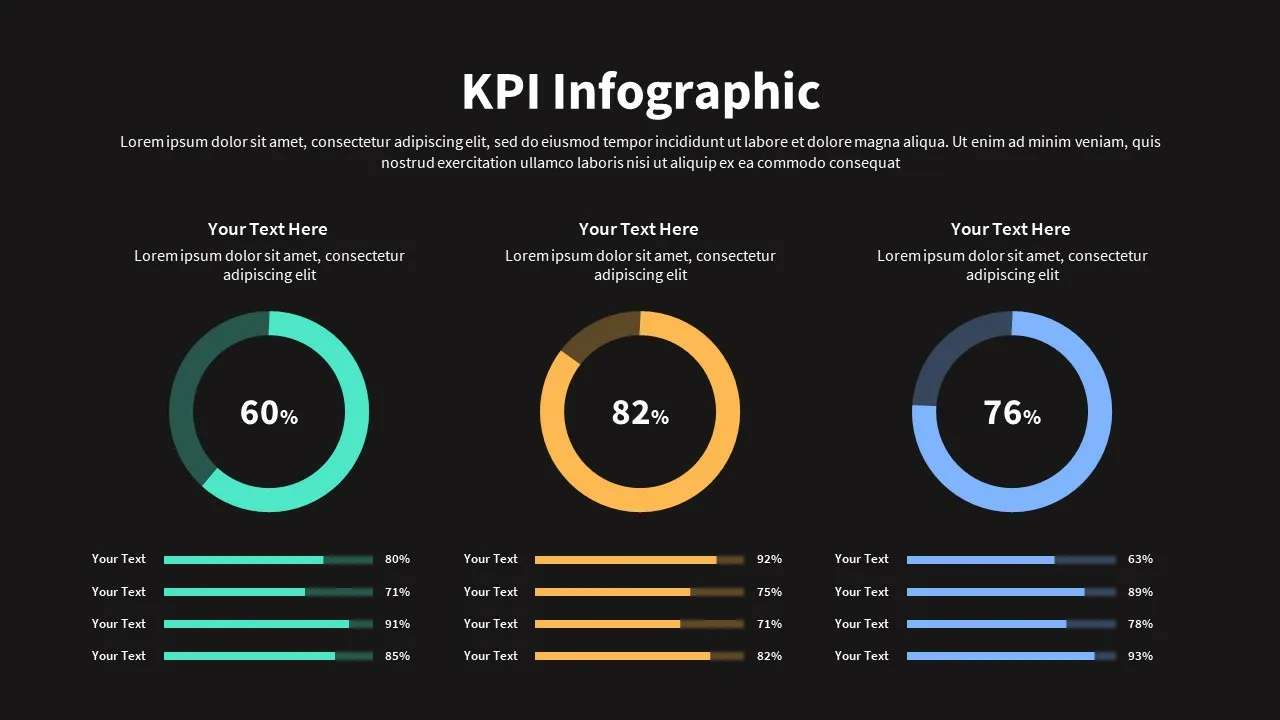

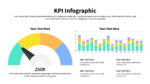


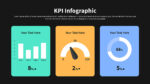
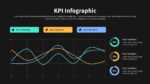

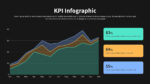
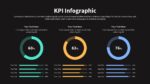
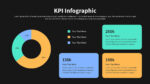
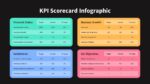
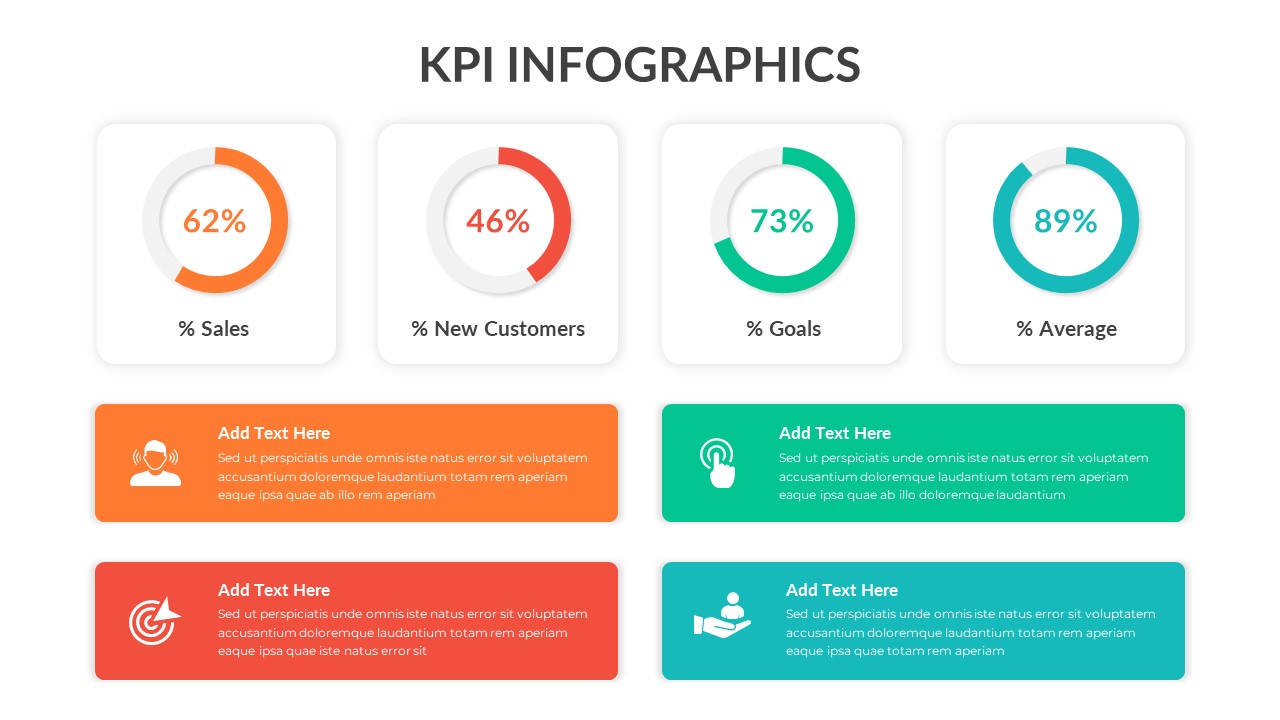
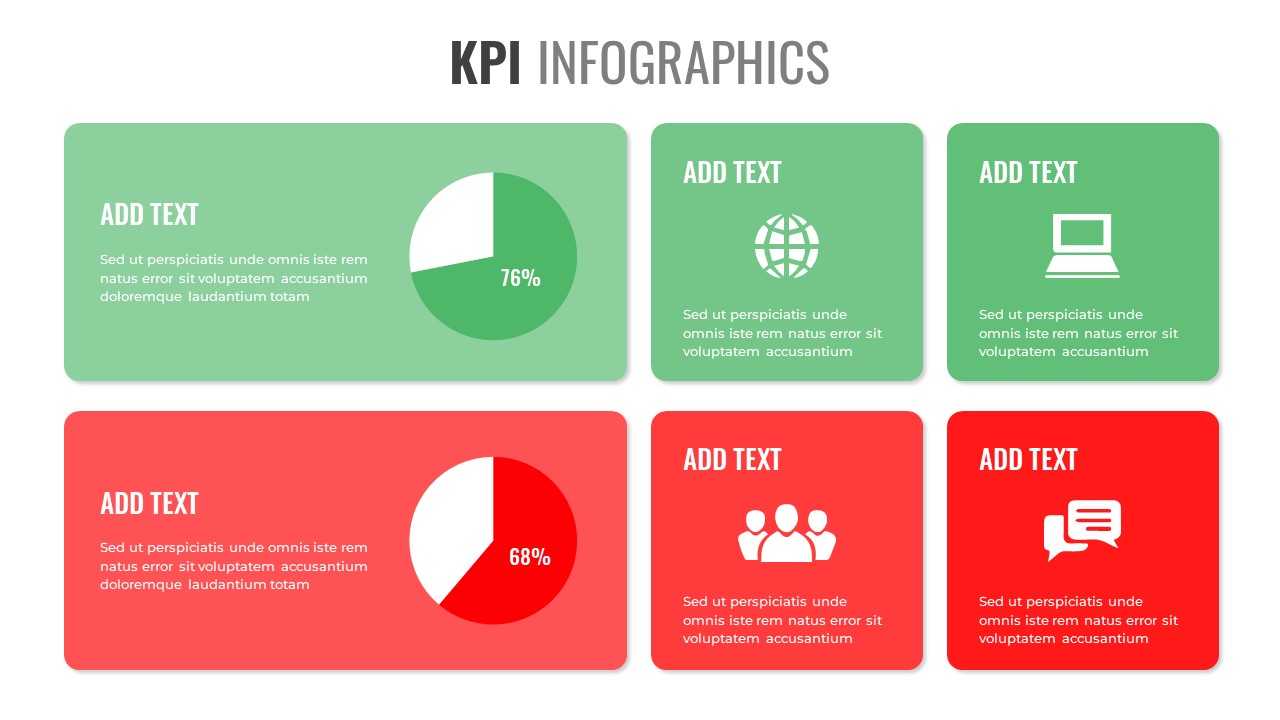
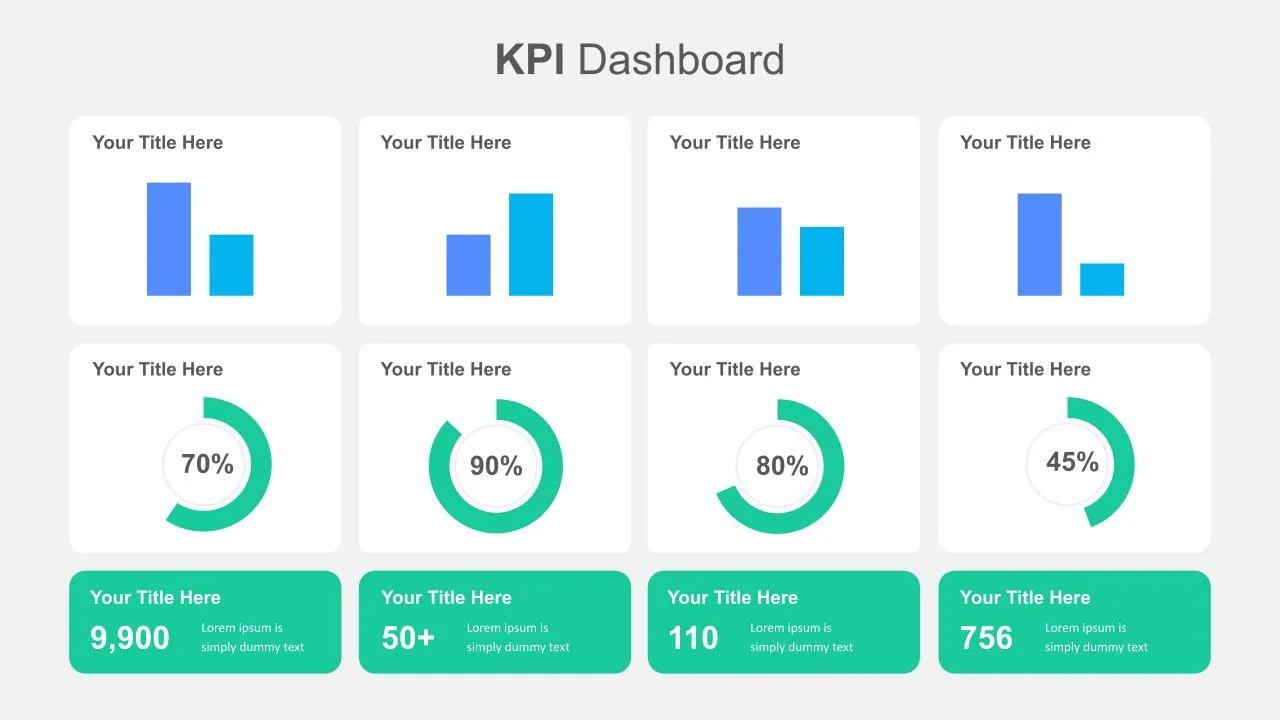
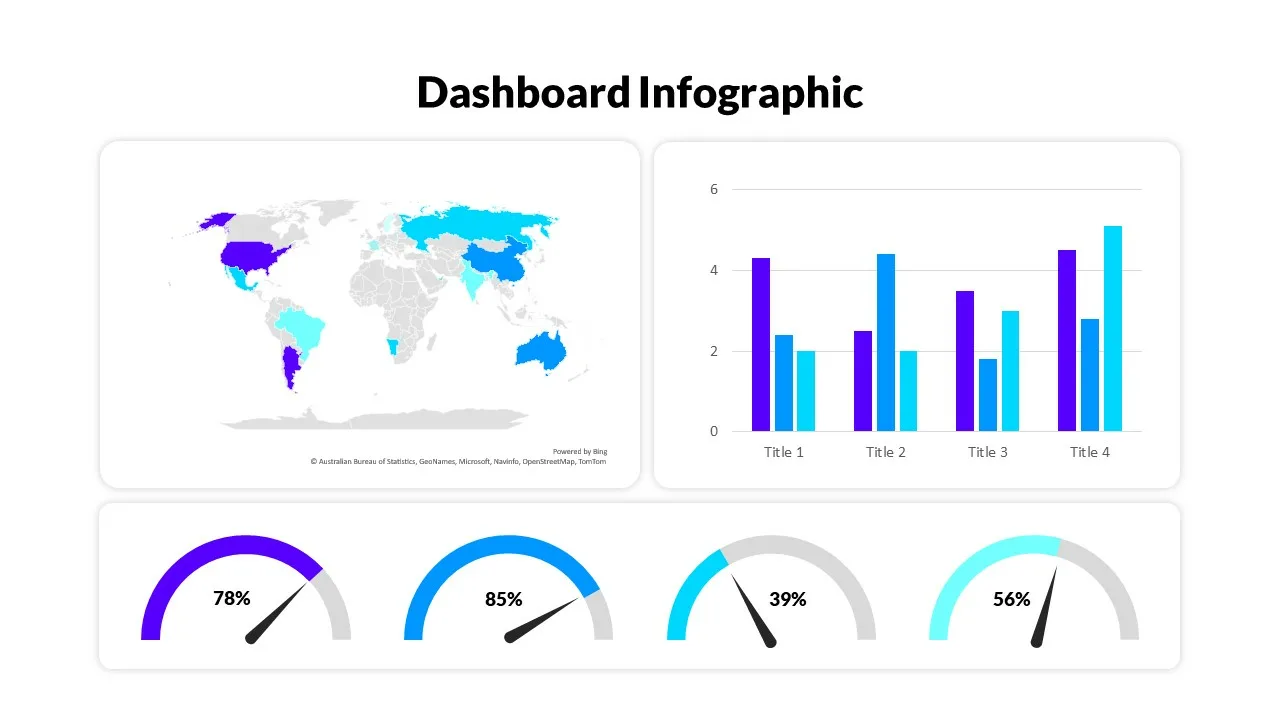
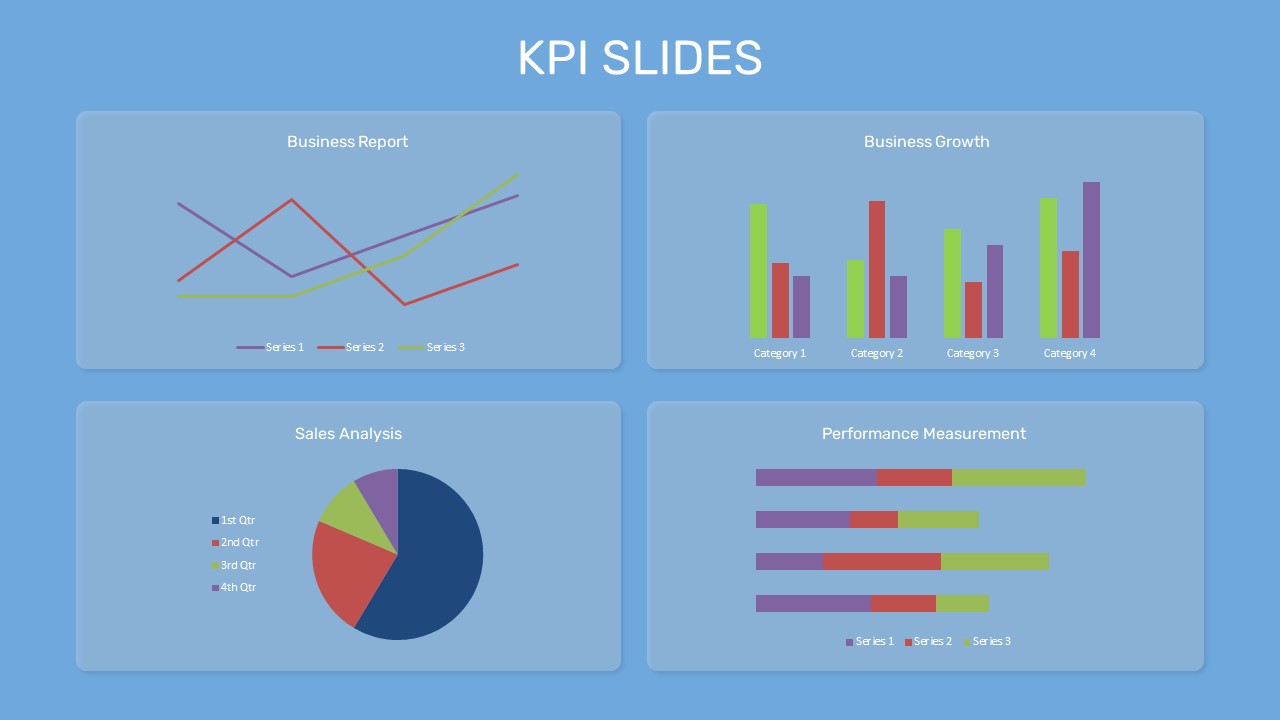
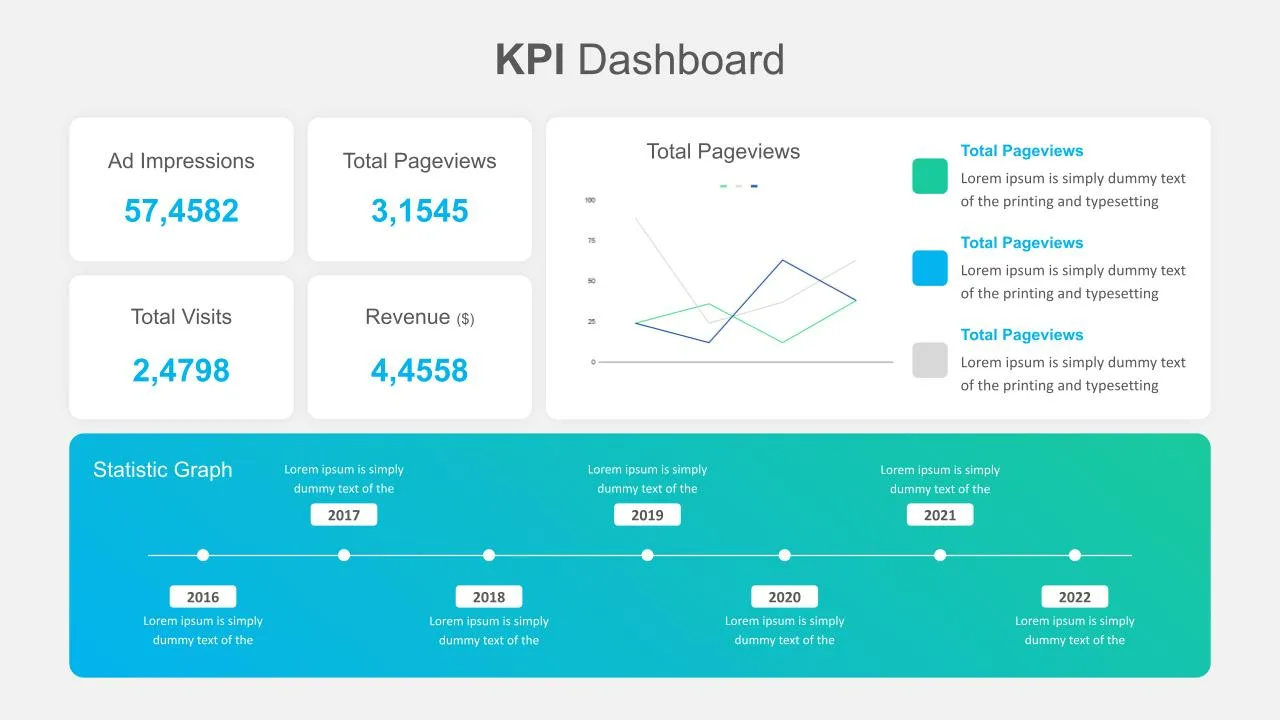
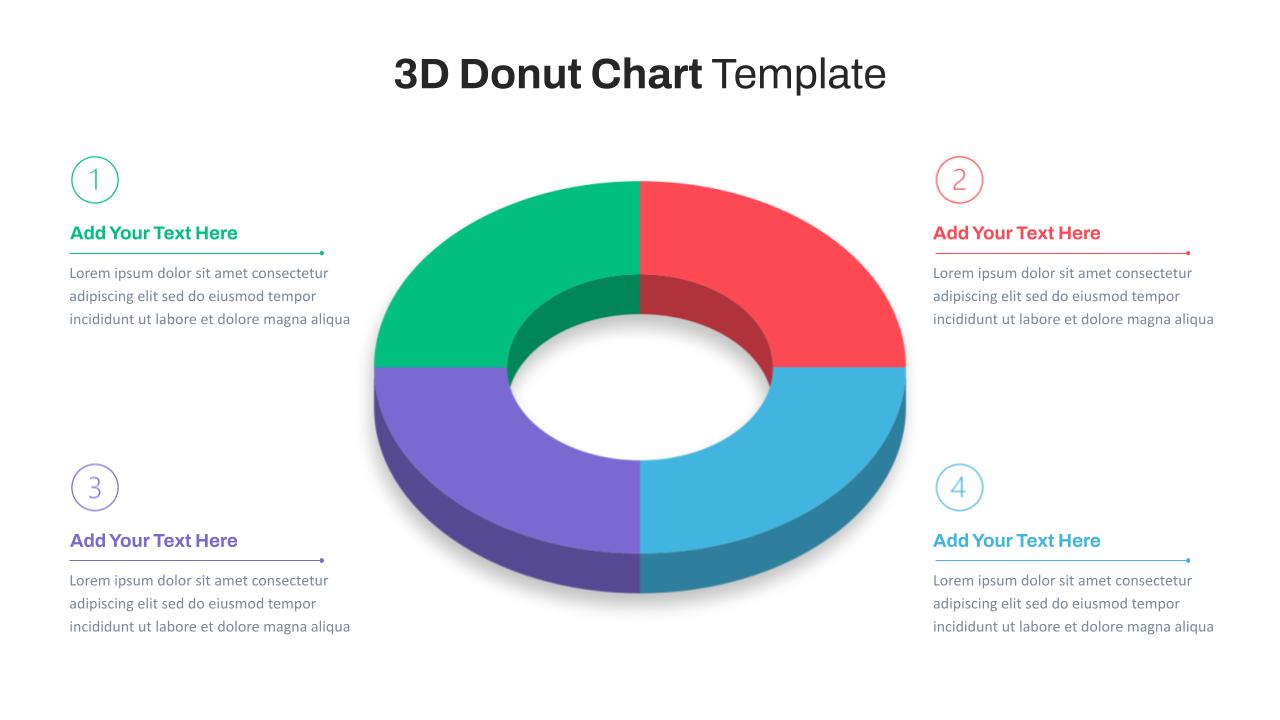
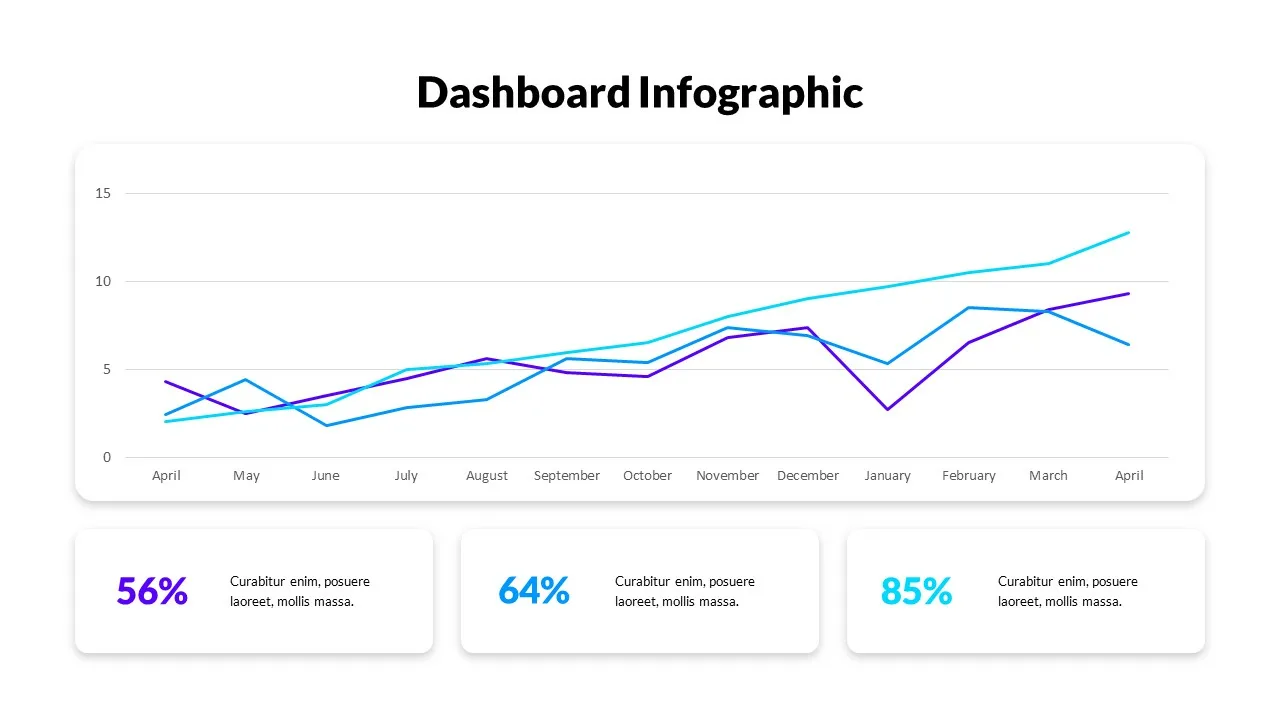
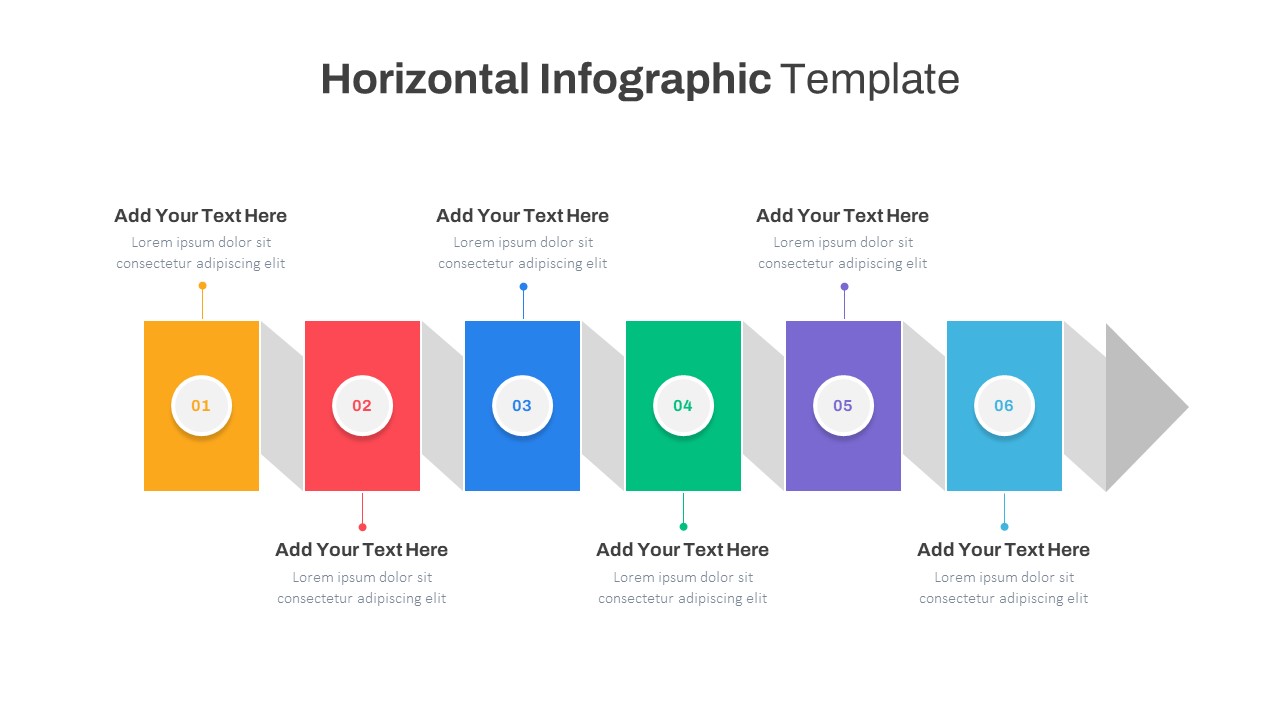
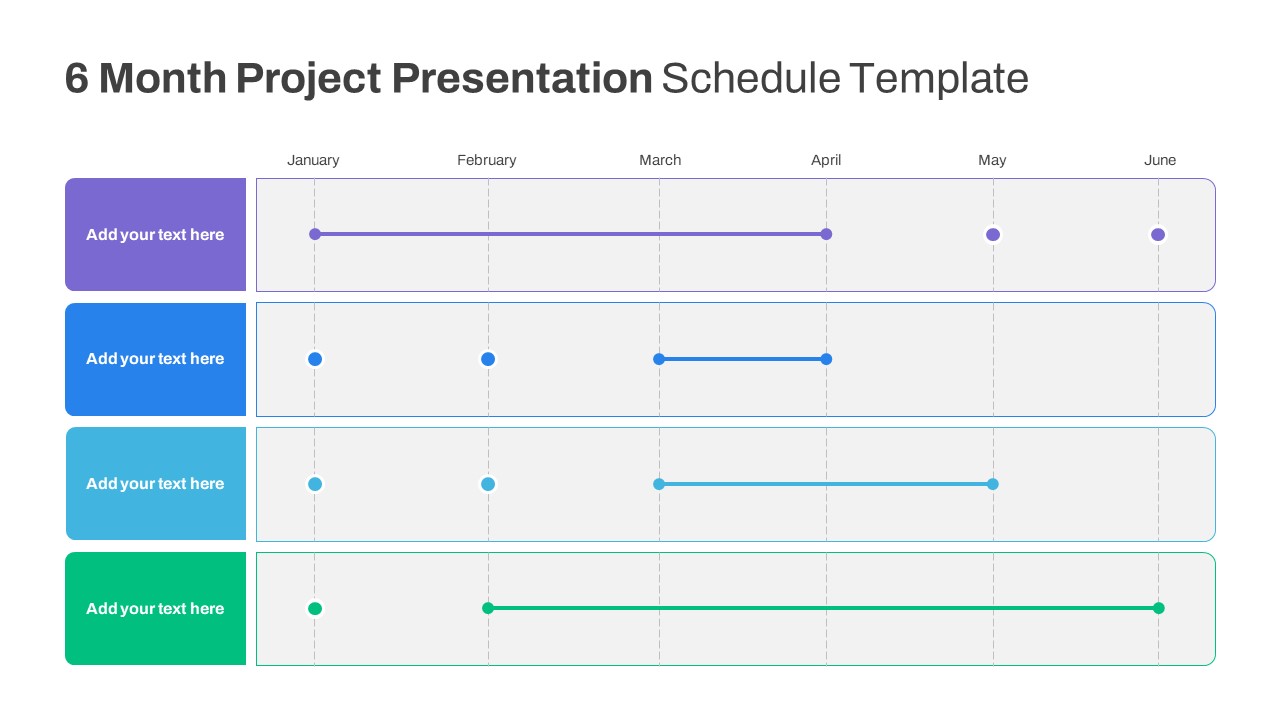
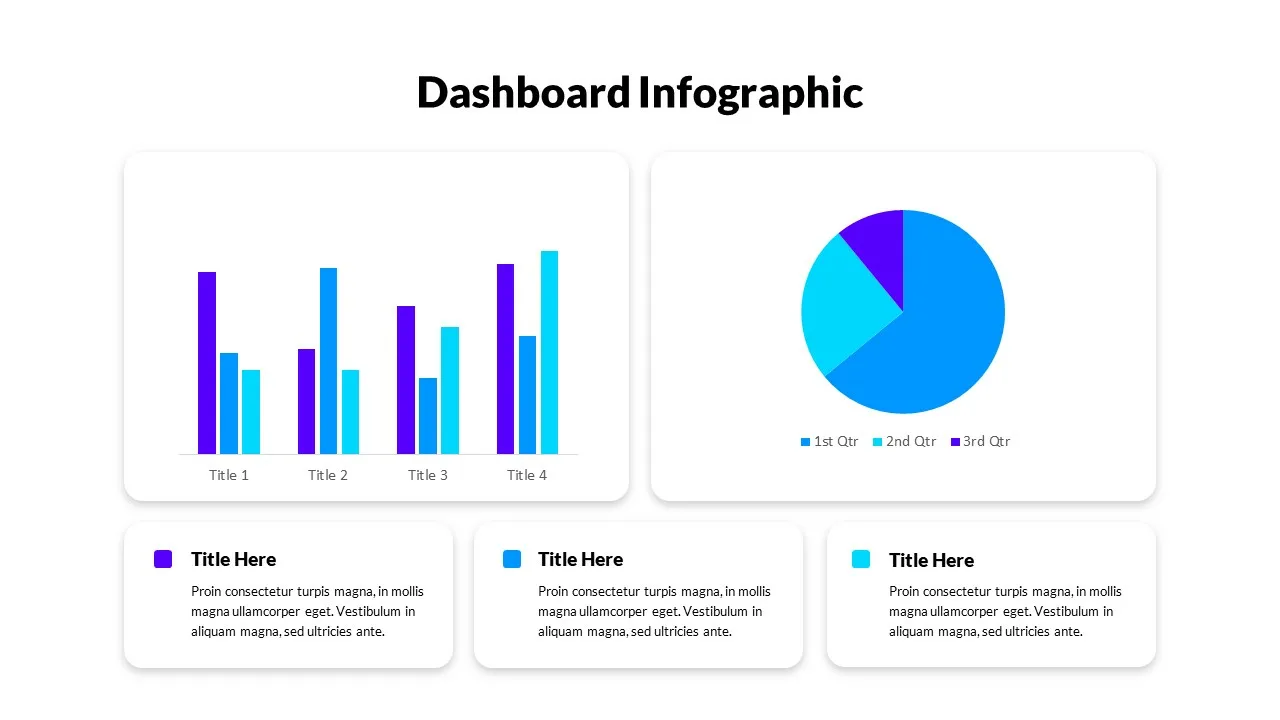
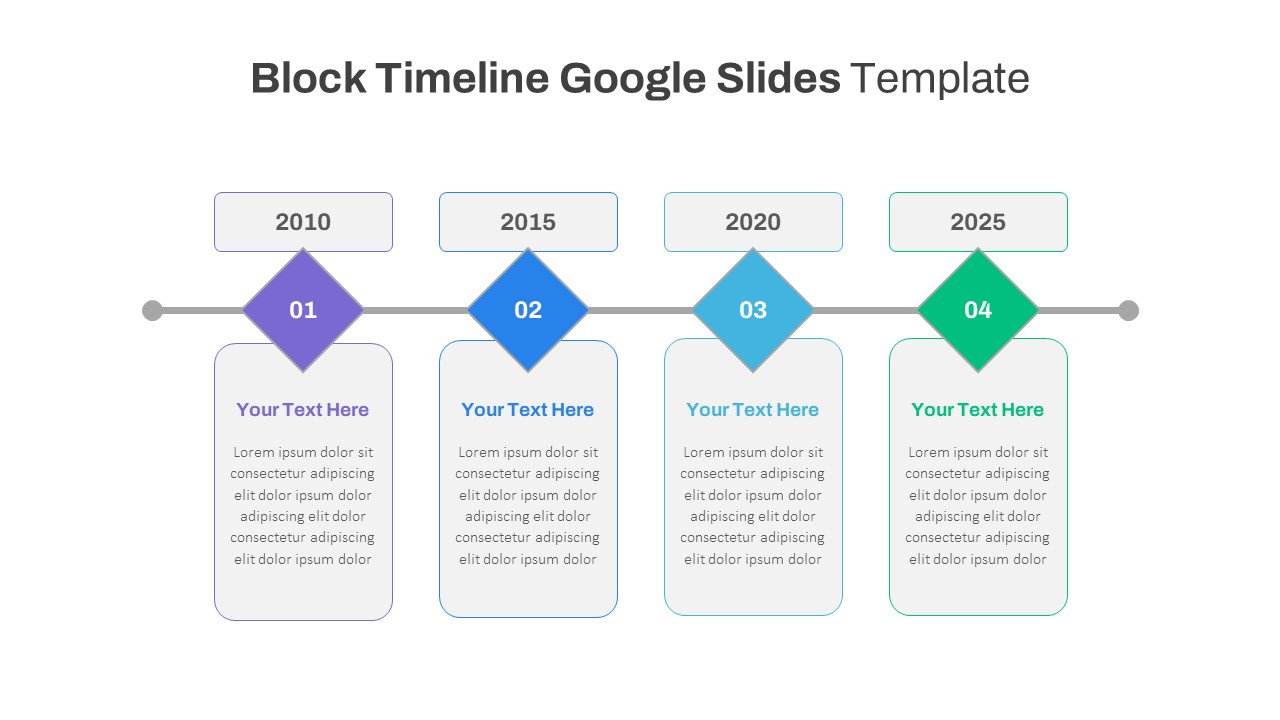
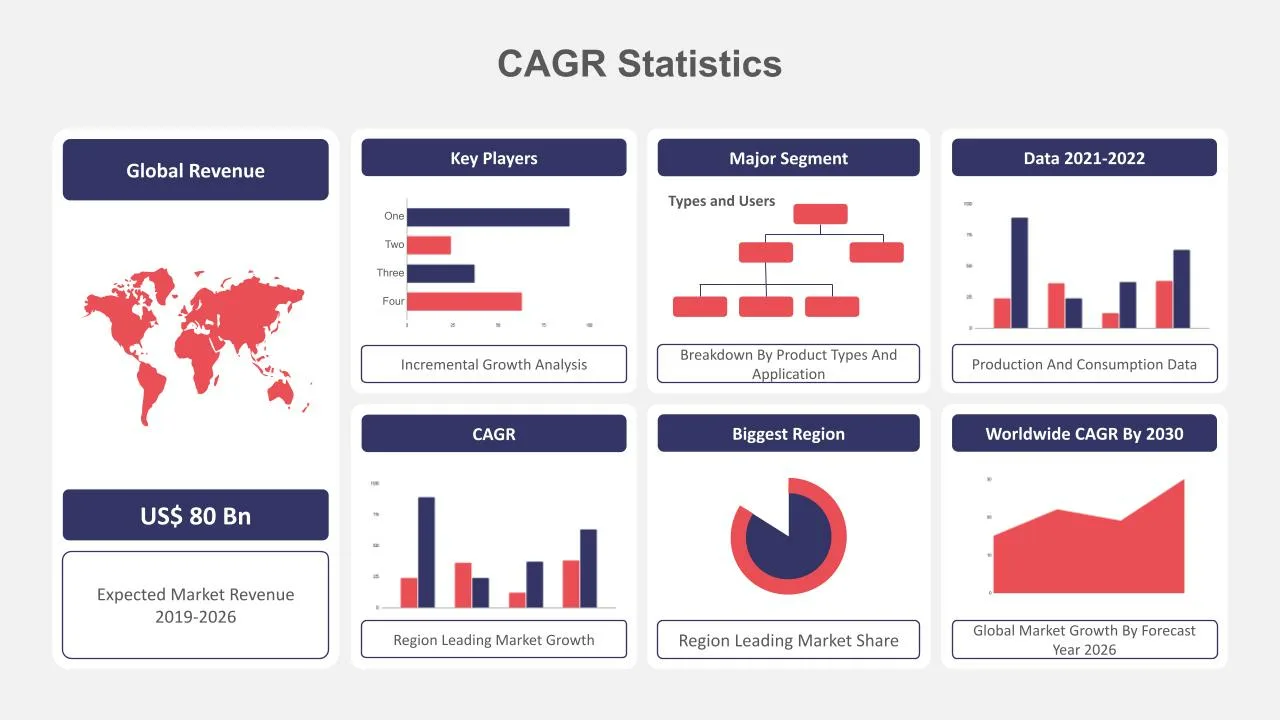
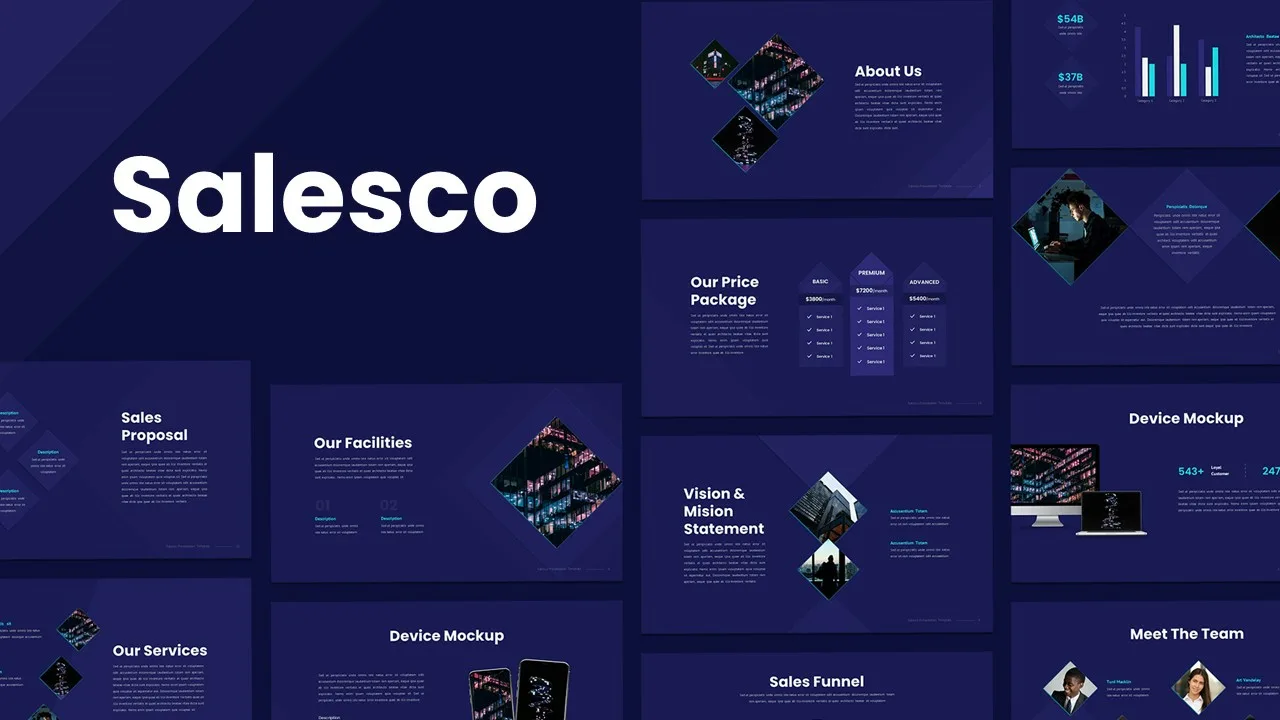
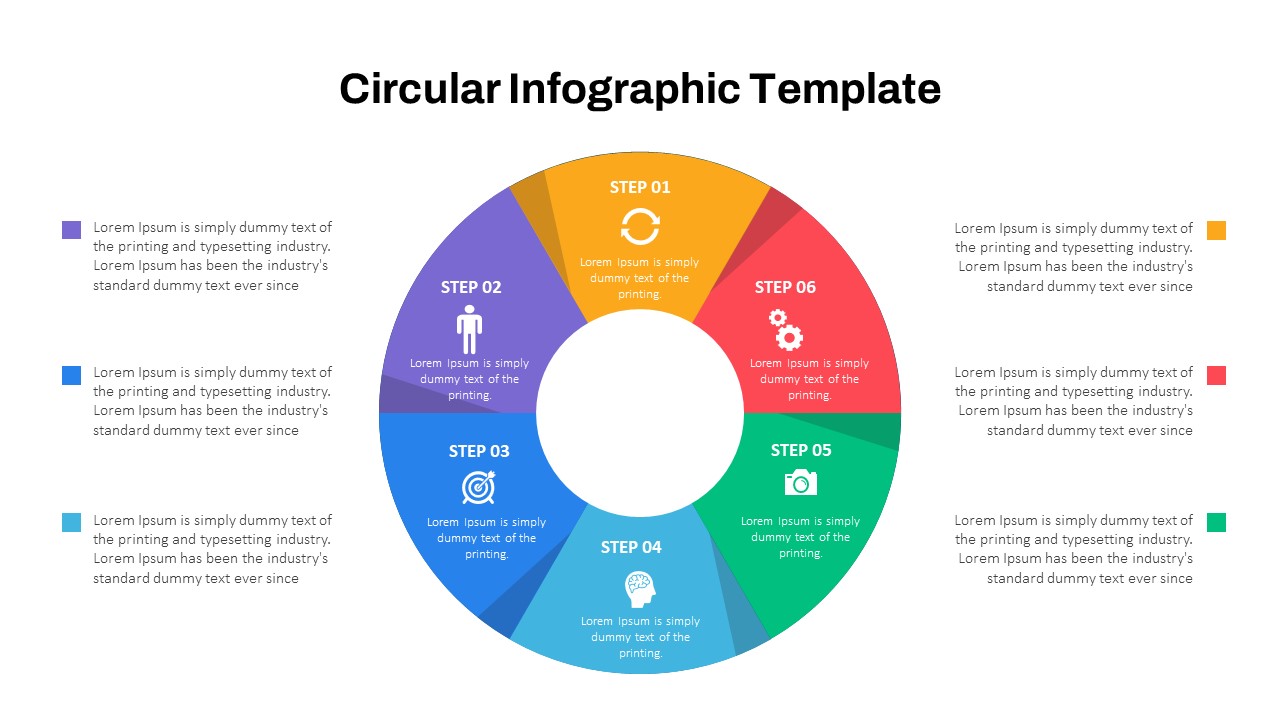
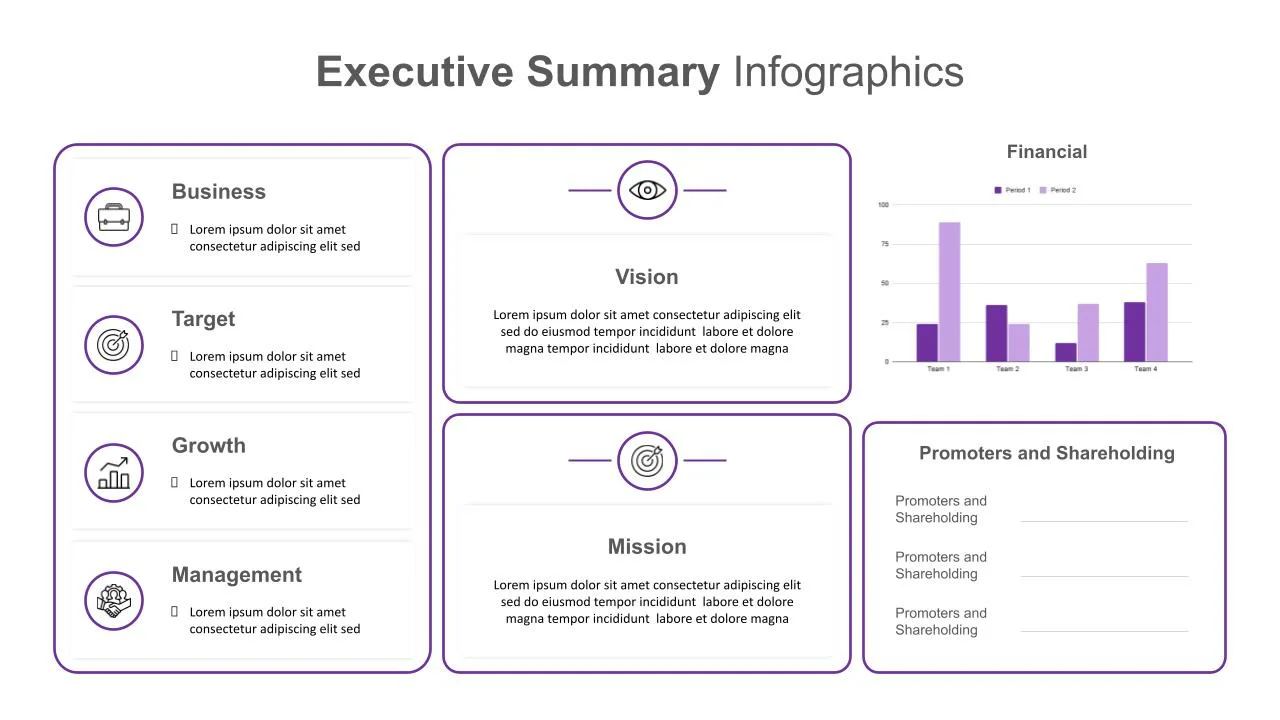
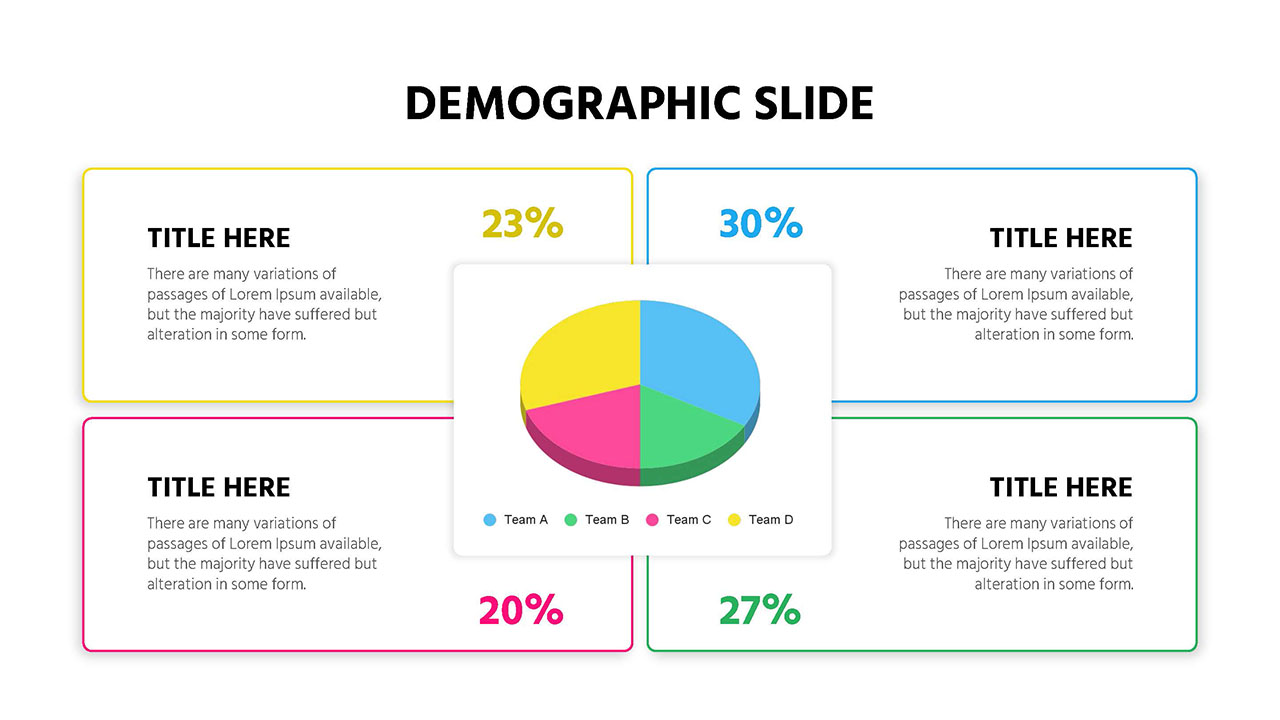
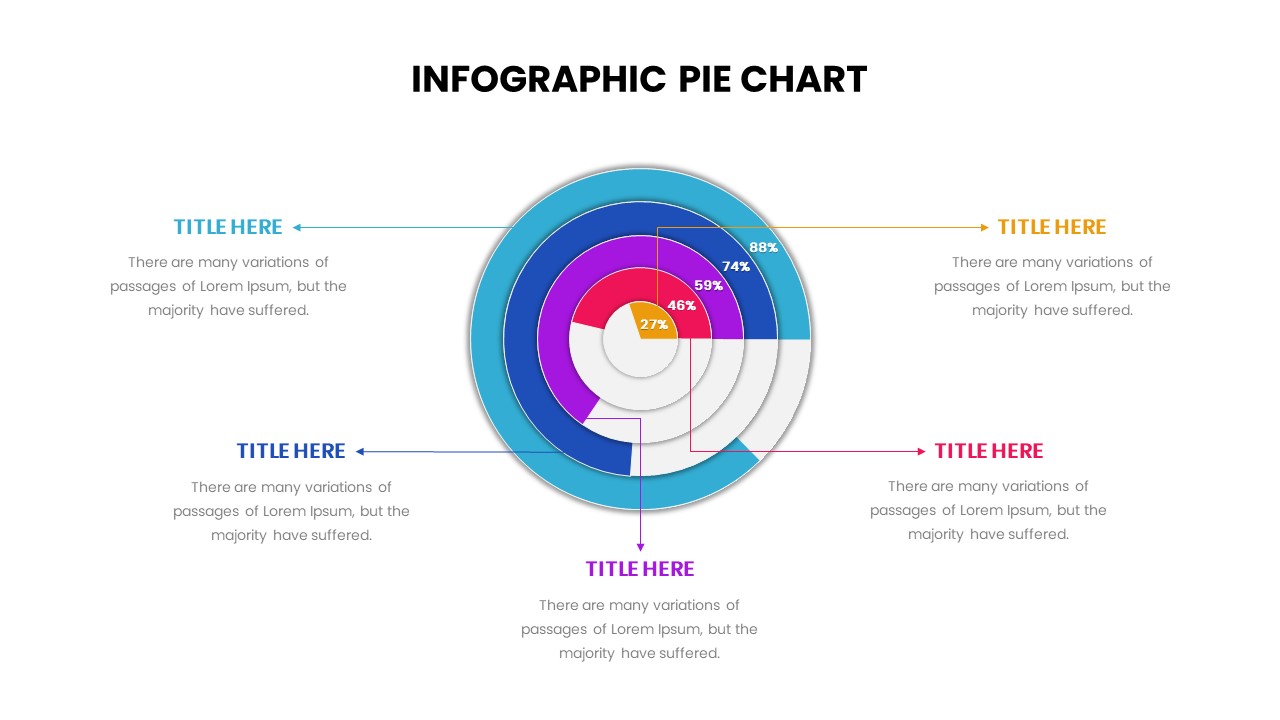
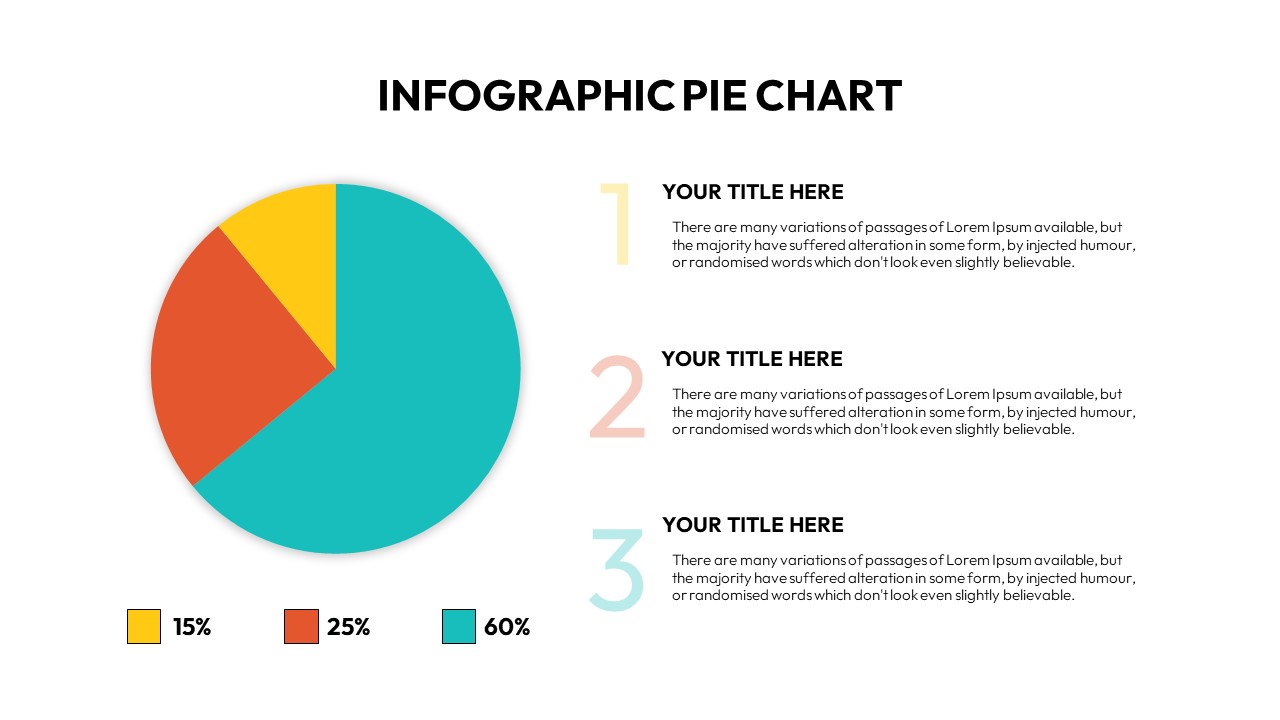
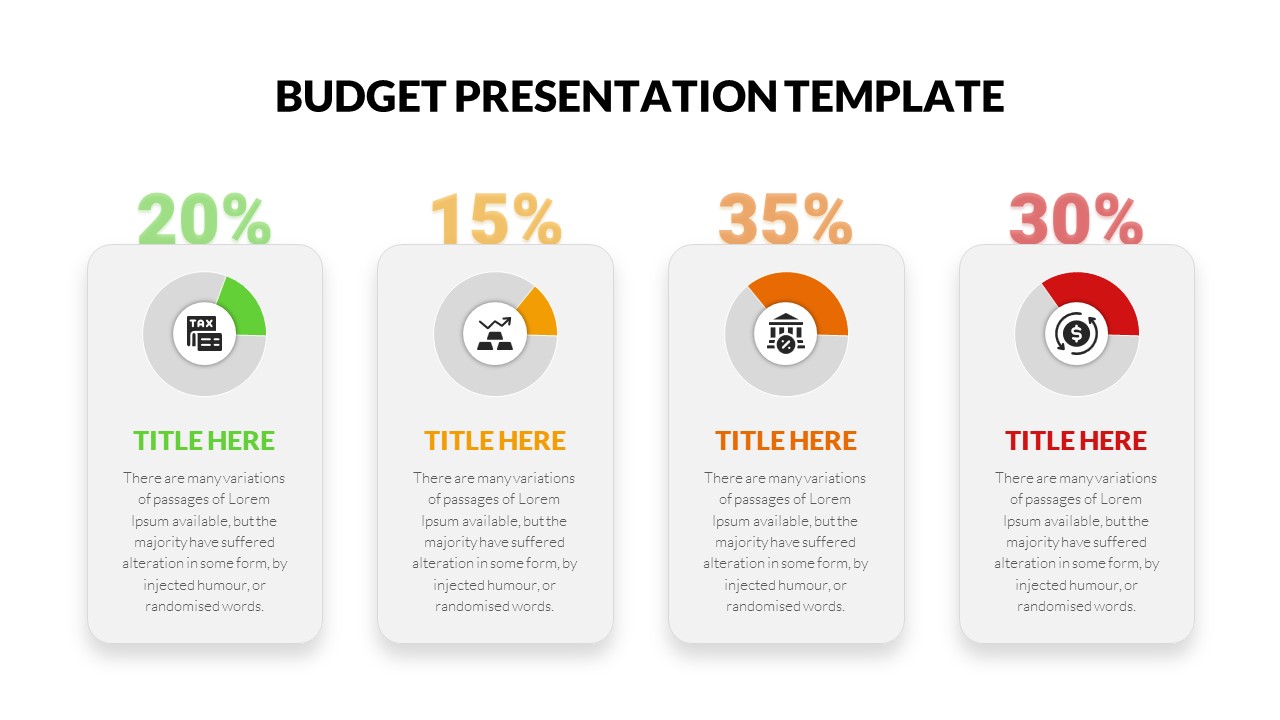
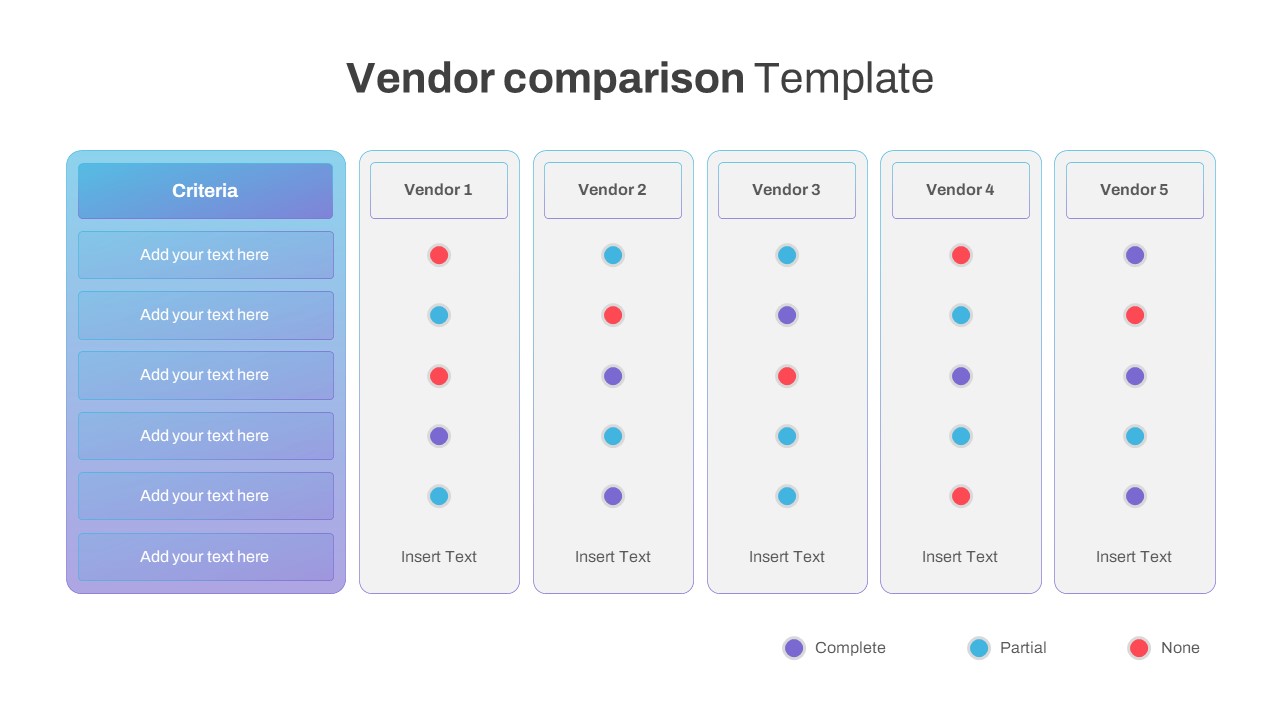
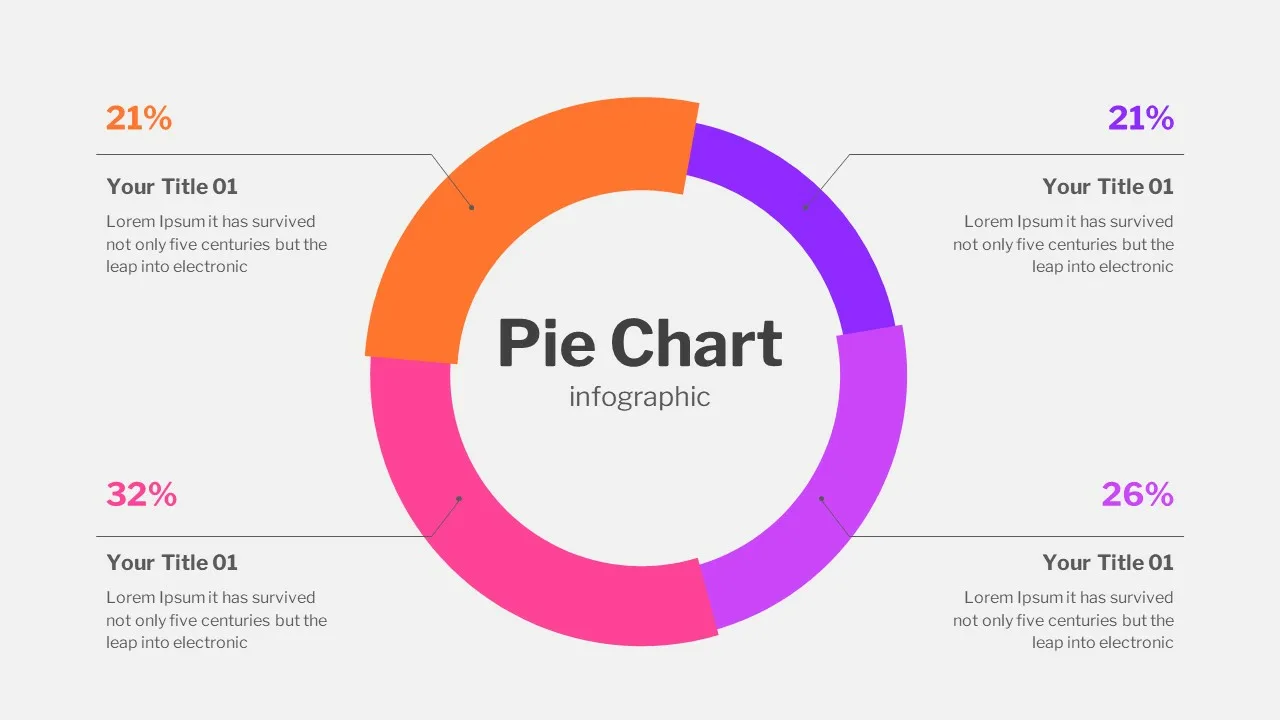
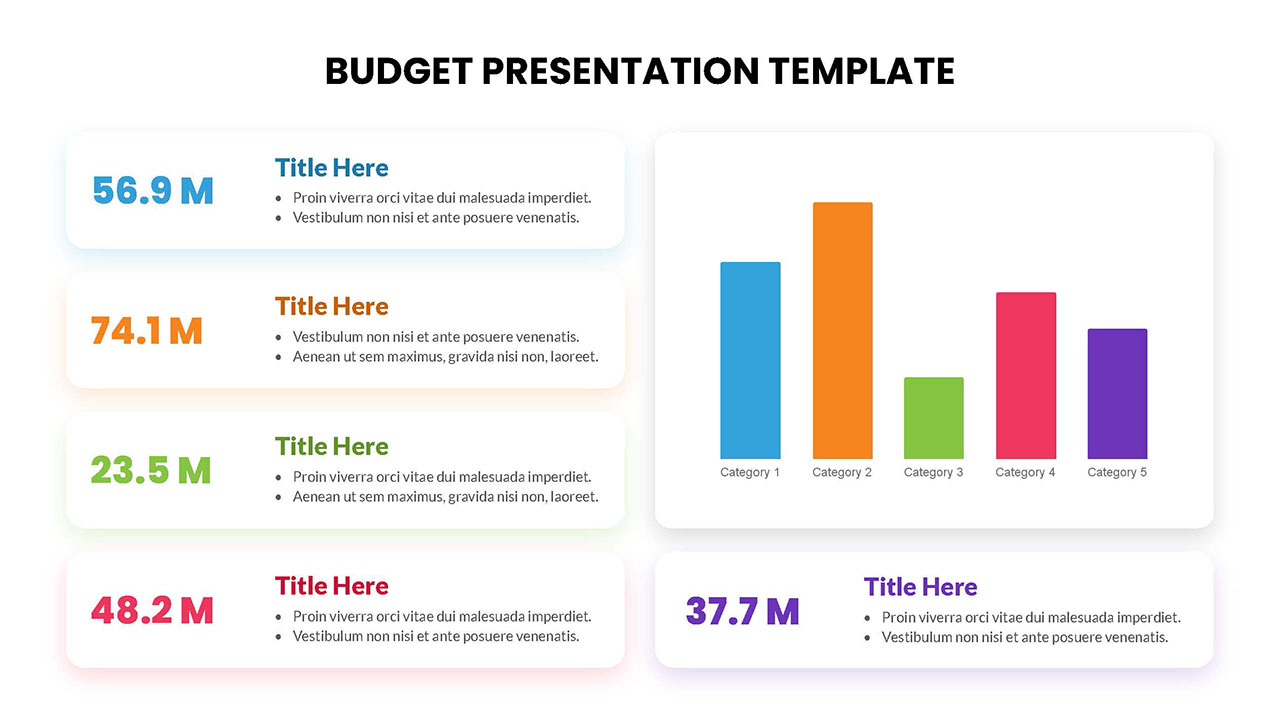
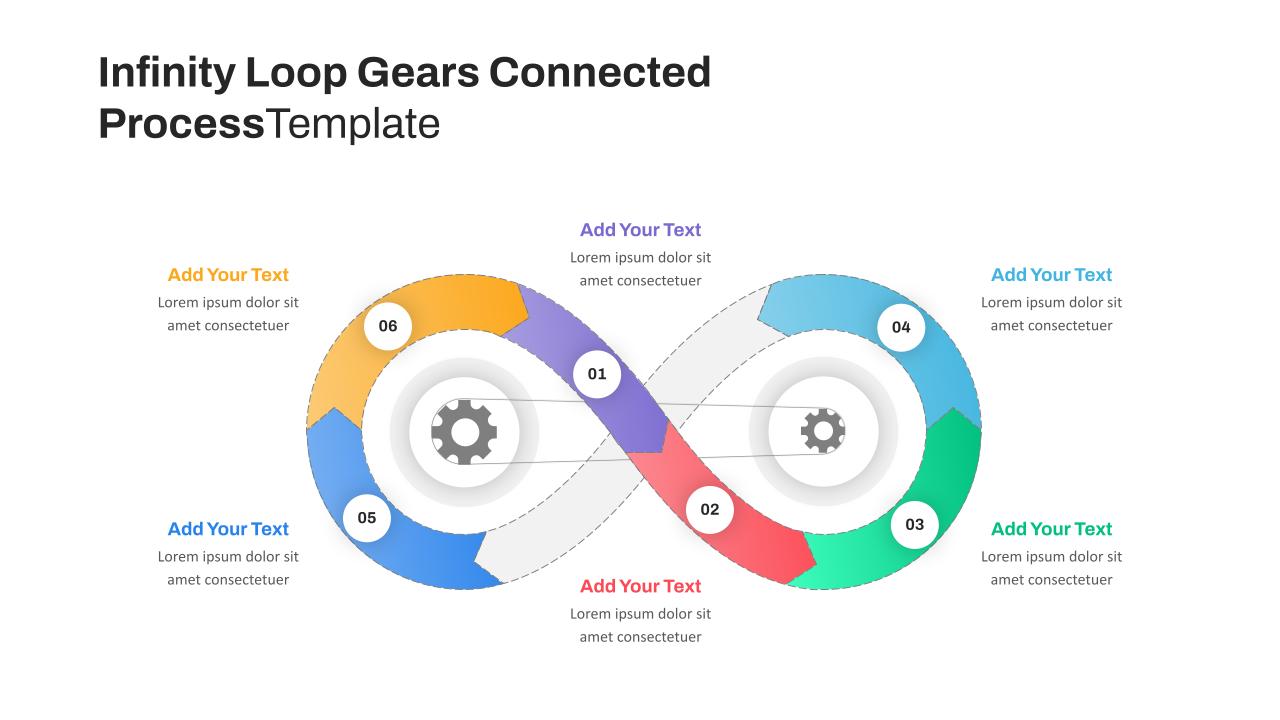
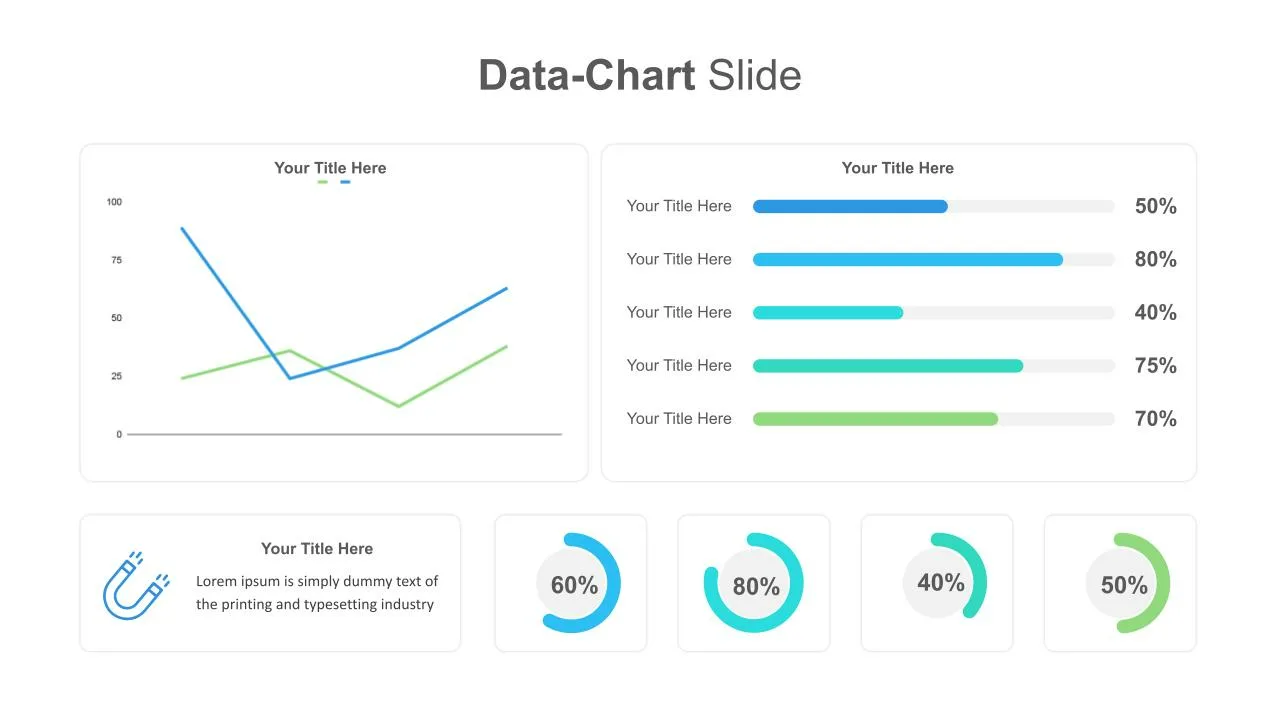
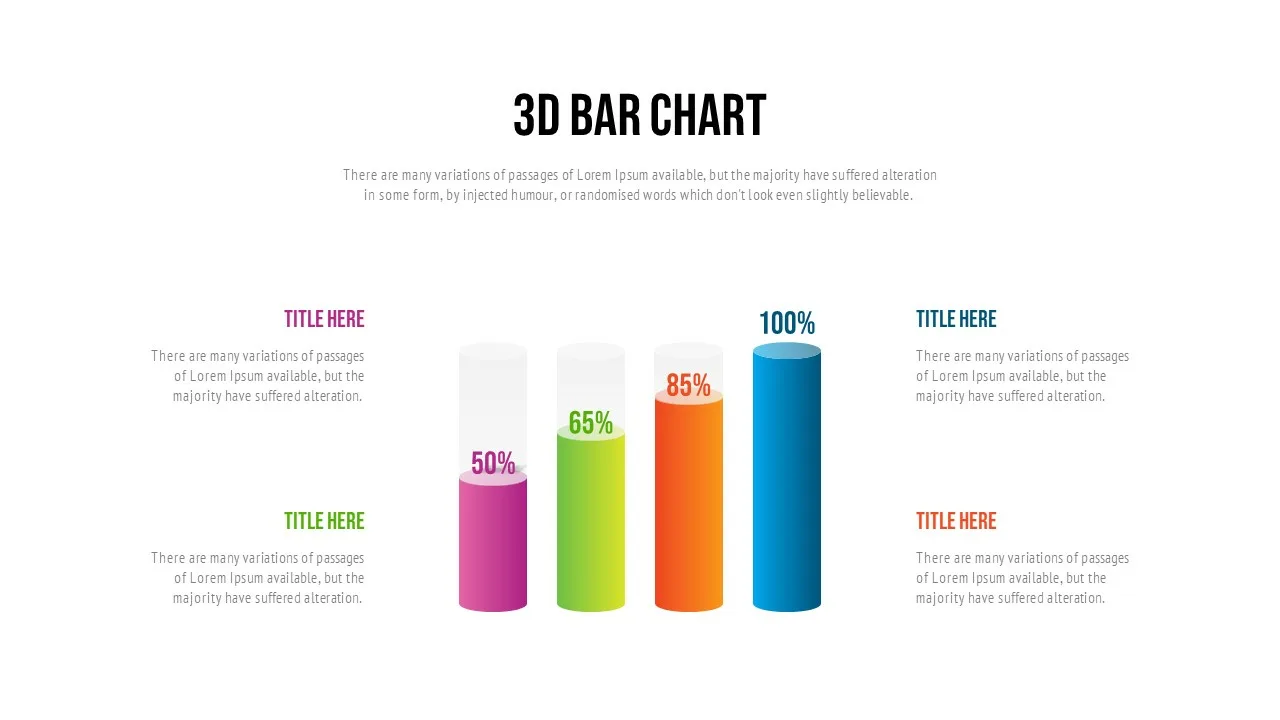
The infographic template in google slides for KPI slides will uncover the performance variables in a snapshot. The dashboard google slides theme contains 14 slides in seven variant designs. It includes a bar chart, speedo meter, doughnut chart, line graph, area chart, and an abstract presentation text zone. This will provide a quick view of company objectives, sales, financial growth, profit margin, market share of products, revenue by source, etc.
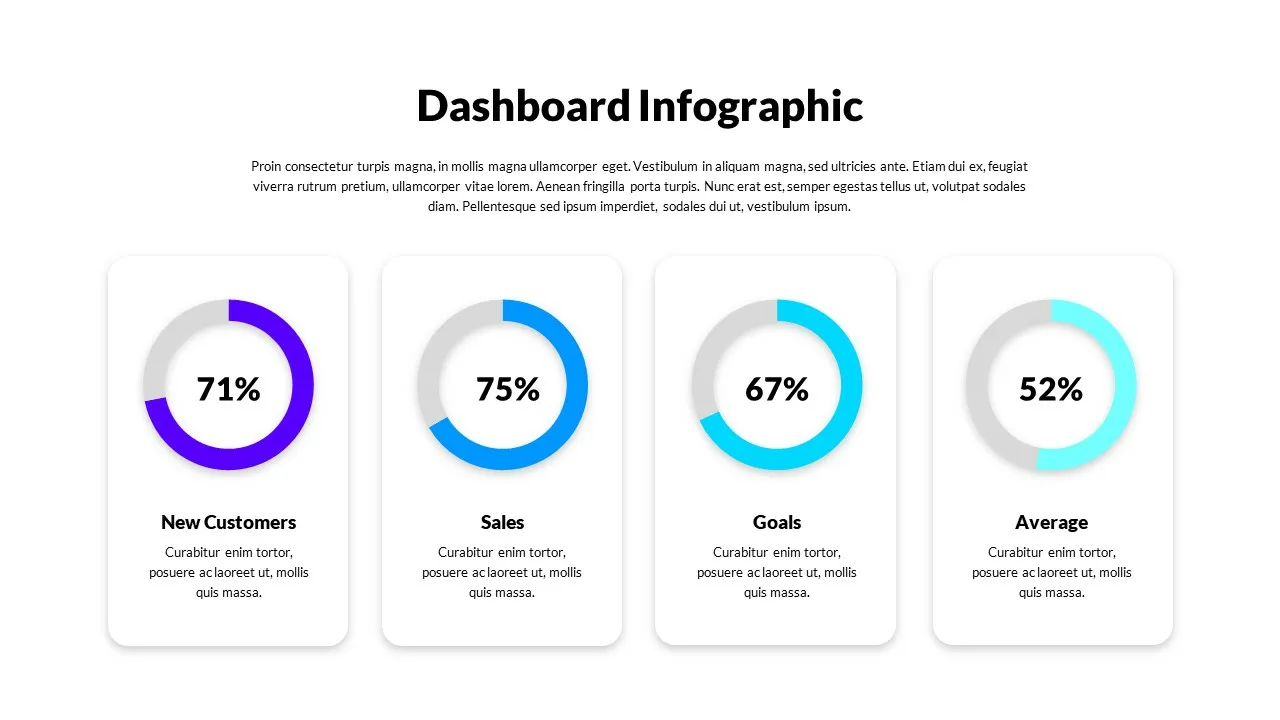
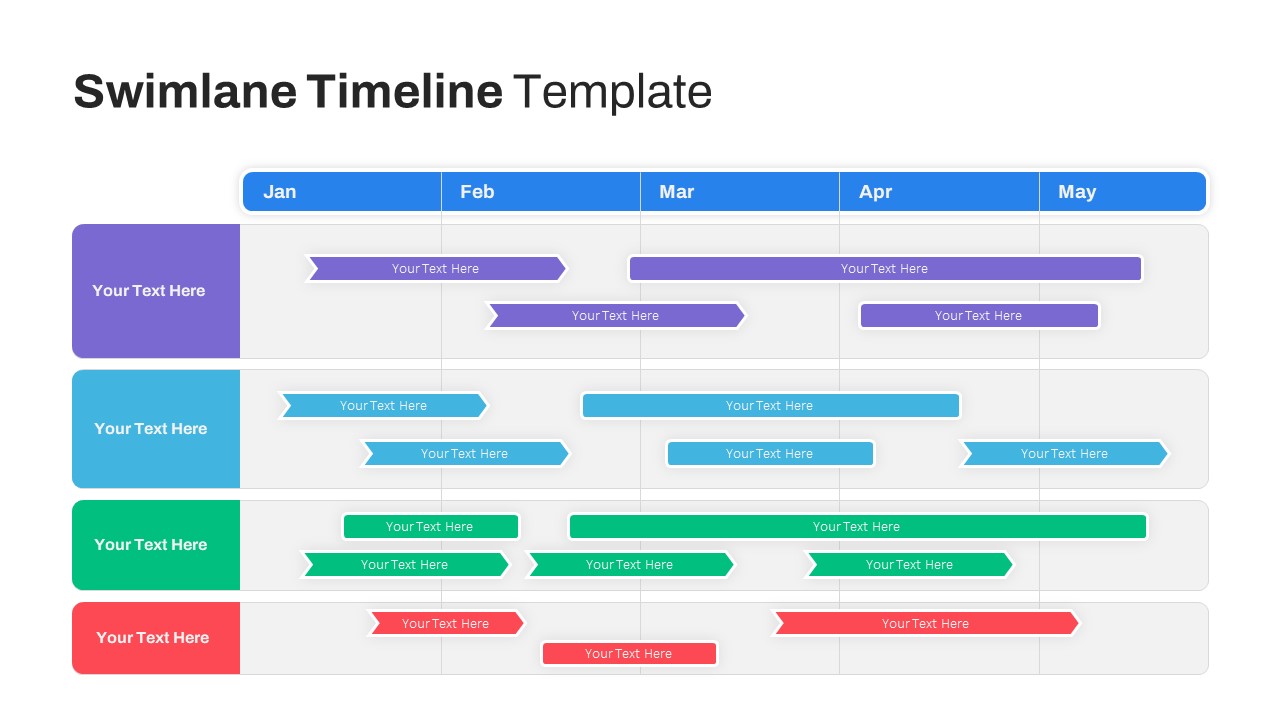
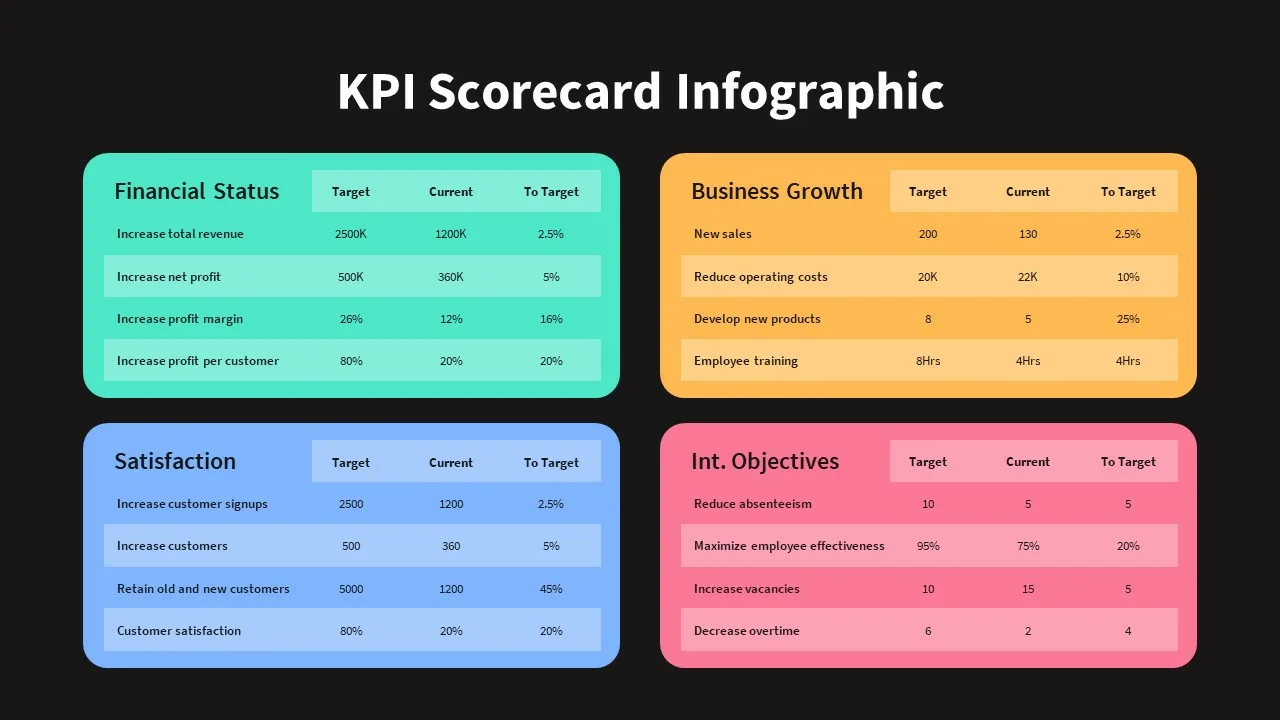
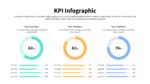
KPI presentation is a sales, marketing, and accounting evaluation report document. Our dashboard infographic could display different, easily understandable metrics for the viewers. For instance, the users can delineate average monthly sales, conversion rates, and sales performance reports using statistical graphic slideshows.
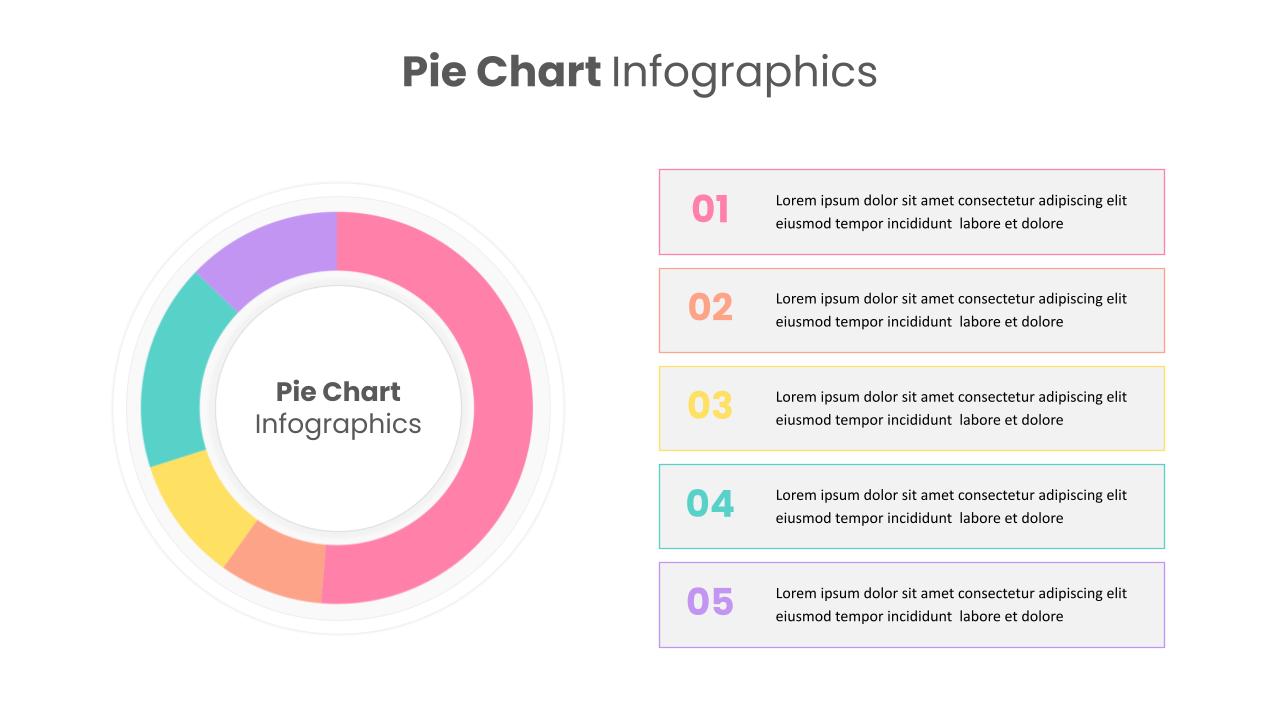
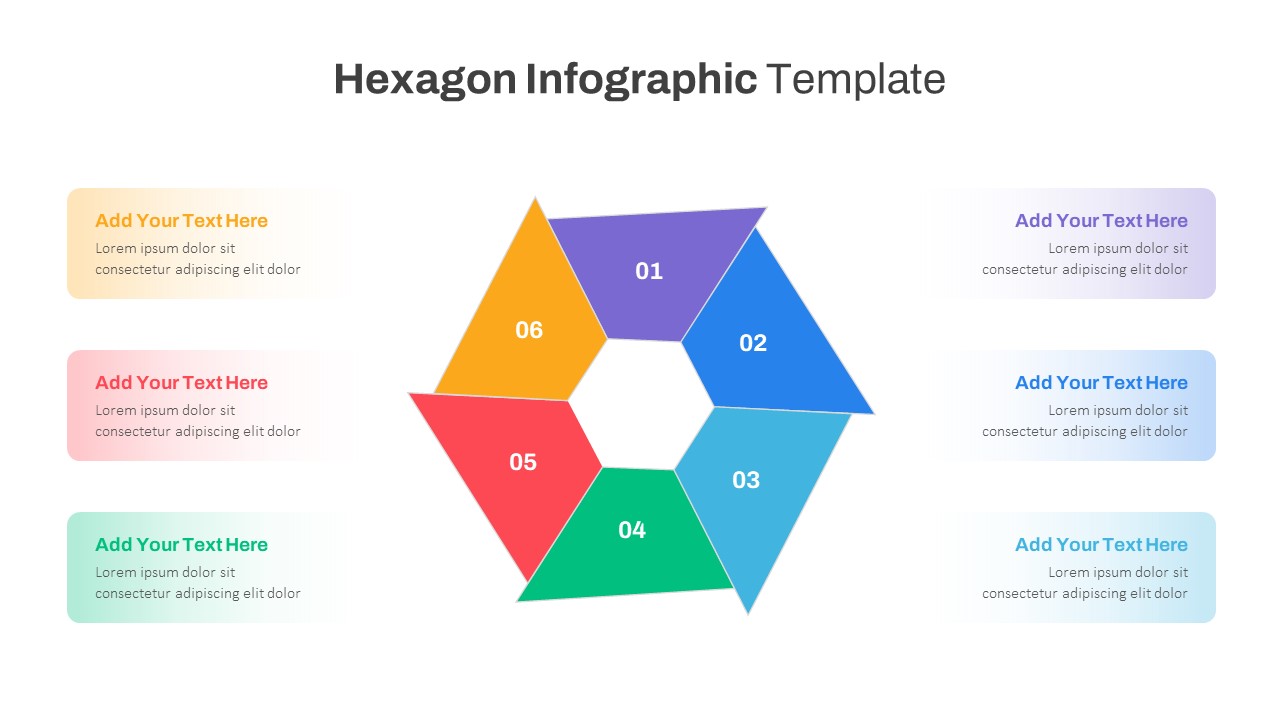
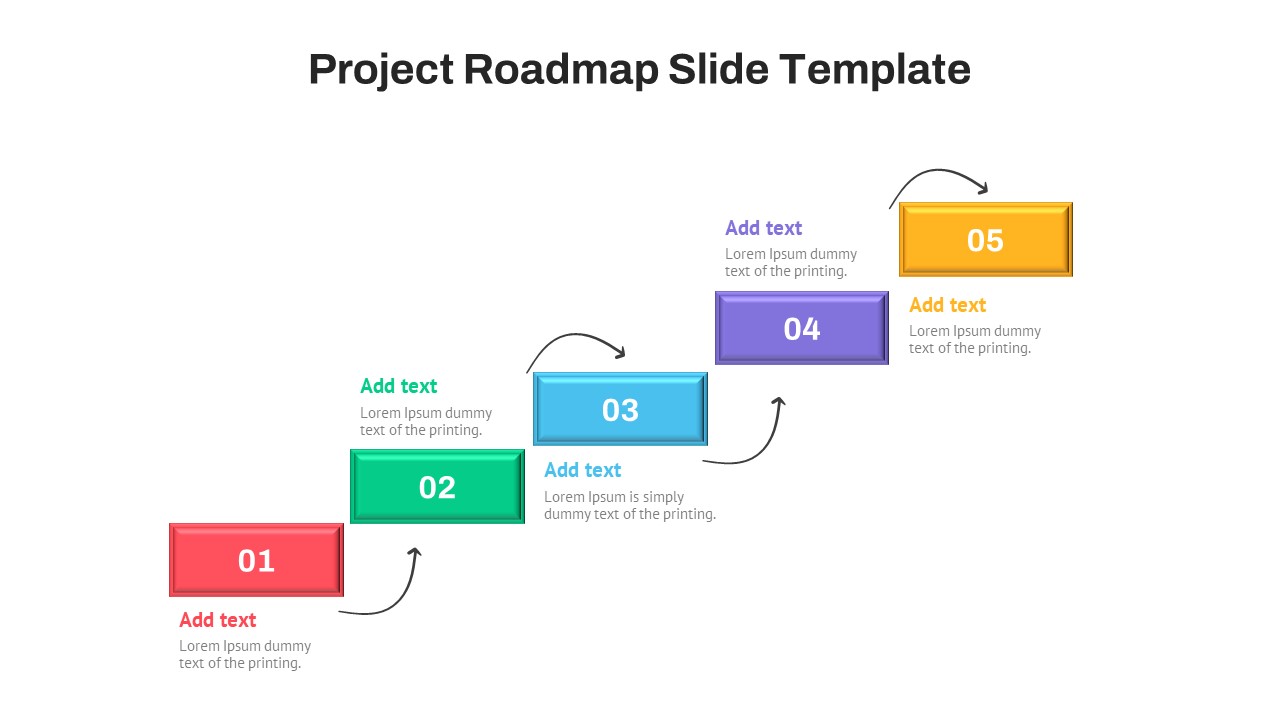
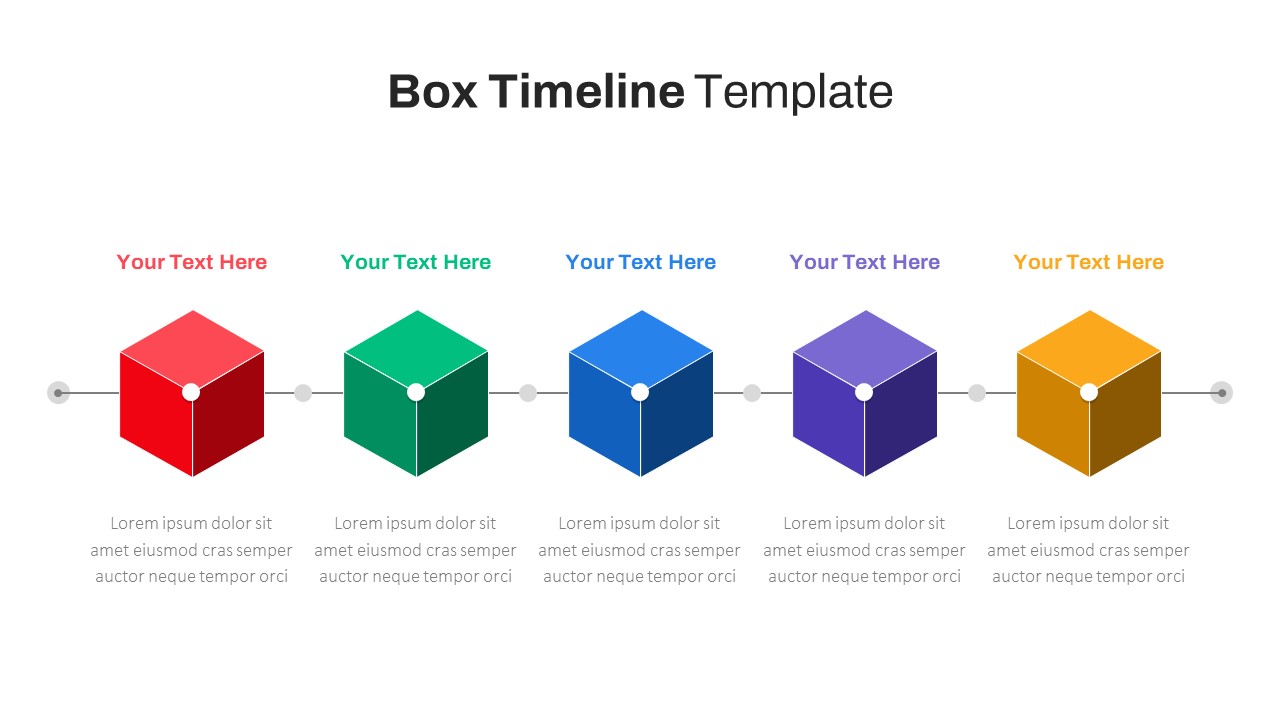
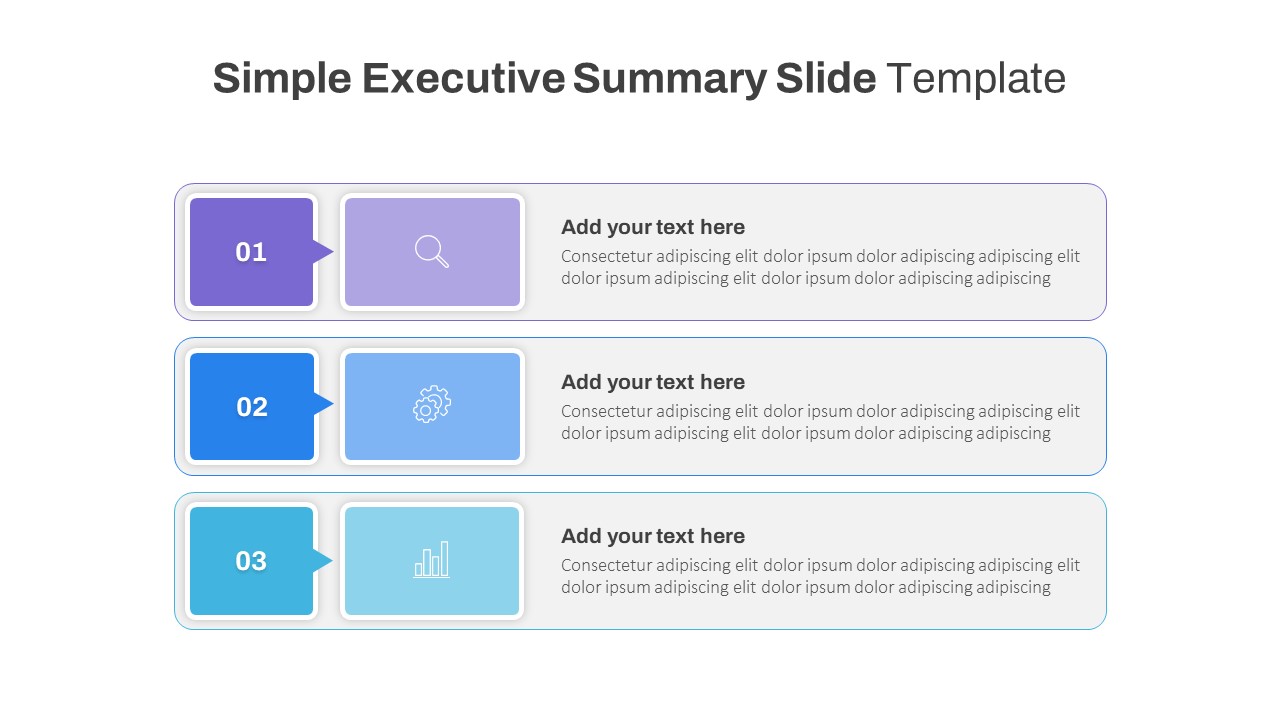
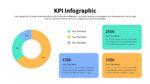
KPI infographic is a data-driven chart that will suit your scalable data presentation. Its executive summary type designs, graphs, and charts ensure a proper understanding of metrics in the statistical slide presentations. Further, users can easily edit the template’s color, size, shape, background, and overall features.
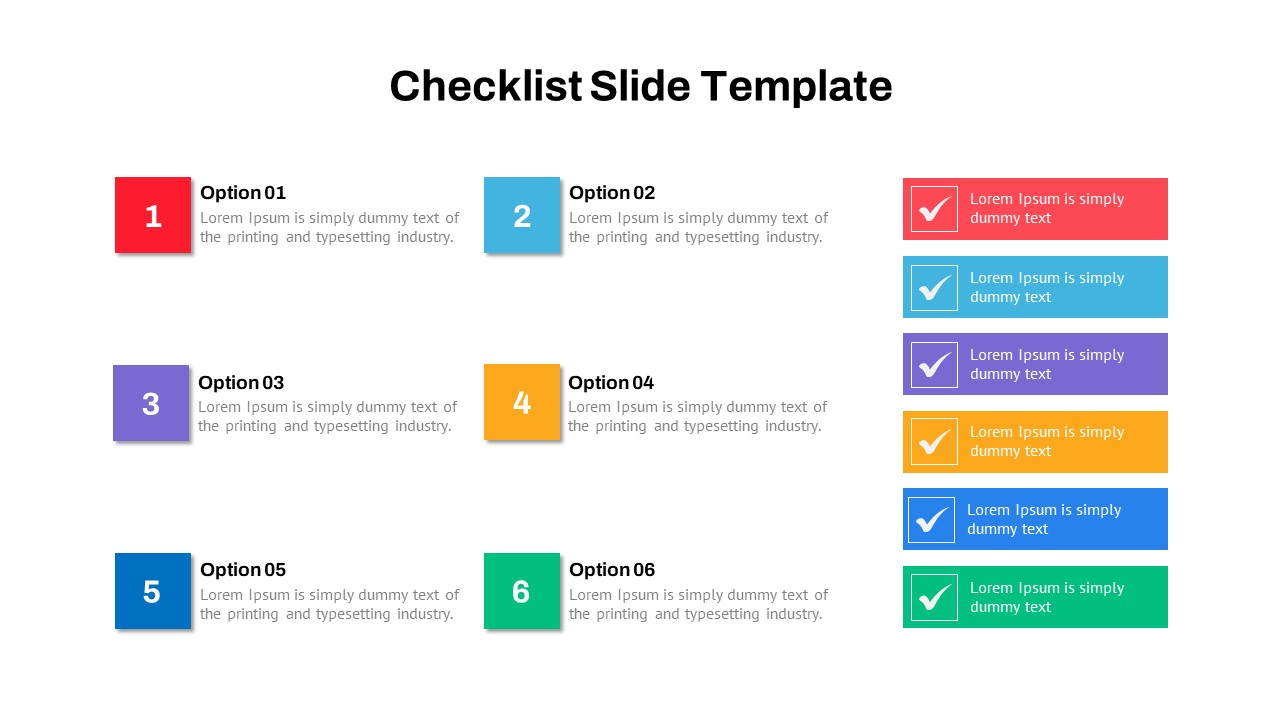
Each text zone allows you to insert factual data within the graphical images or in separate text areas on the board. When presenting your data, coloring spots is crucial to distinct summary features. So, choose suitable colors if you need them other than default color schemes.
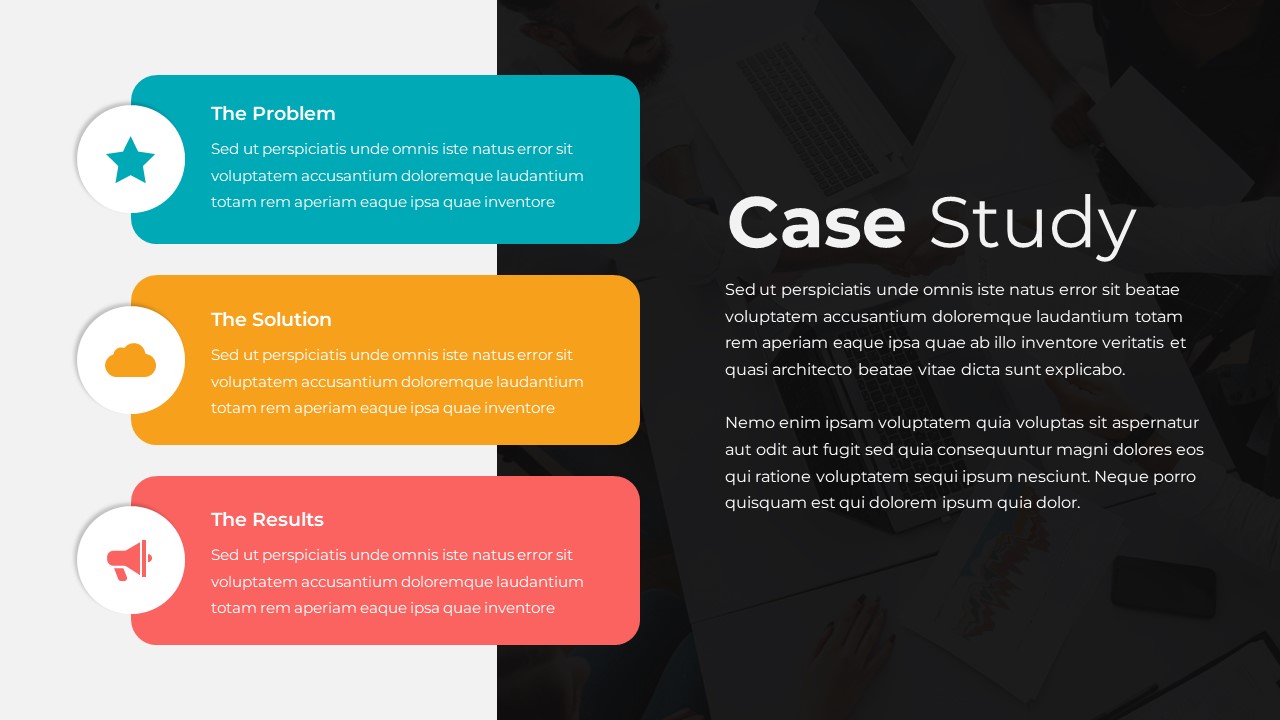
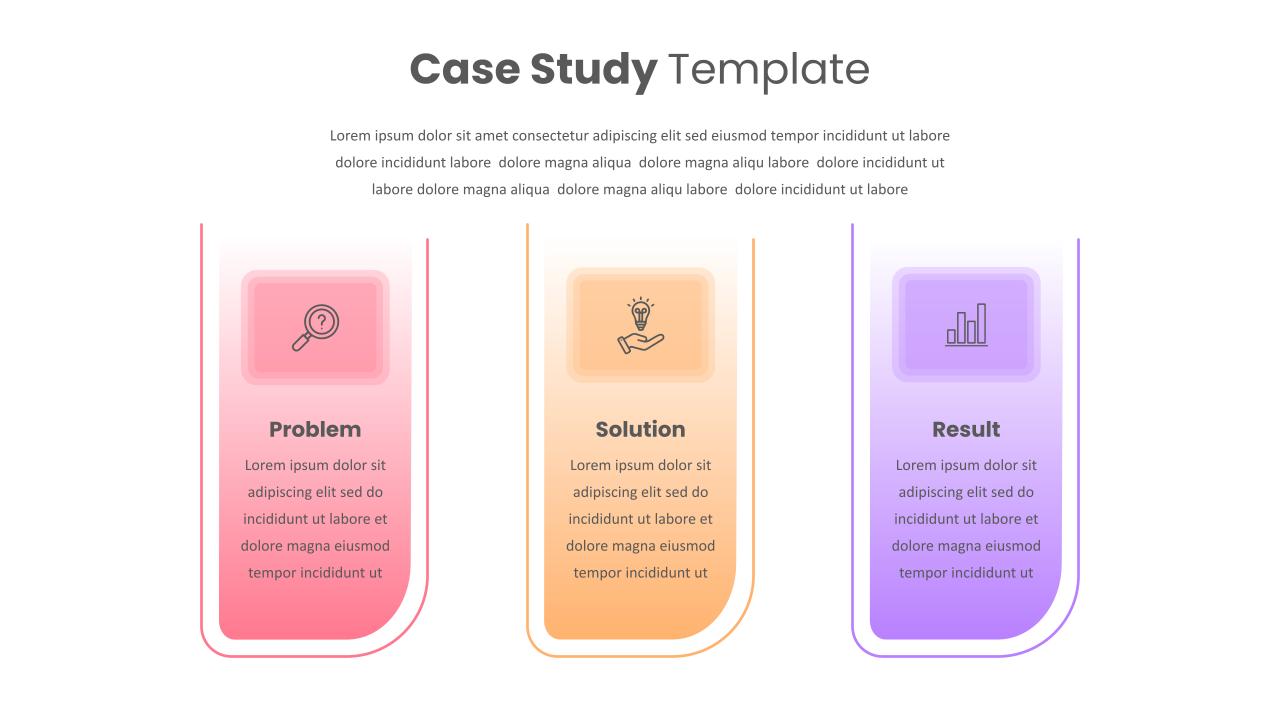
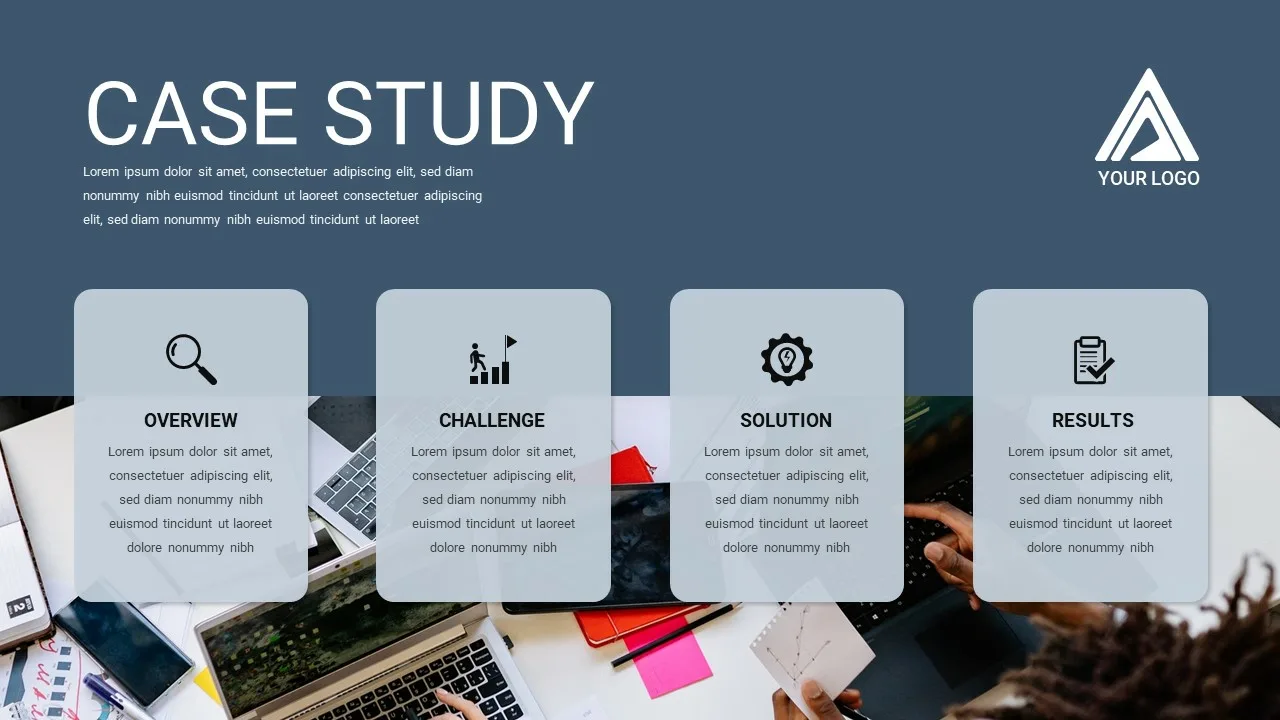
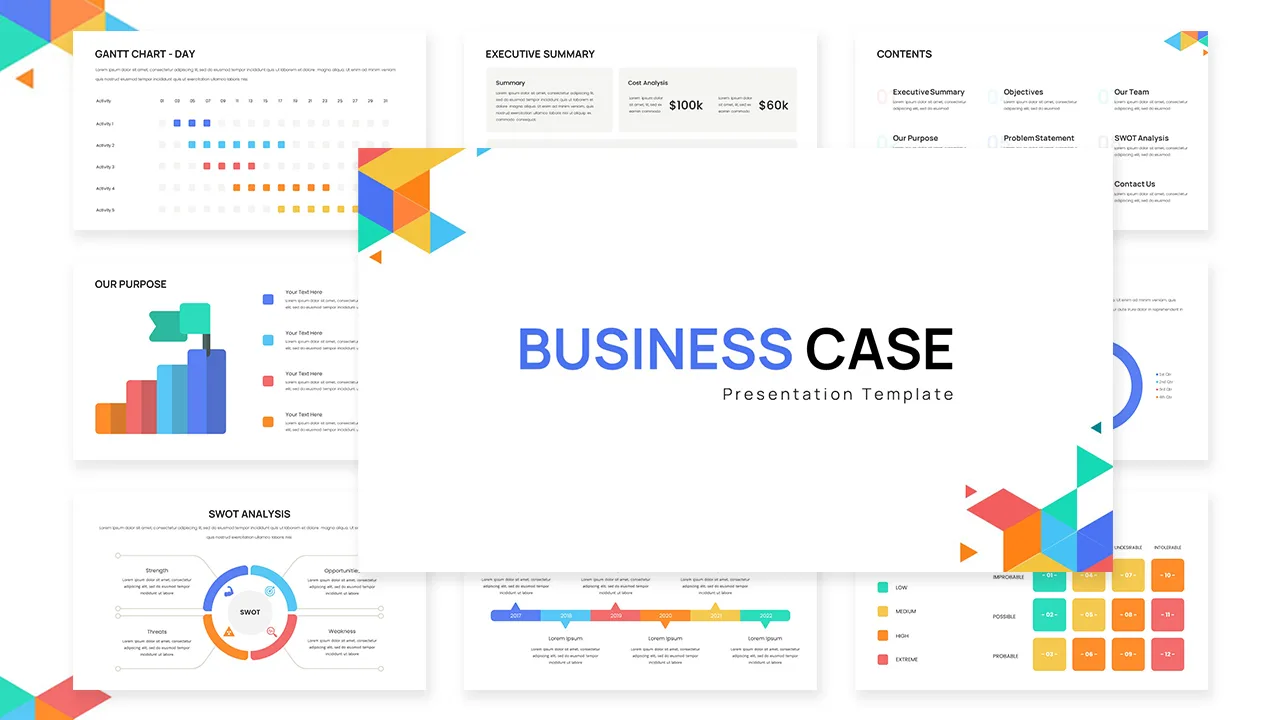
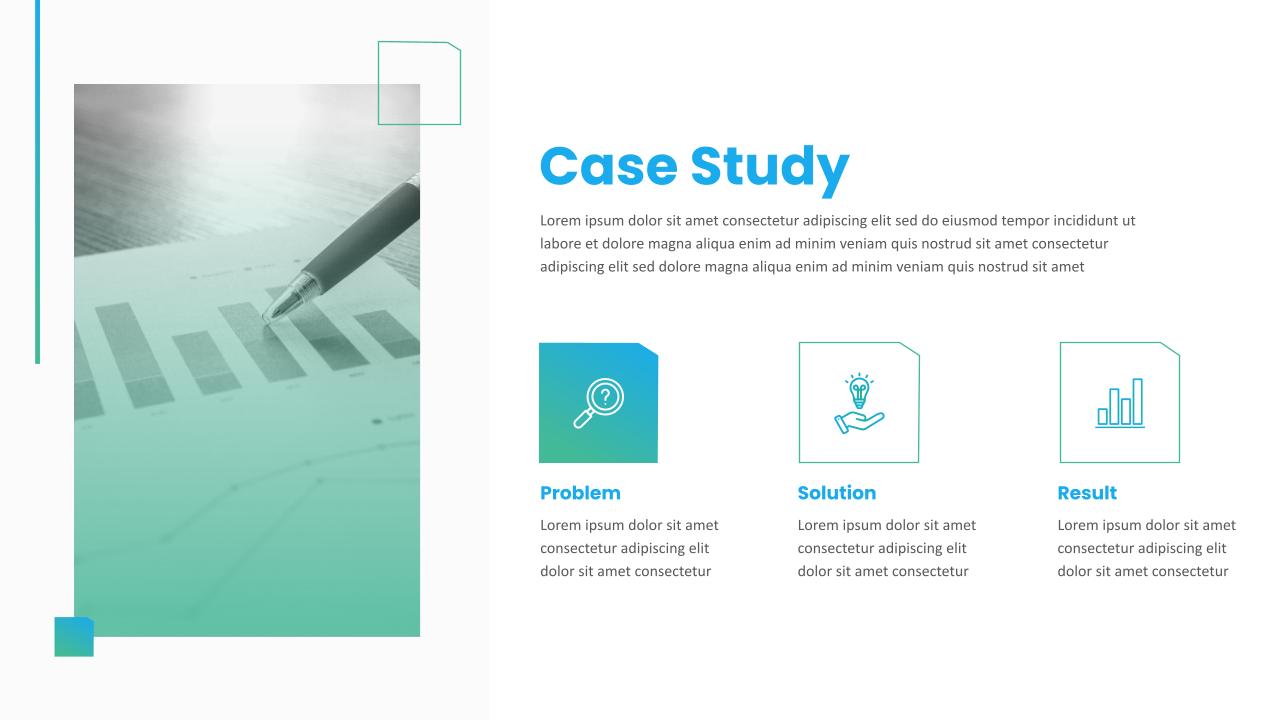
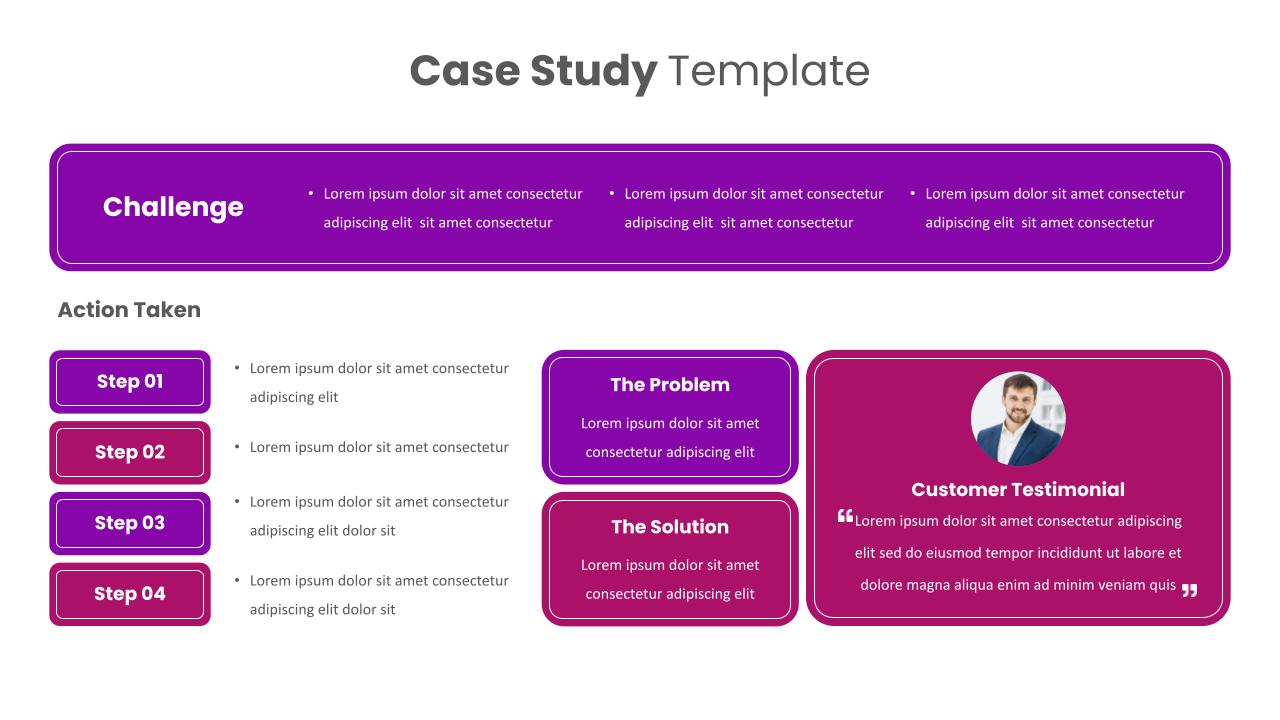
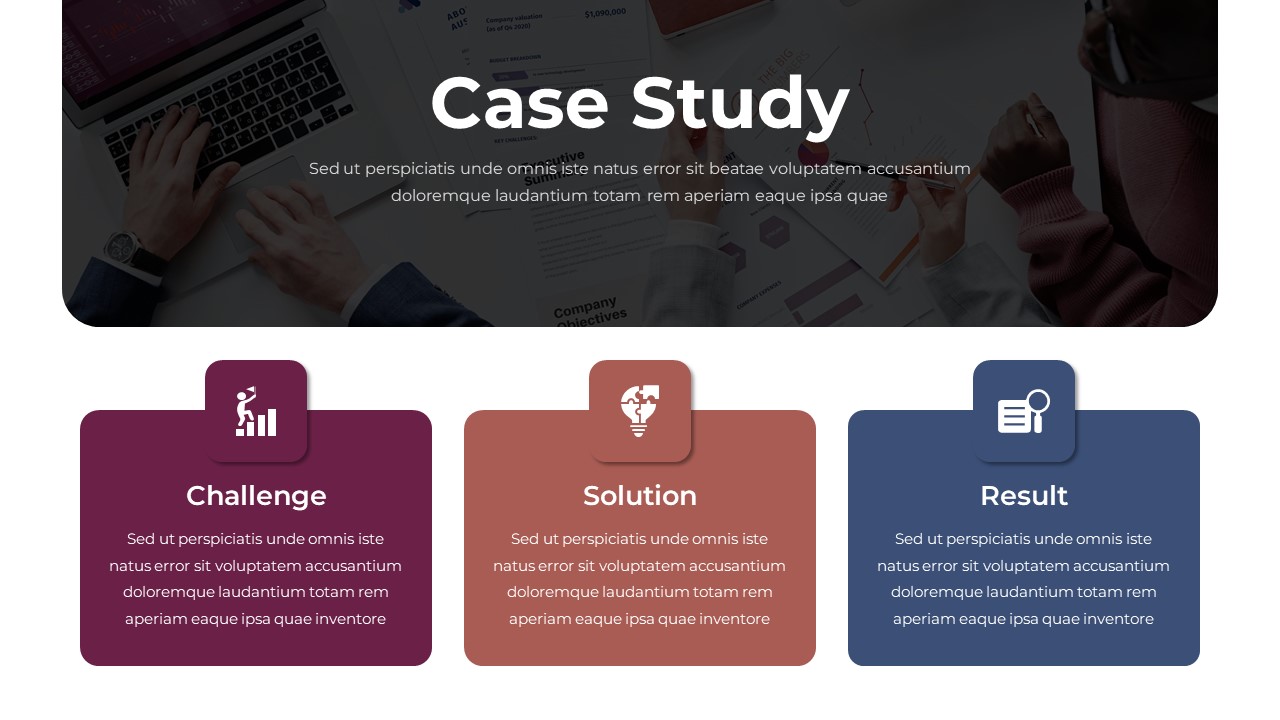
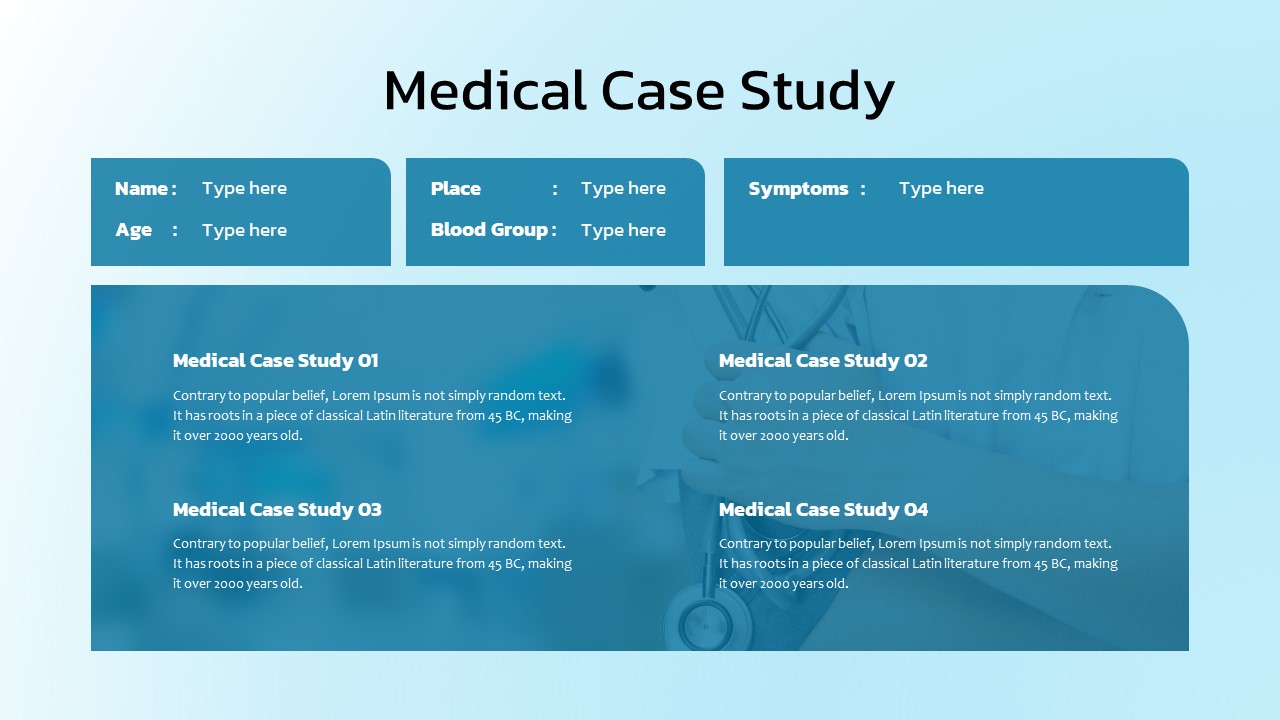
To complement your data-driven presentations, explore our business case study slides. These templates offer a professional and structured format to effectively showcase your business case studies. By combining the KPI slides with business case study slides, you can present key performance indicators alongside real-life examples of successful business strategies and outcomes.
Download these google slides templates now!
See more

Aspect Ratio
16:9Item ID
SKT00203
You May Also Like These Presentation Templates


- Free
- Free
- Free
- Free
- Free
- Free
- Free