3D Donut Chart Template
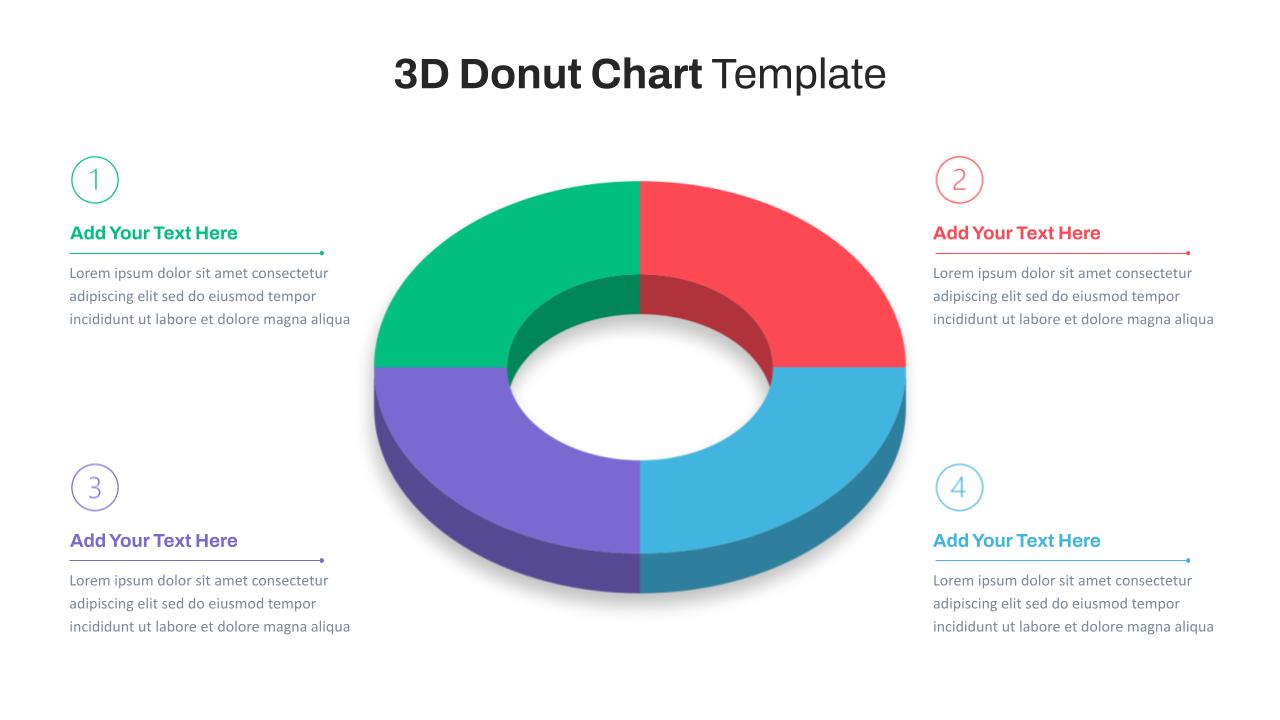
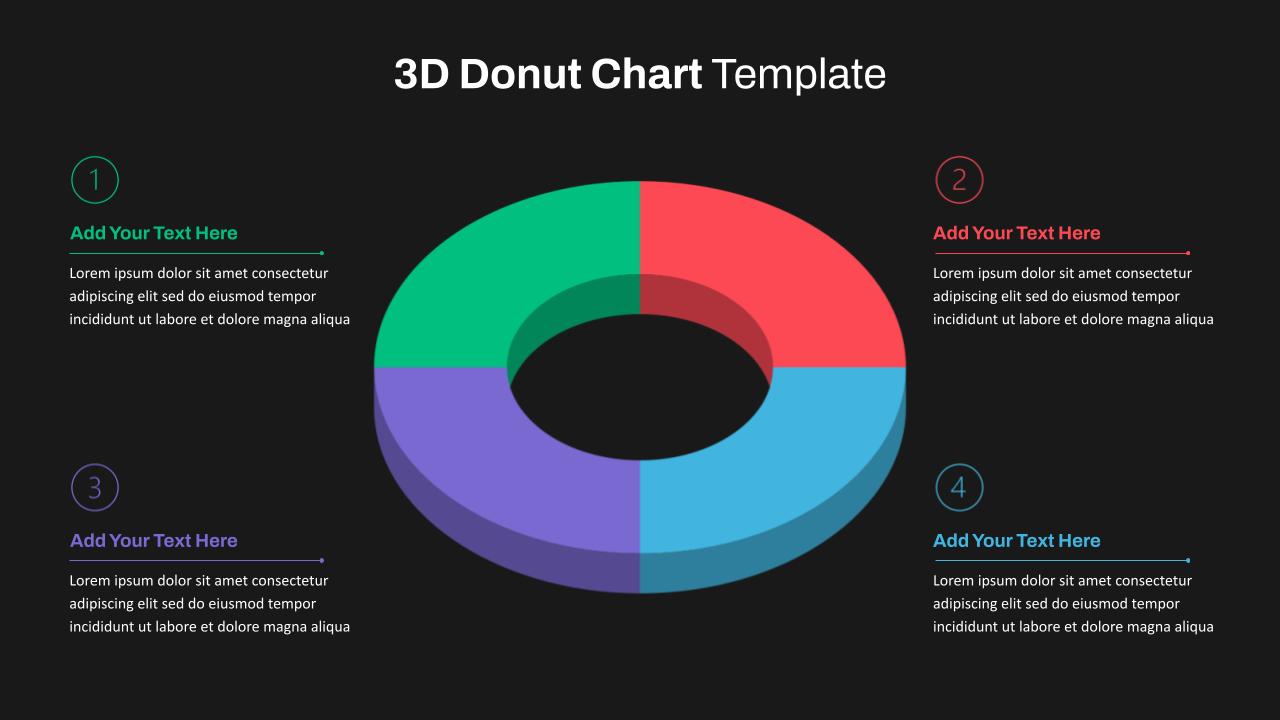

Revolutionize your finance data presentations with our 3D Donut Chart Template, integrating your company statistics for a visually compelling narrative. This data-driven presentation tool displays stunning three-dimensional features, enhancing the accessibility and comprehension of your information. Elevate your numerical data to new heights of professionalism, ensuring a captivating delivery to your audience. The cutting-edge design of our template sets you apart in the realm of statistical presentations, providing a dynamic and sophisticated backdrop for your key metrics. Specifically tailored for showcasing survey results, budget allocations, and percentage distributions, our 3D Donut Chart for Google Slides promises to transform your presentations into memorable and impactful experiences.
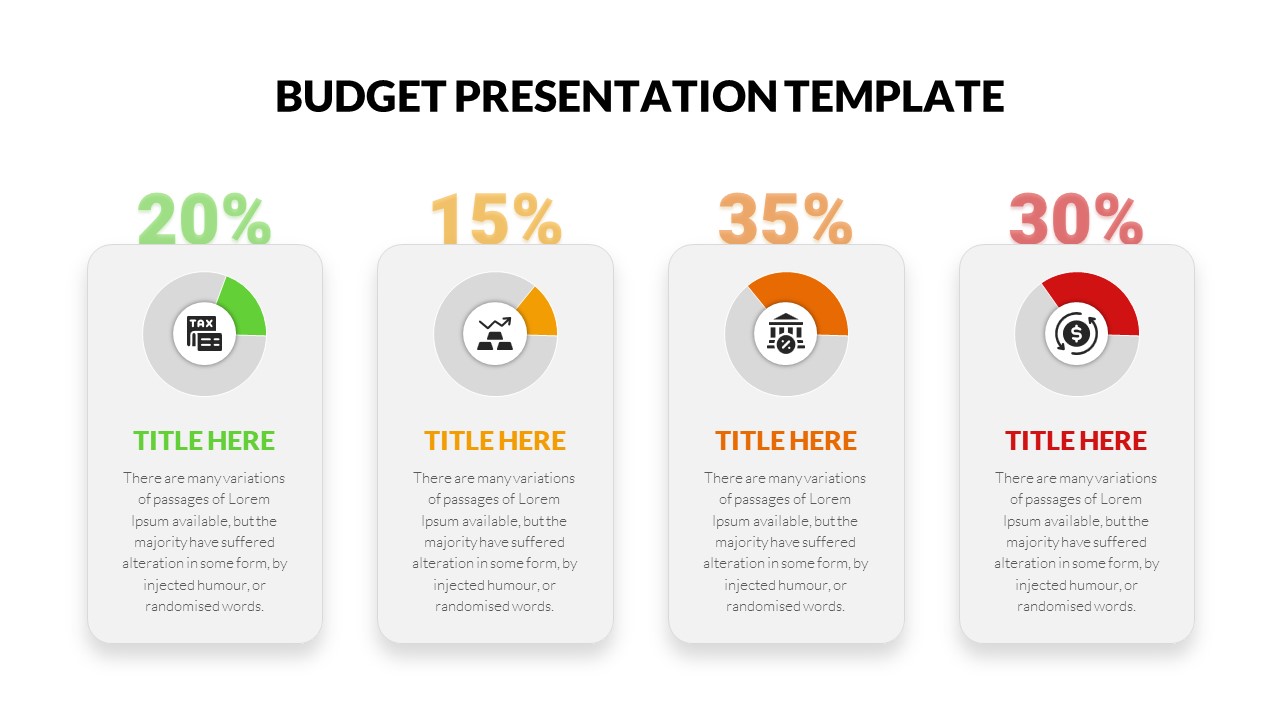
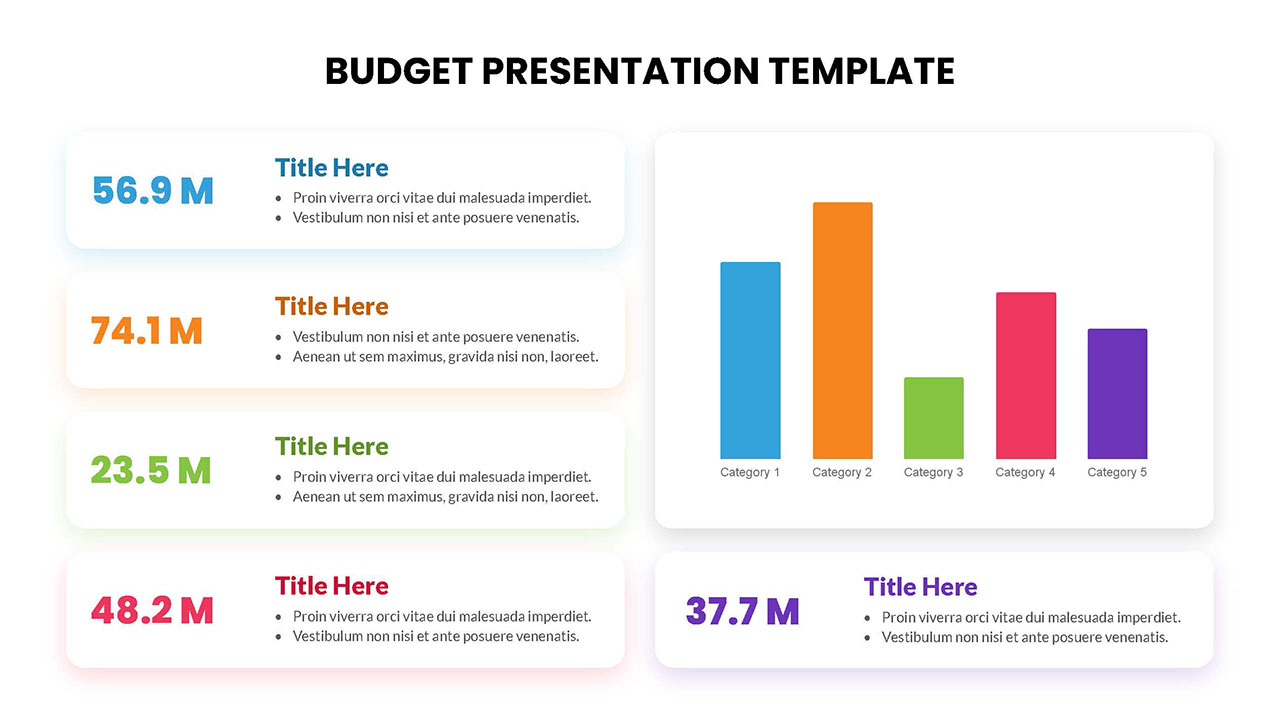
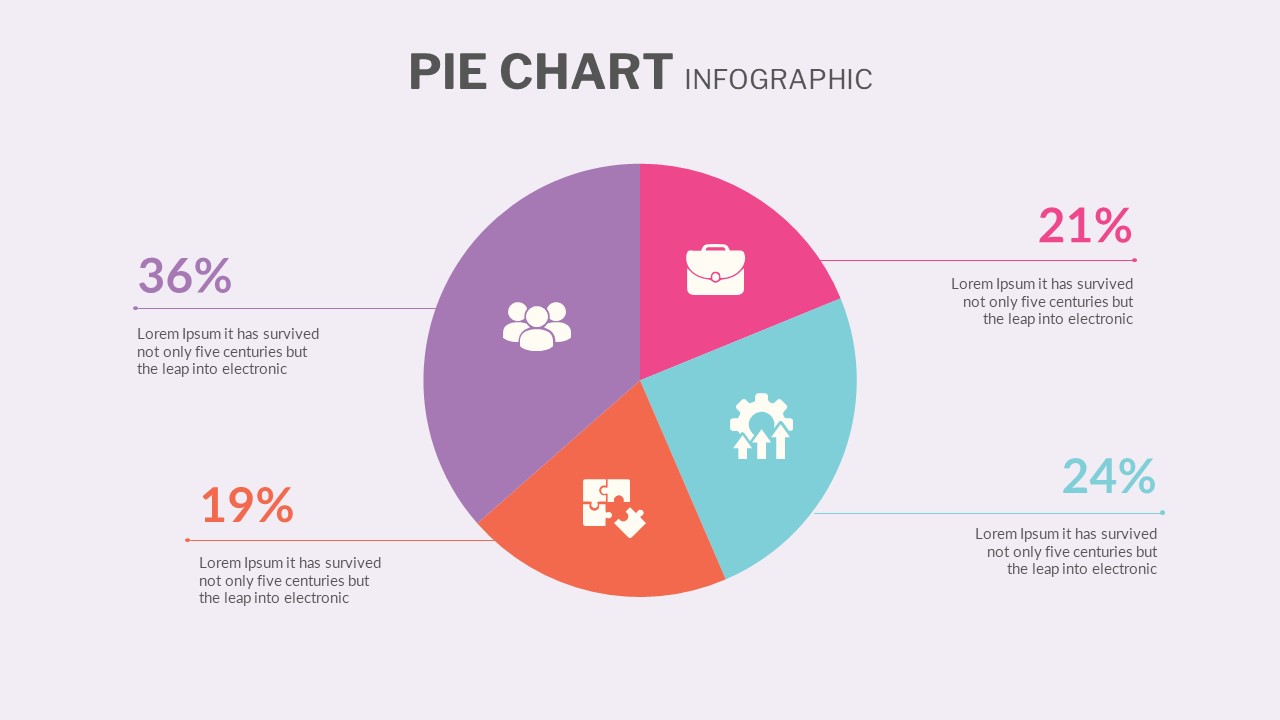
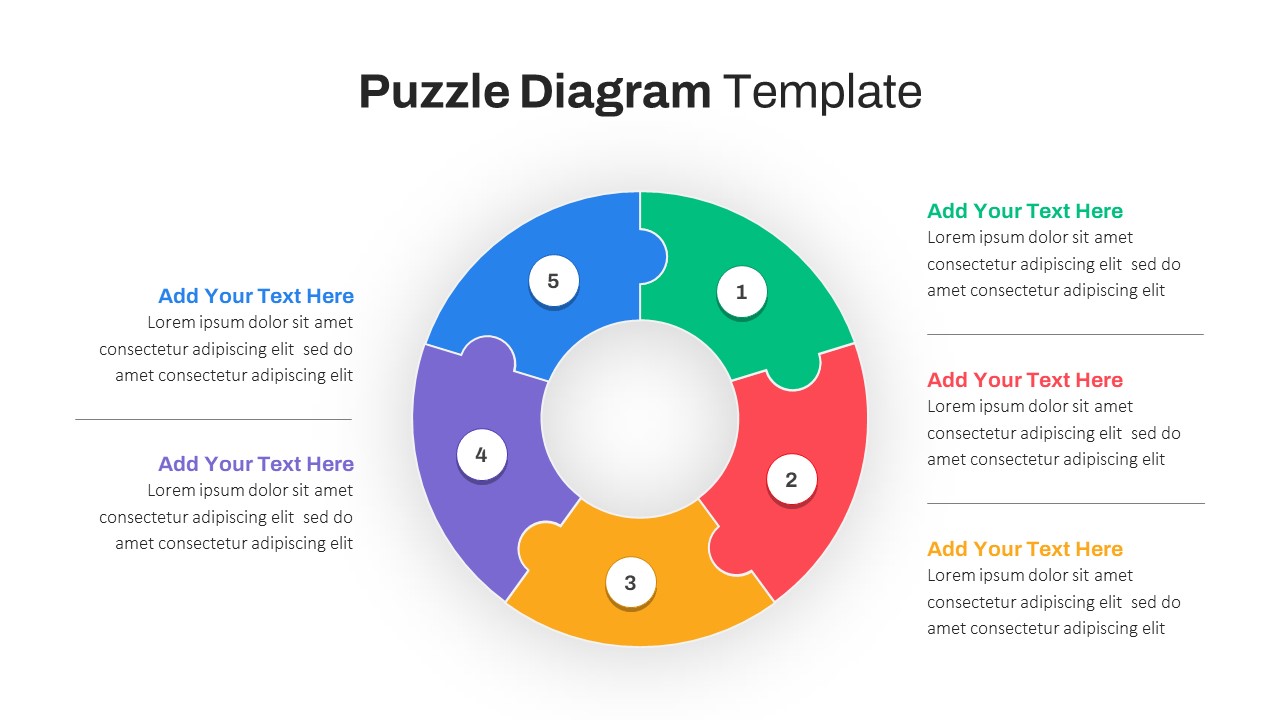
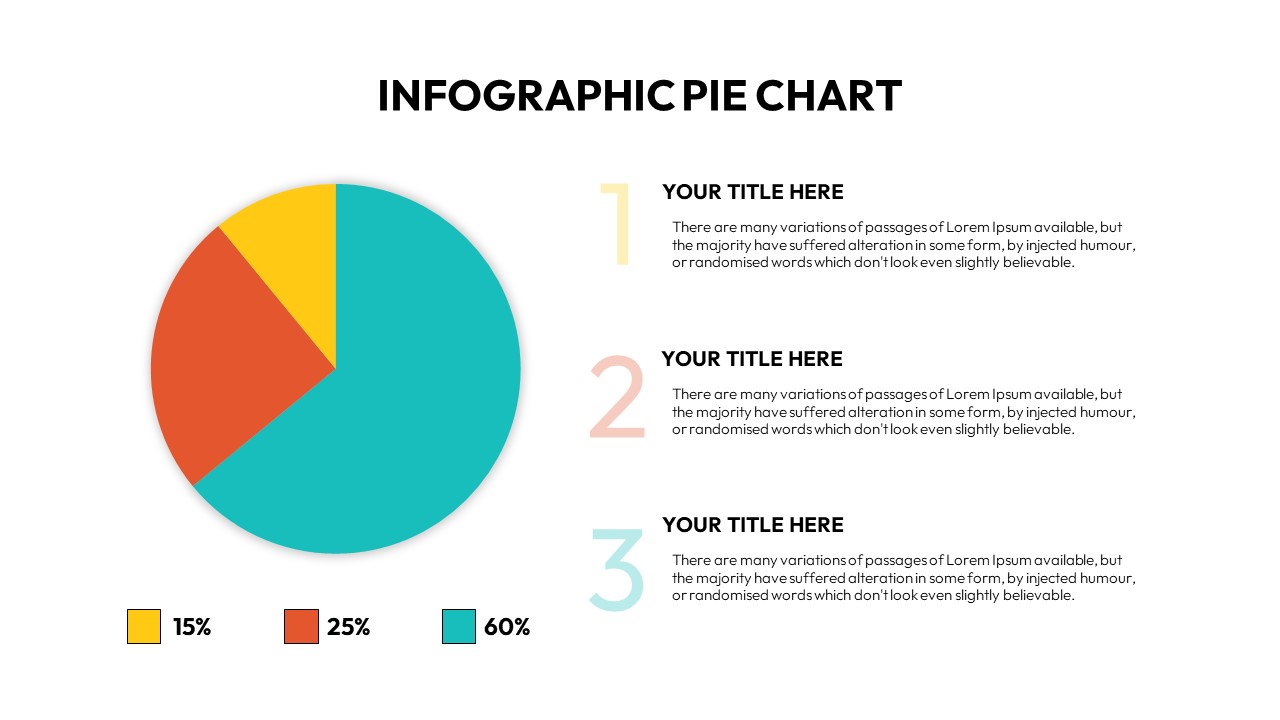
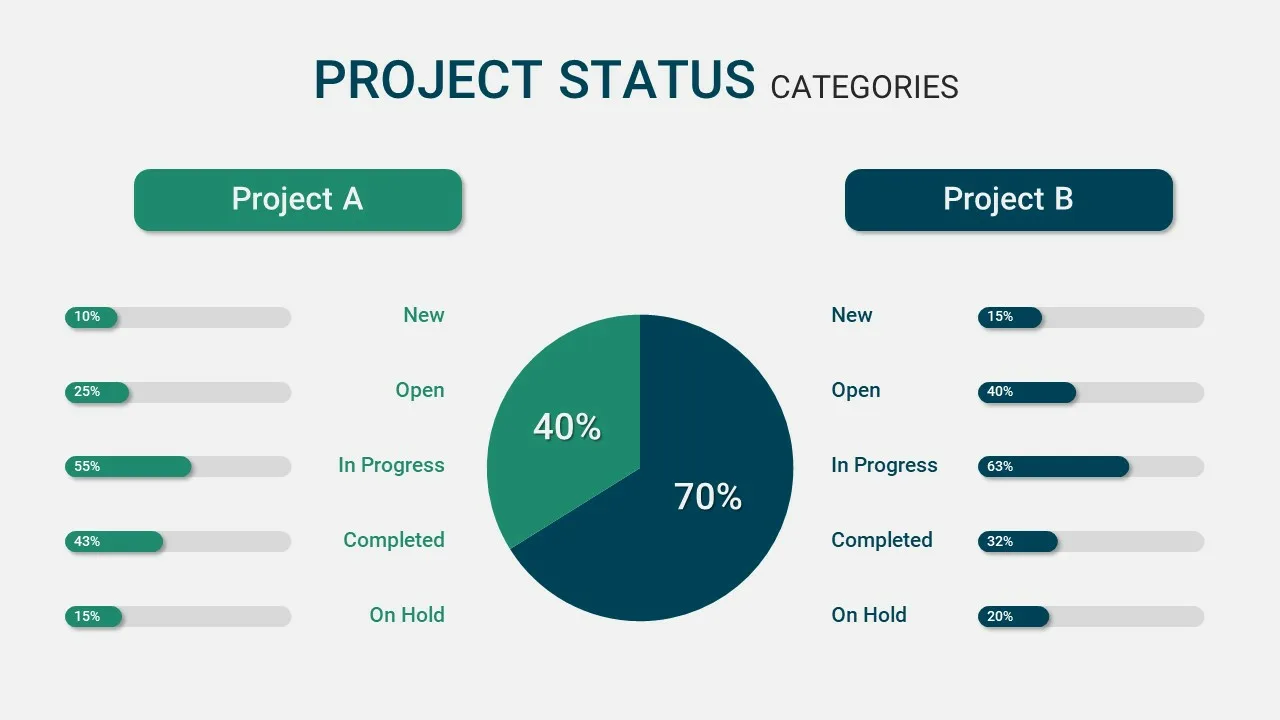
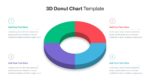
Our 3d Pie Chart Template has four sections with distinct color combinations. The Donut chart is a ring share chart combined with segmented divisions. Each division will represent a data category or a set. Typically, the center portion is left empty, shaping the donut chart. This simple chart is perfect for business analysts, financial experts, project managers, educators, researchers, and journalists to showcase information engagingly. Whether you’re showcasing sales figures, budget allocations, or project milestones, this template allows you to transform numbers and statistics into a visual story. The 3D element adds depth and sophistication, making your presentations more memorable and impactful. Download it now!
See more

Aspect Ratio
16:9Item ID
SKT00801
FAQs
You May Also Like These Presentation Templates
- Free
- Free
- Free
- Free