Root Cause Analysis Template Google Slides
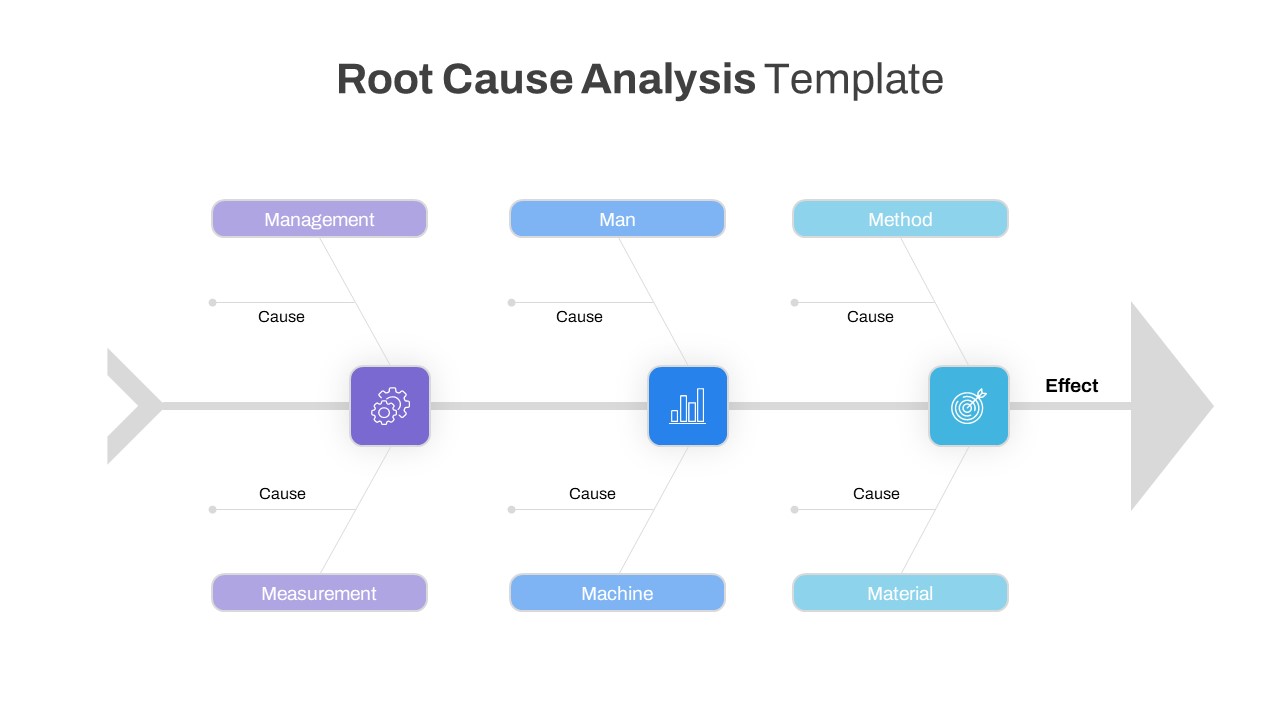
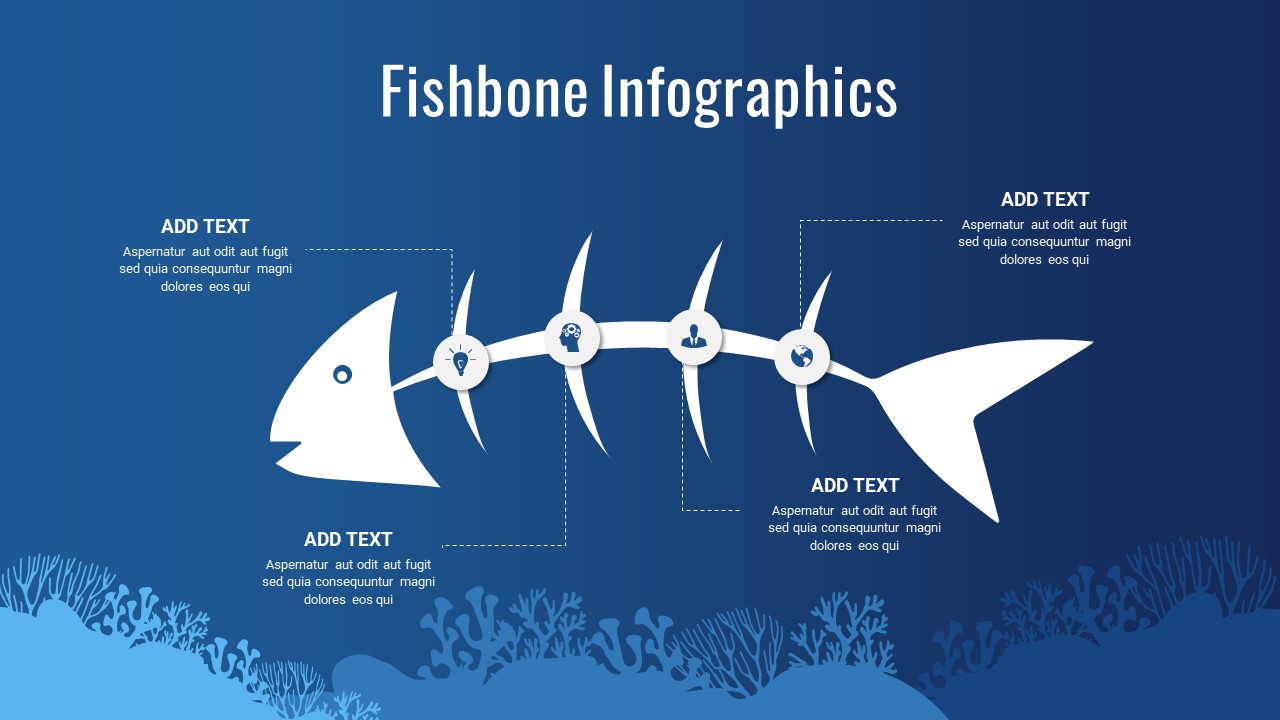
Cause and Effect Google Slide offers a fishbone diagram for presenting research outcomes. The Google Slide diagram provided is an optimal tool for illustrating the complex relationships between causes and effects in various domains such as business, natural occurrences, and social phenomena.
It is called by names like the Ishikawa diagram, Herringbone diagram, cause and effect diagram, and Nishikawa diagram, and serves as a graphical tool for categorizing potential problem causes and identifying their root origins.
This template offers a perfect framework applicable to diverse research and development areas. Particularly advantageous in brainstorming sessions, the Fishbone diagram facilitates focused discussions, making it an ideal resource for understanding and addressing complex issues.
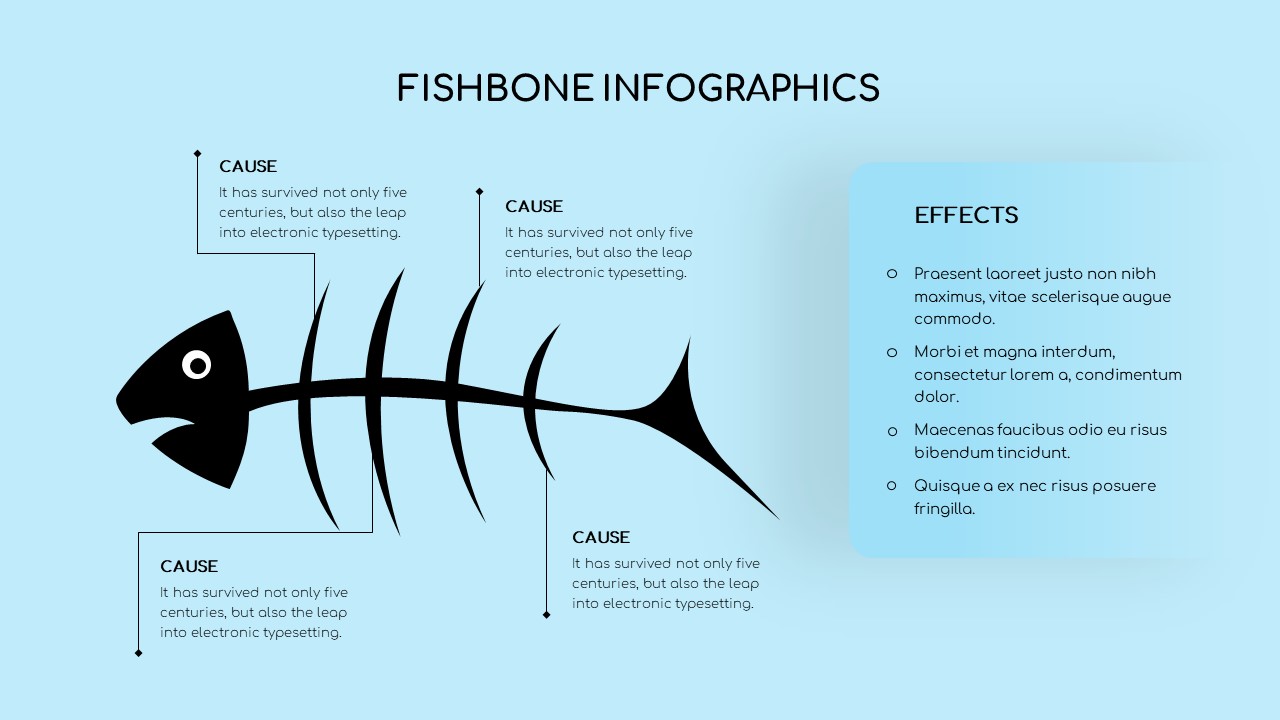
The Root Cause Analysis Template Google Slides resembles the skeletal structure of a fish, with each bone representing a potential cause and the head symbolizing the resultant effect.
This interconnected arrangement underscores the interdependence of various causes, shaping the ultimate impact of a problem. This template proves invaluable for scrutinizing diverse causes associated with an issue. Beyond its general utility, the Fishbone diagram finds specific application in methodologies like Six Sigma’s DMAIC (Define, Measure, Analyze, Improve, Control), offering a structured approach to problem-solving phases.
This cause-and-effect diagram, with its fishbone design, serves as a technical tool for in-depth problem analysis and solution development. Root cause analysis, integral to the process, systematically unveils underlying factors contributing to adverse events. Remarkably versatile, the fishbone diagram can be employed for both positive and adverse effects analysis.
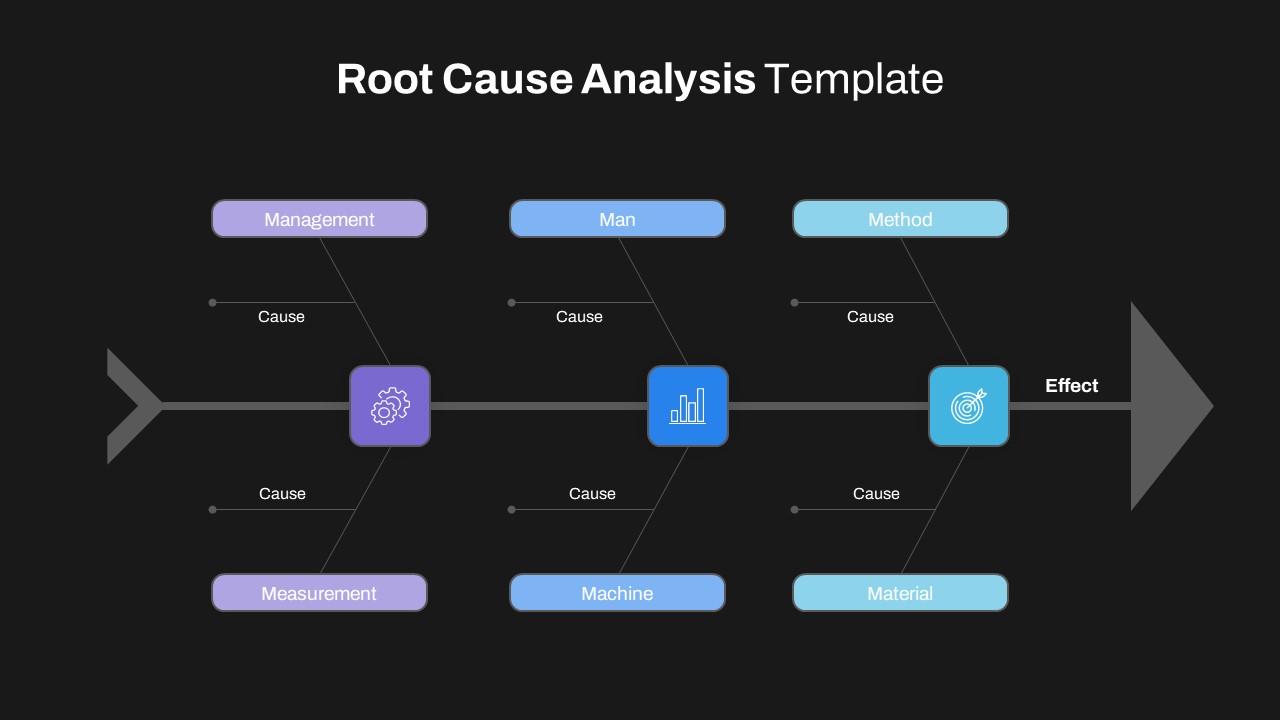
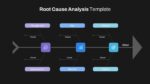
The cause and effect Google Slide presentation shows a fishbone diagram in a black and white background option.
The fishbone design is filled with editable text placeholders all around the structure where you can insert your variables, causes and effects with the support of an infographic clipart.
It helps you to provide an overall picture of the effect by delineating causes. download cause and effect Google Slide template now!
See more

Aspect Ratio
16:9Item ID
SKT00849
FAQs
You May Also Like These Presentation Templates
- Free
- Free
- Free
- Free