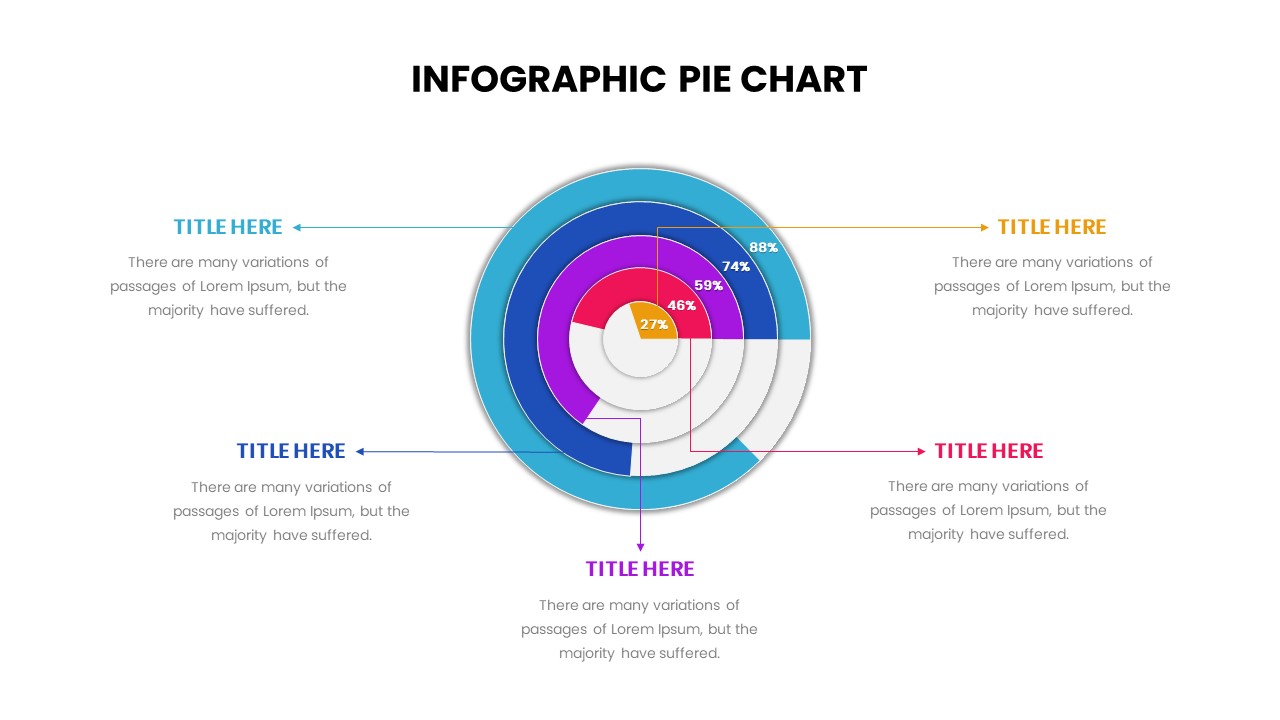
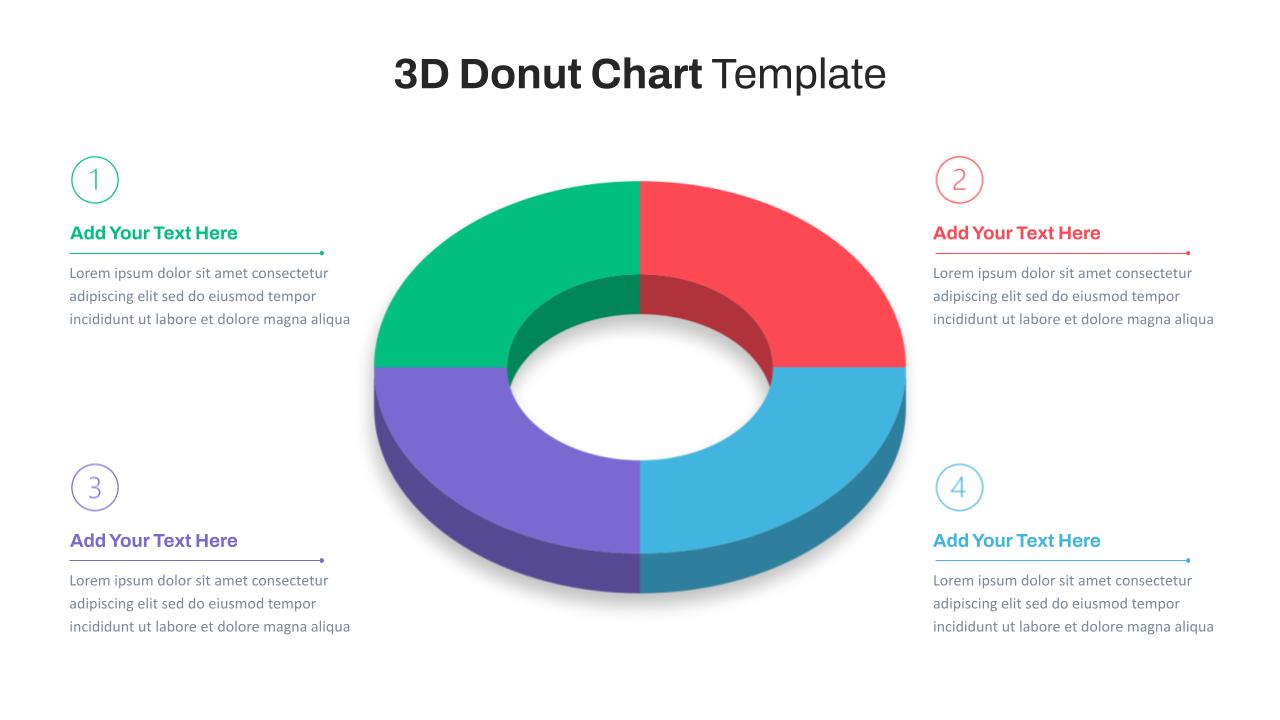
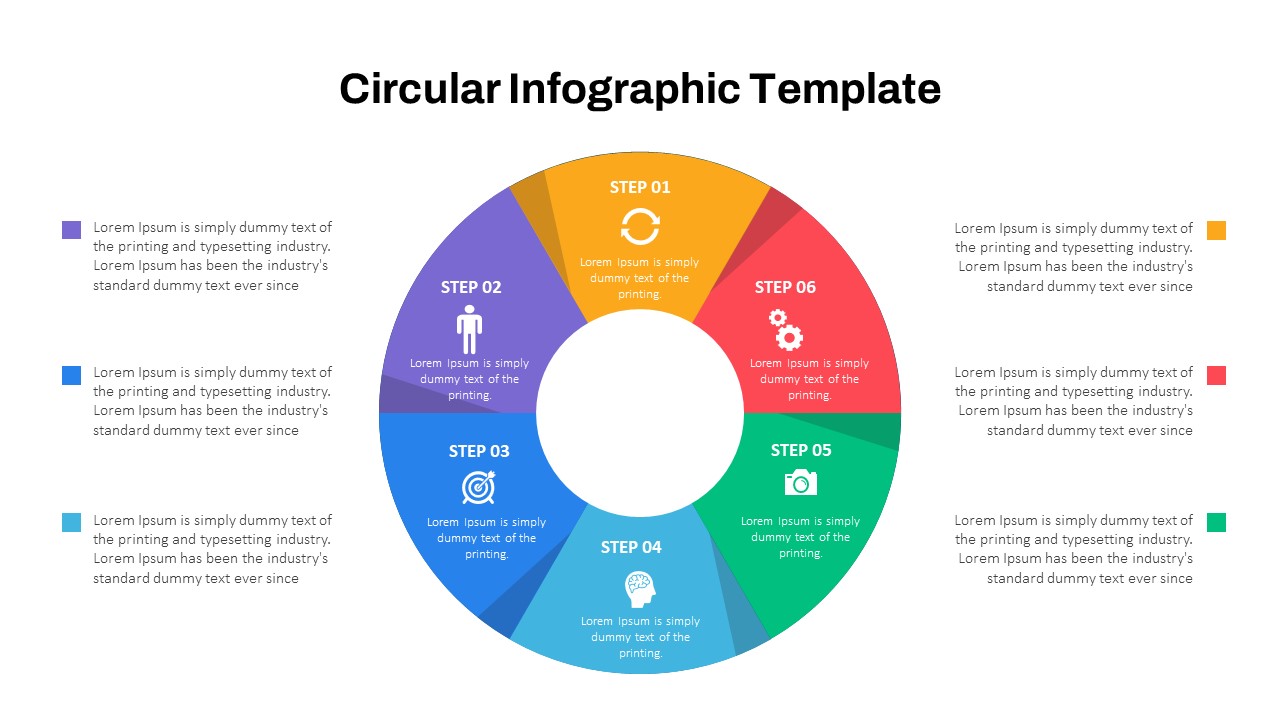
Pie Chart Presentation Slide
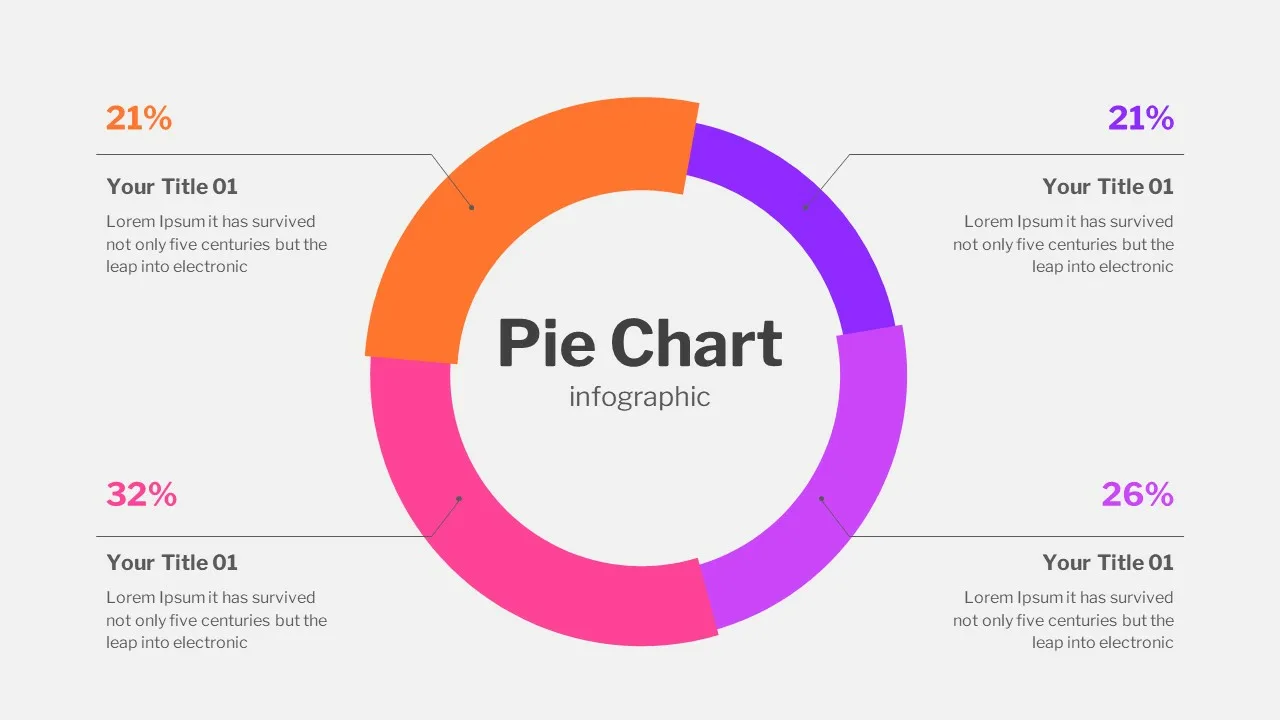
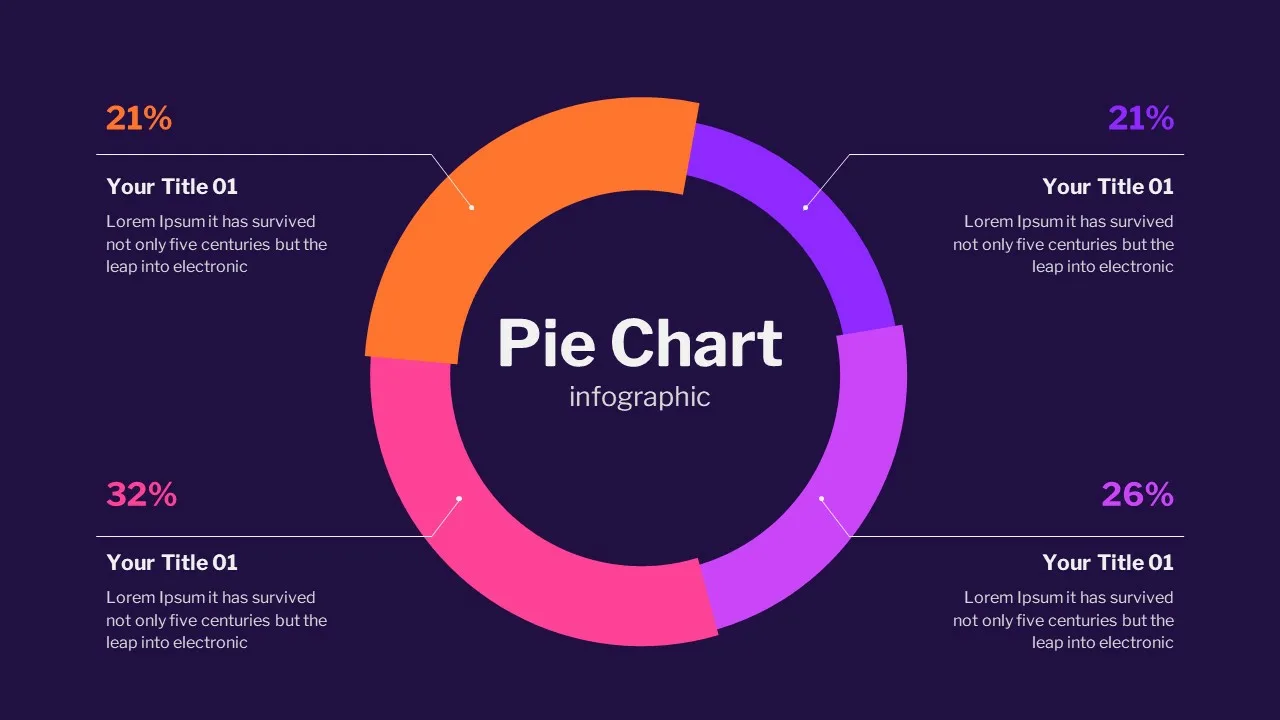

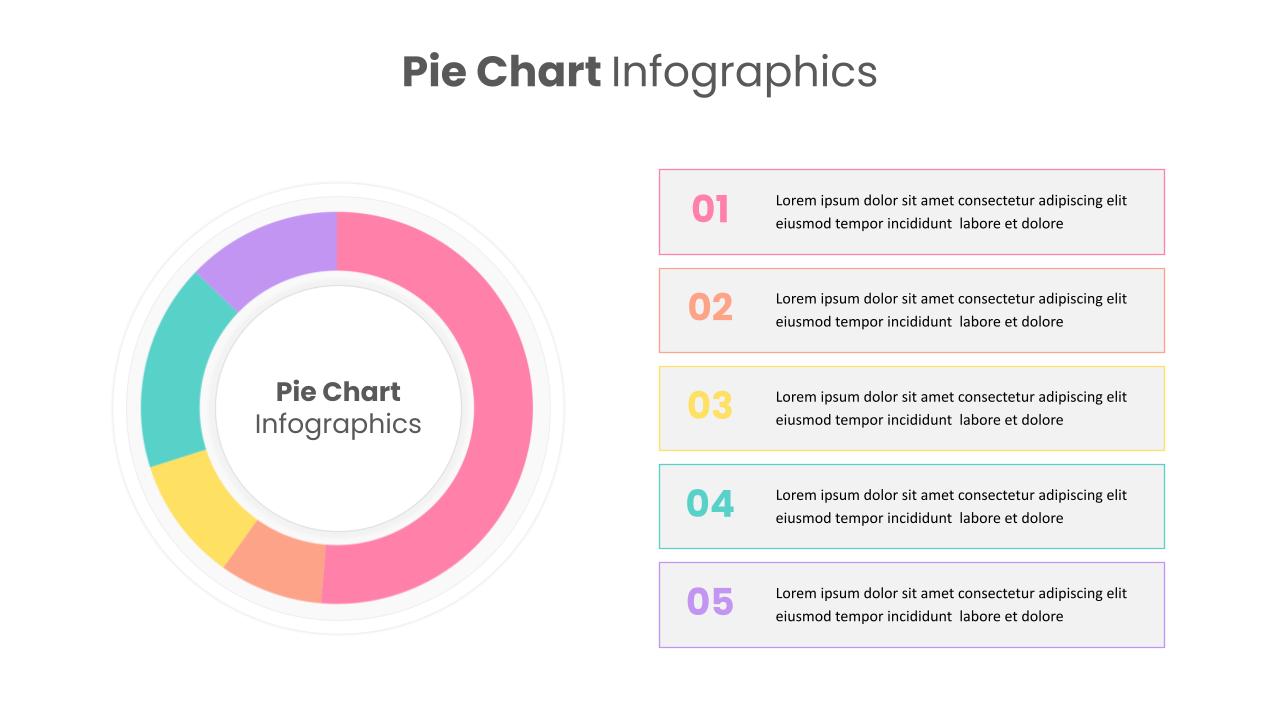
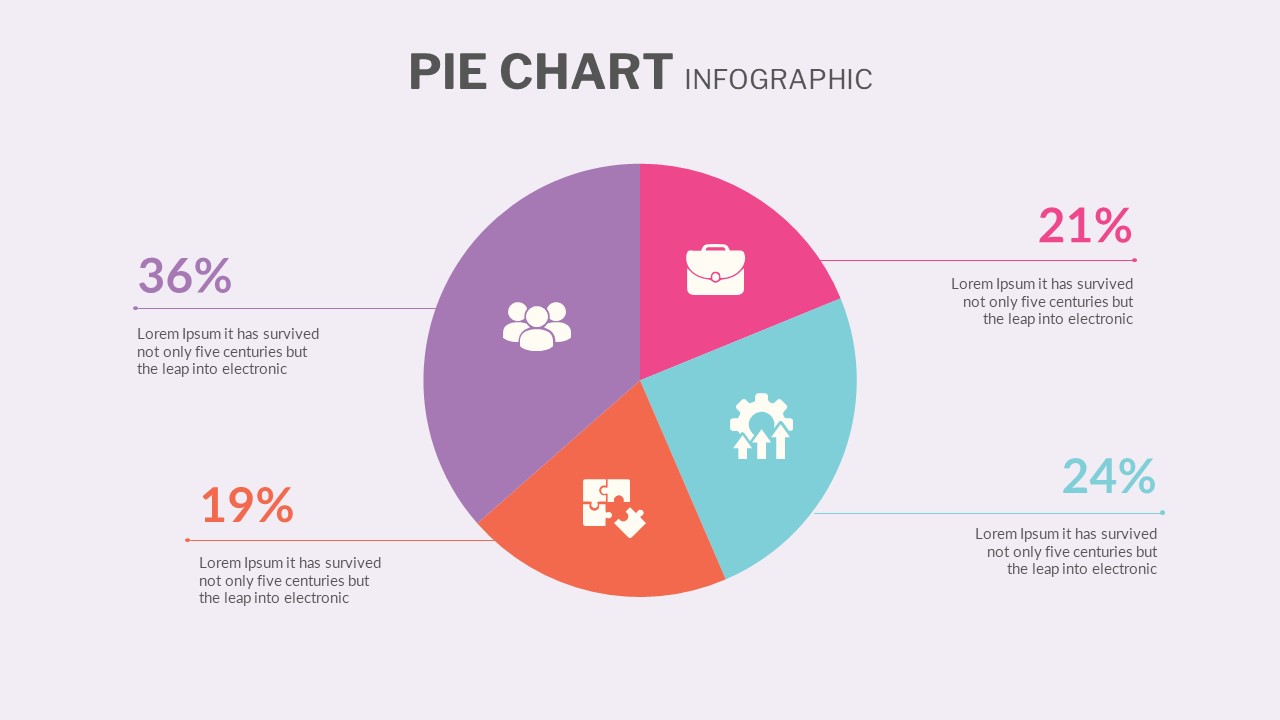
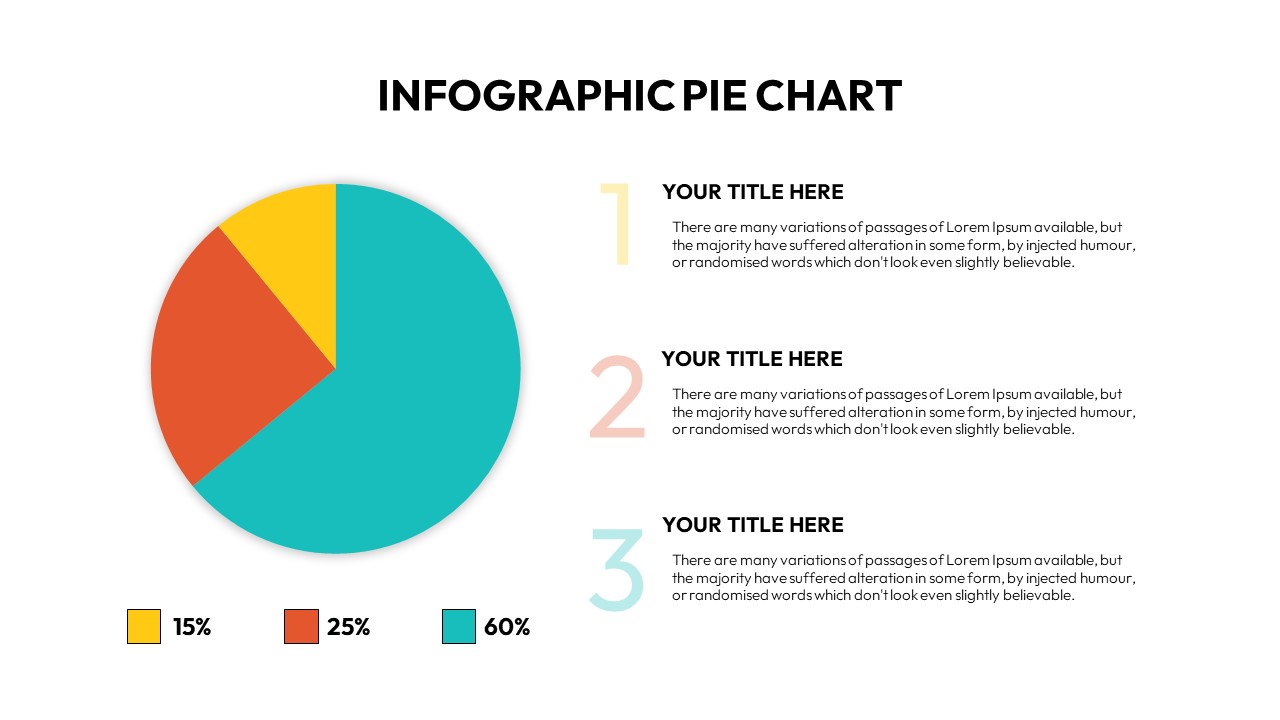
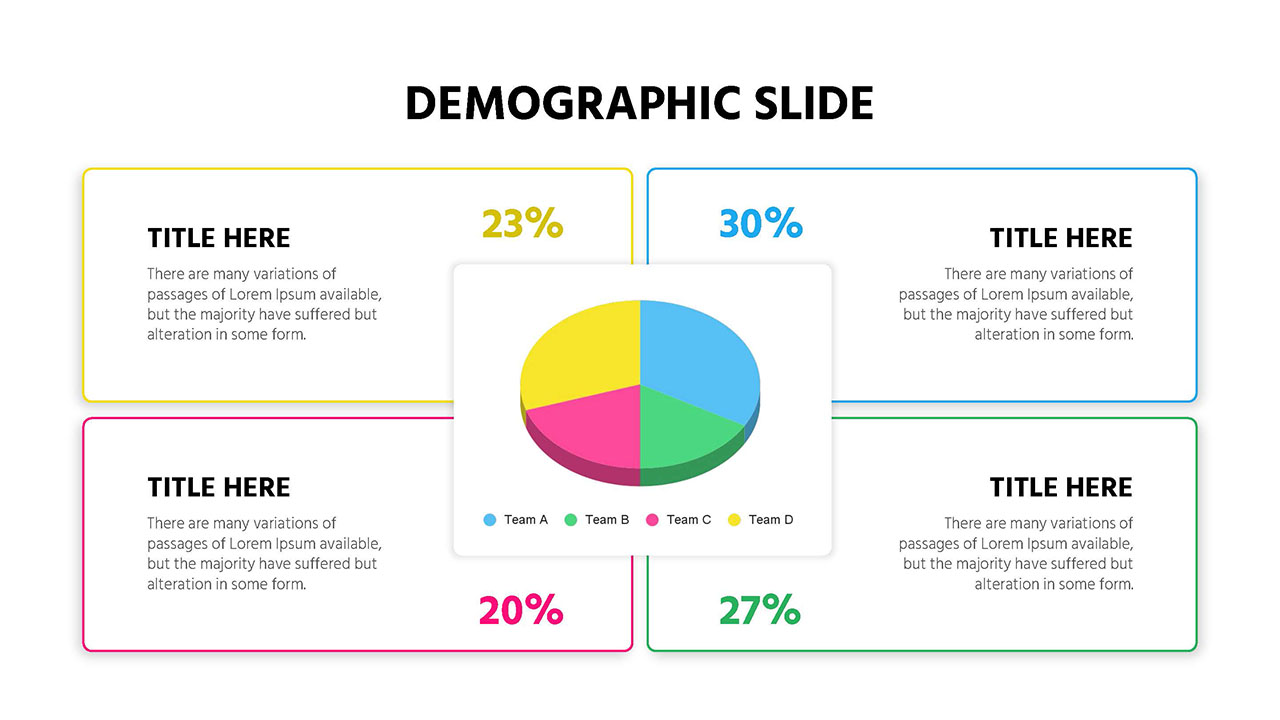
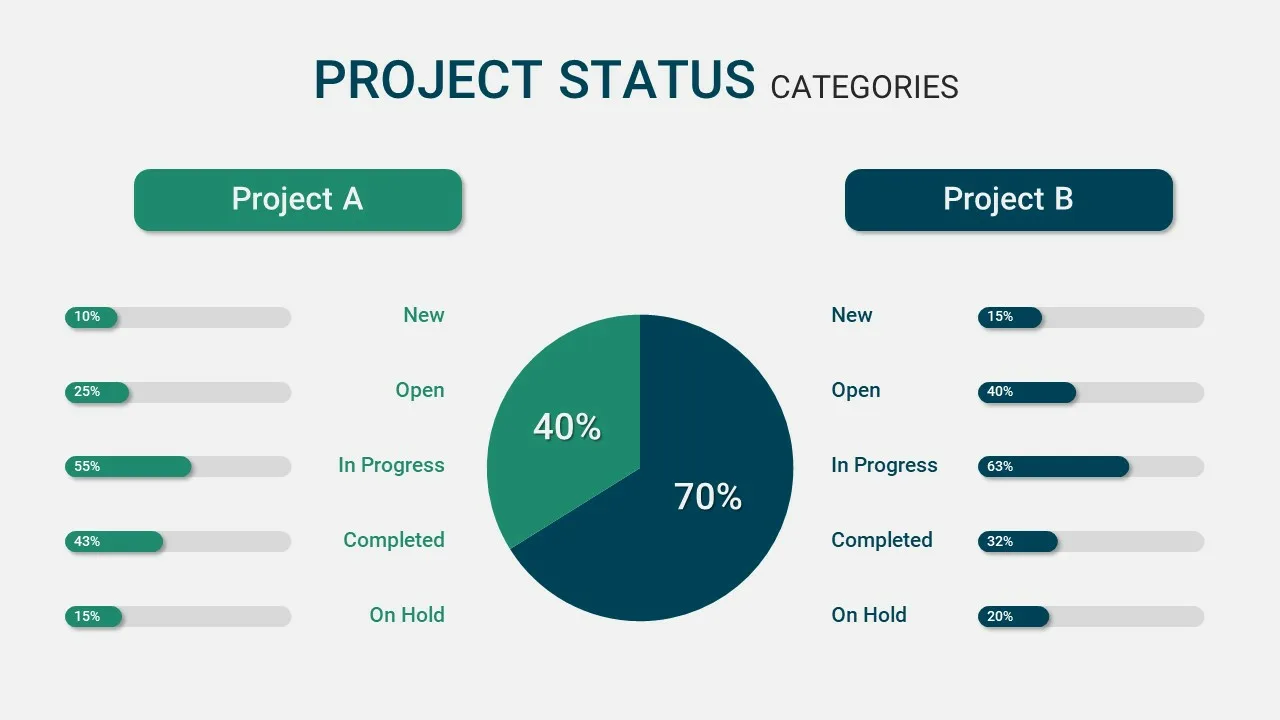
Pie Chart Slide offers four segments of presentation design to show data in hand. Pie charts for Google Slides presentations help viewers easily understand the message using clear statistical tools rather than a worksheet or explanative documents. Here, the pie chart ring segments show the different data values when seeing the divisions’ unequal shape and size. Each pie division is colored differently to distinguish distributions easily. Besides, the Pie Chart Presentation contains text zones on either side. It is perfect for picturing the part-to-whole correlation of each functional area. Use a pie chart for graphical data representation with edit options.
See more

Aspect Ratio
16:9Item ID
SKT00597
You May Also Like These Presentation Templates
- Free
- Free
- Free
- Free
- Free
- Free
- Free