Stakeholder Analysis Diagram PowerPoint Template
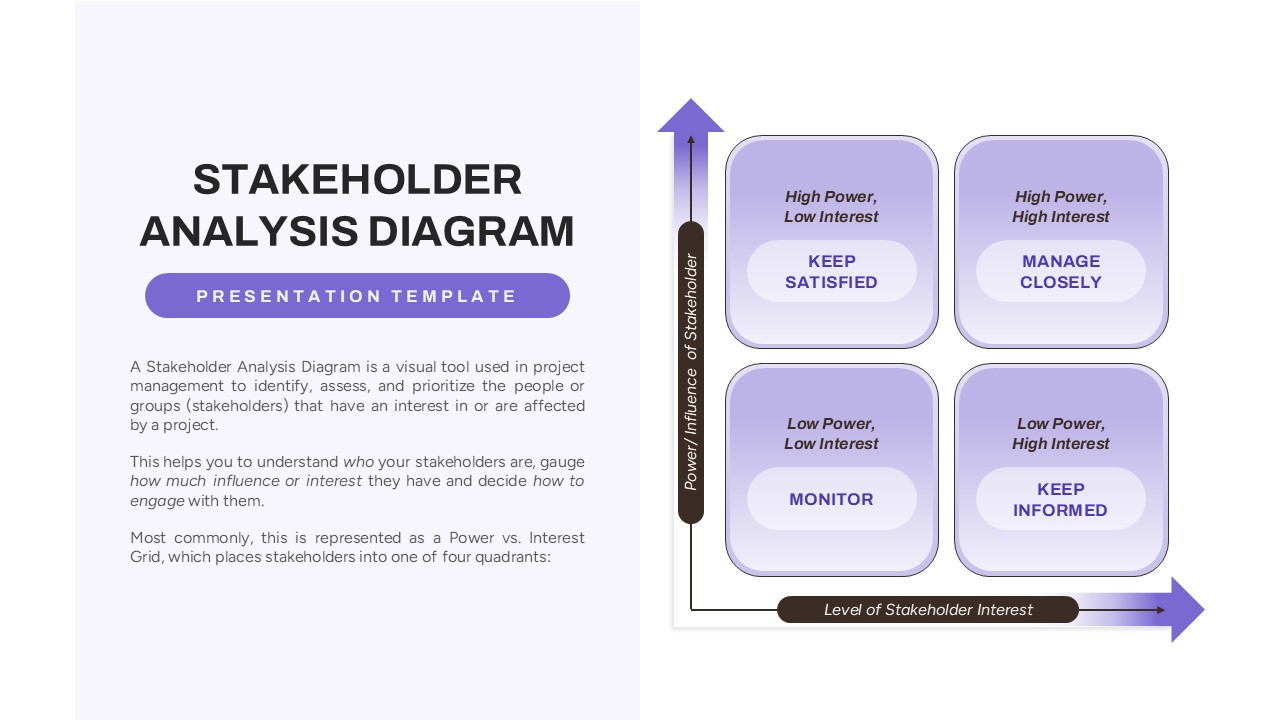
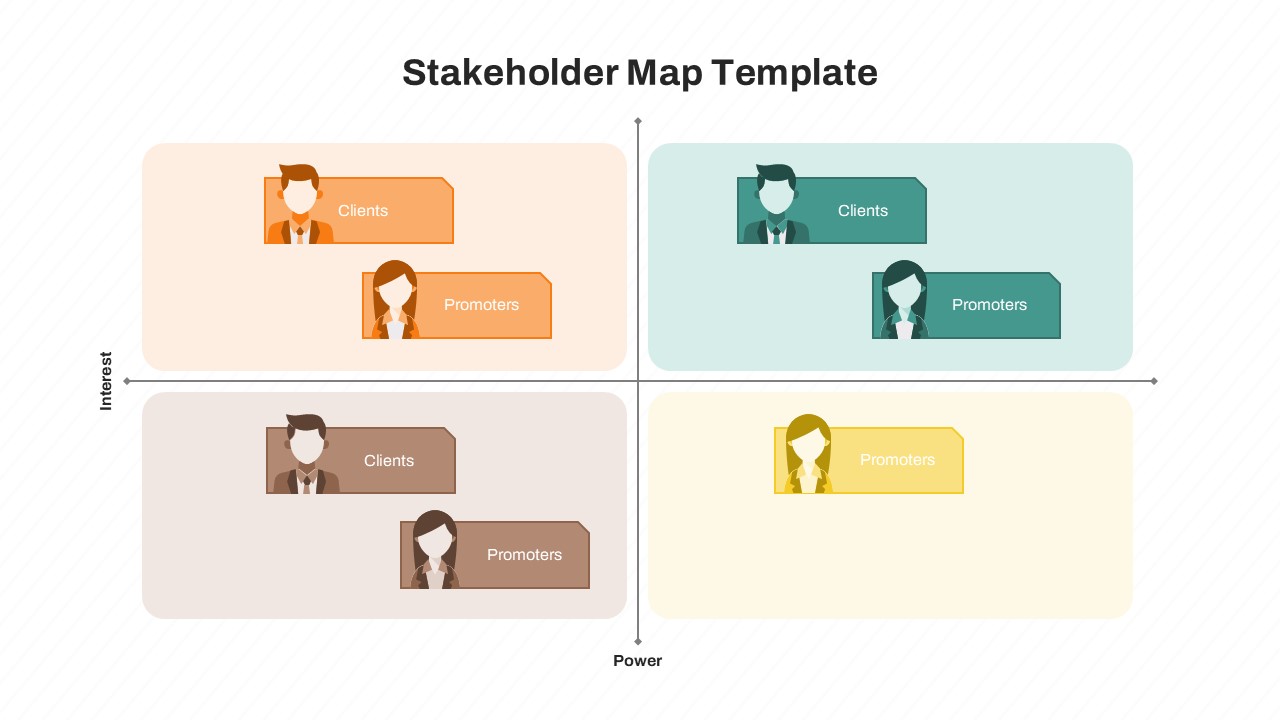
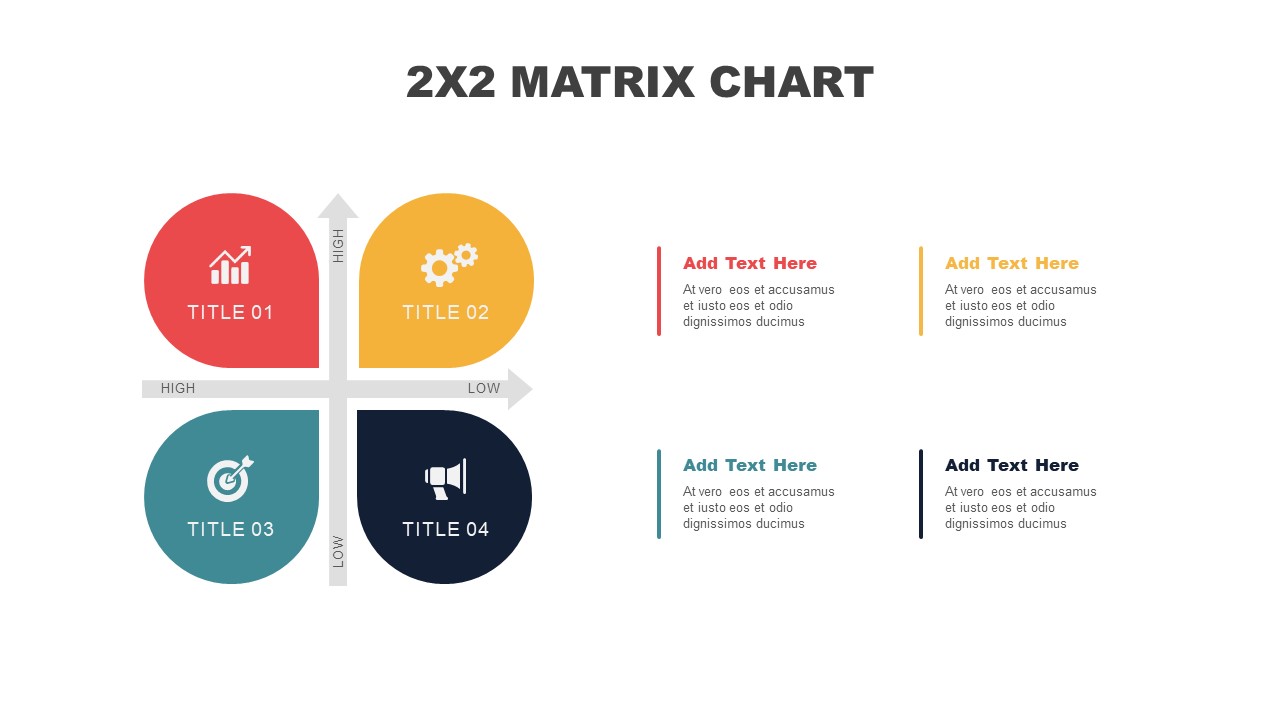
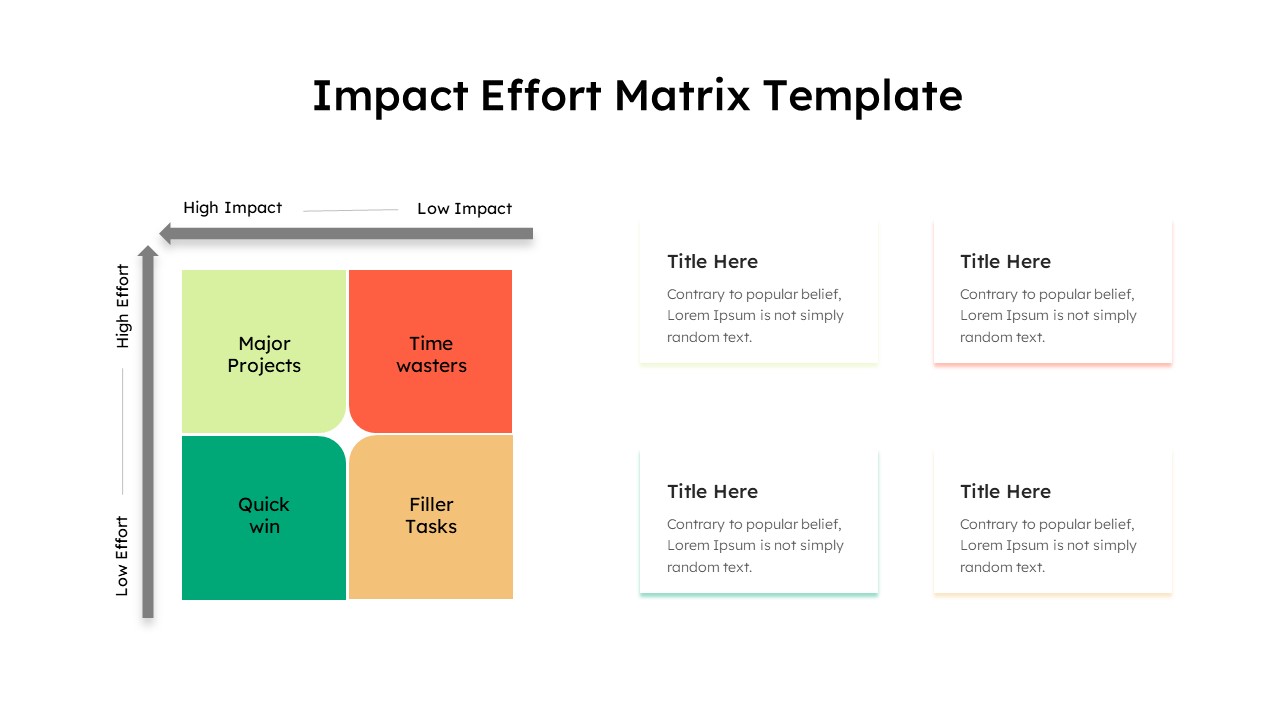
The Stakeholder Analysis Diagram PowerPoint Template is a strategic visual tool designed to help project managers and teams identify, assess, and prioritize stakeholders based on their power and interest levels. This stakeholder analysis example template employs a Power vs. Interest grid, dividing stakeholders into four distinct quadrants: Keep Satisfied (High Power, Low Interest), Manage Closely (High Power, High Interest), Monitor (Low Power, Low Interest), and Keep Informed (Low Power, High Interest).
By clearly mapping stakeholder influence and engagement needs, this tool facilitates informed decision-making on how to communicate and collaborate effectively throughout the project lifecycle. The clean and professional layout combines concise descriptions with a visually intuitive grid, enhancing understanding and presentation impact.
Suitable for project management, business analysis, and team leadership presentations, this template supports efforts to build stakeholder alignment, mitigate risks, and ensure project success. Available for PowerPoint and Google Slides, it can be easily customized to fit any project’s unique stakeholder landscape.
See more

Aspect Ratio
16:9Item ID
SKT03778
Features of this template
Other User Cases of the Template:
Project stakeholder mapping, Risk management planning, Communication strategy development, Change management presentations, Business analysis sessions, Team leadership meetings, Client relationship management, Organizational alignment workshops
FAQs
You May Also Like These Presentation Templates


- Free

- Free
- Free
- Free
- Free
- Free