Profit and Loss Dashboard PowerPoint Template
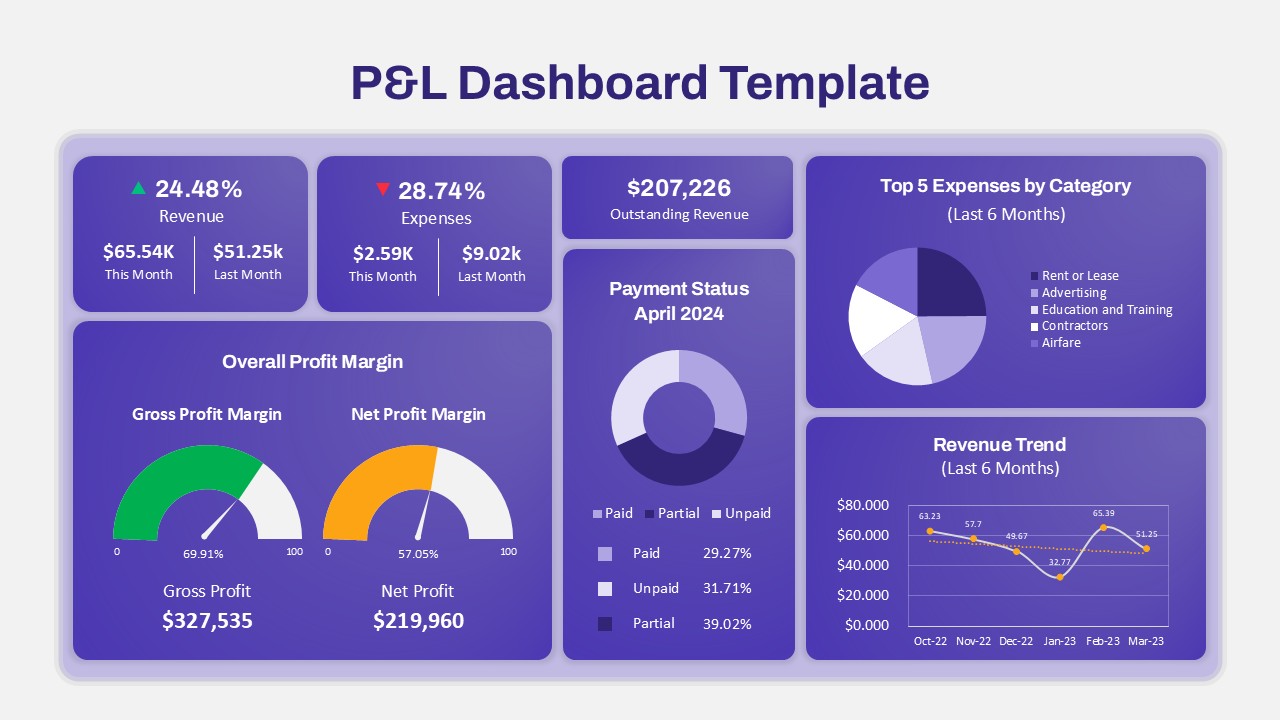
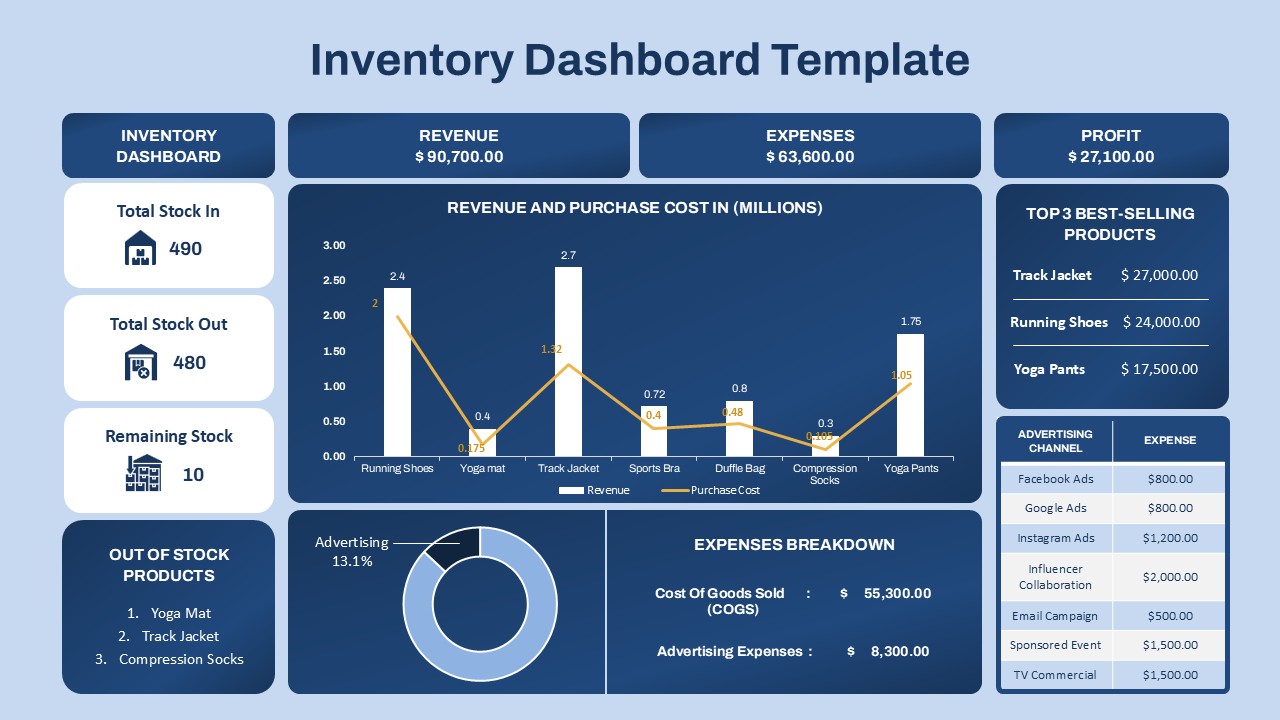
The profit and loss dashboard powerpoint template is an essential visual tool designed to provide a comprehensive snapshot of a company’s financial health, focusing on profit and loss metrics. This powerpoint dashboard consolidates key financial data such as revenue, expenses, profit margins, outstanding revenue, payment status, and trends, offering a clear and actionable overview for business owners, financial analysts, and executives.
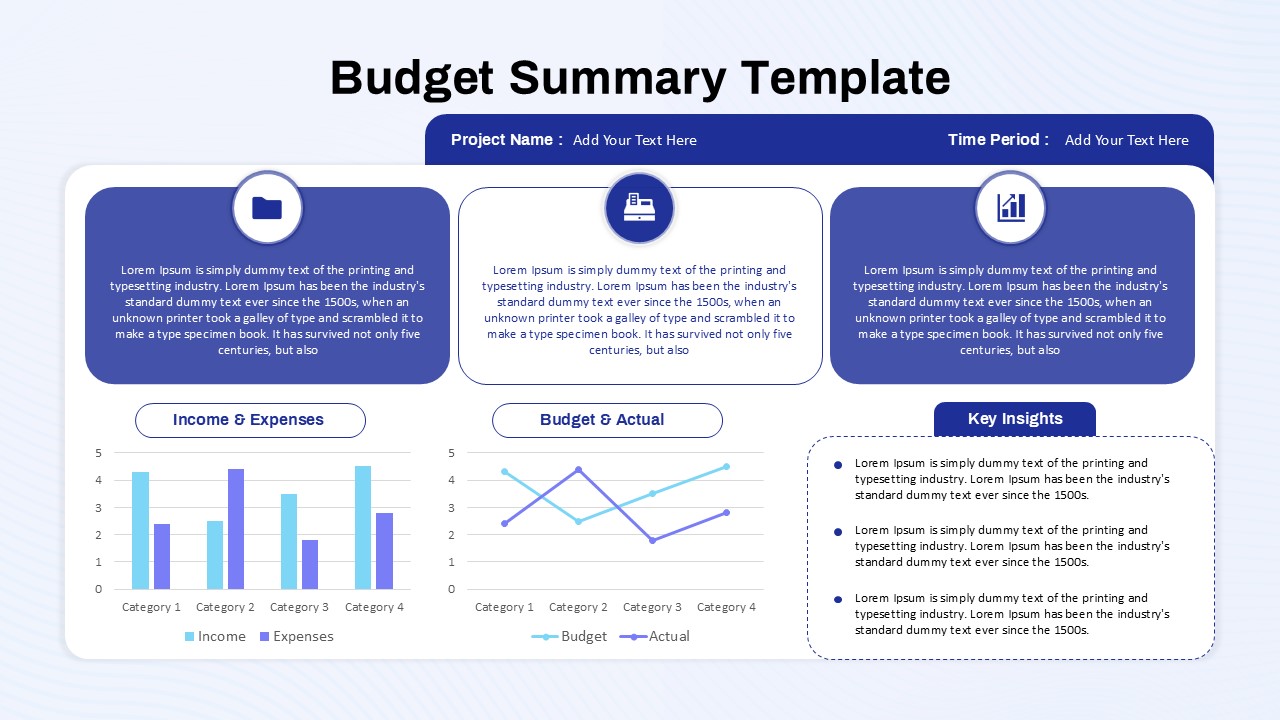
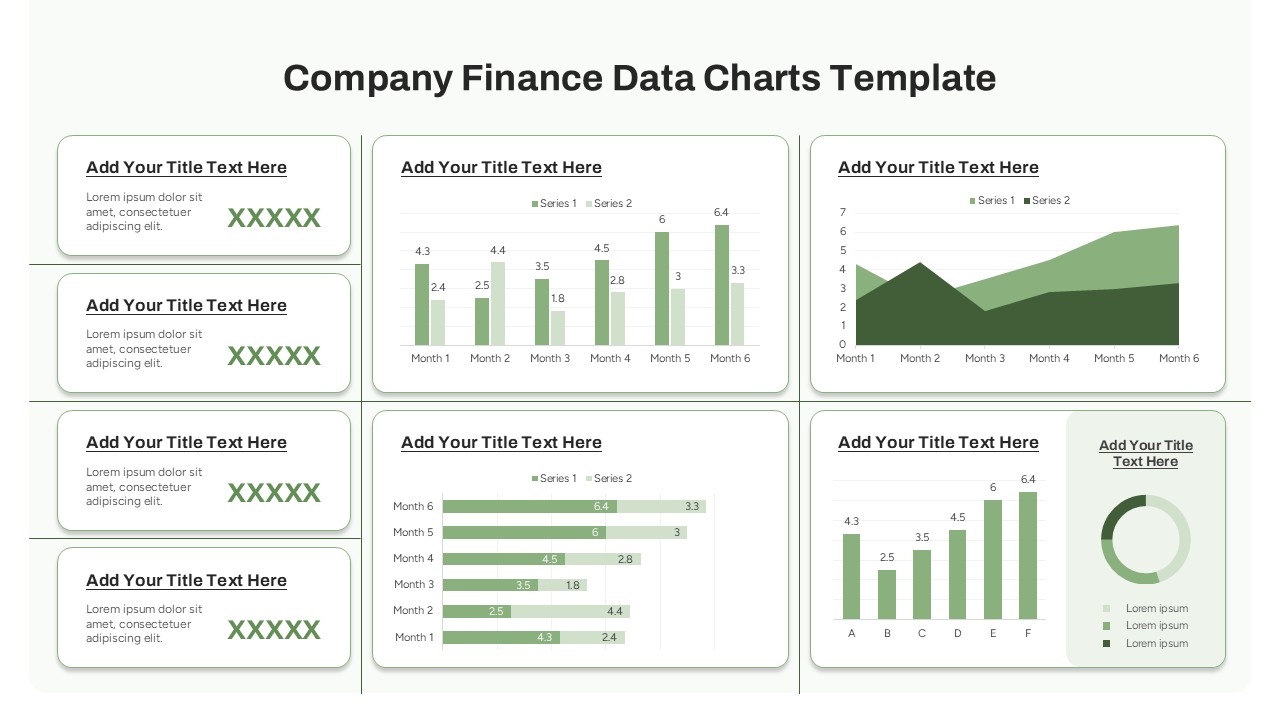
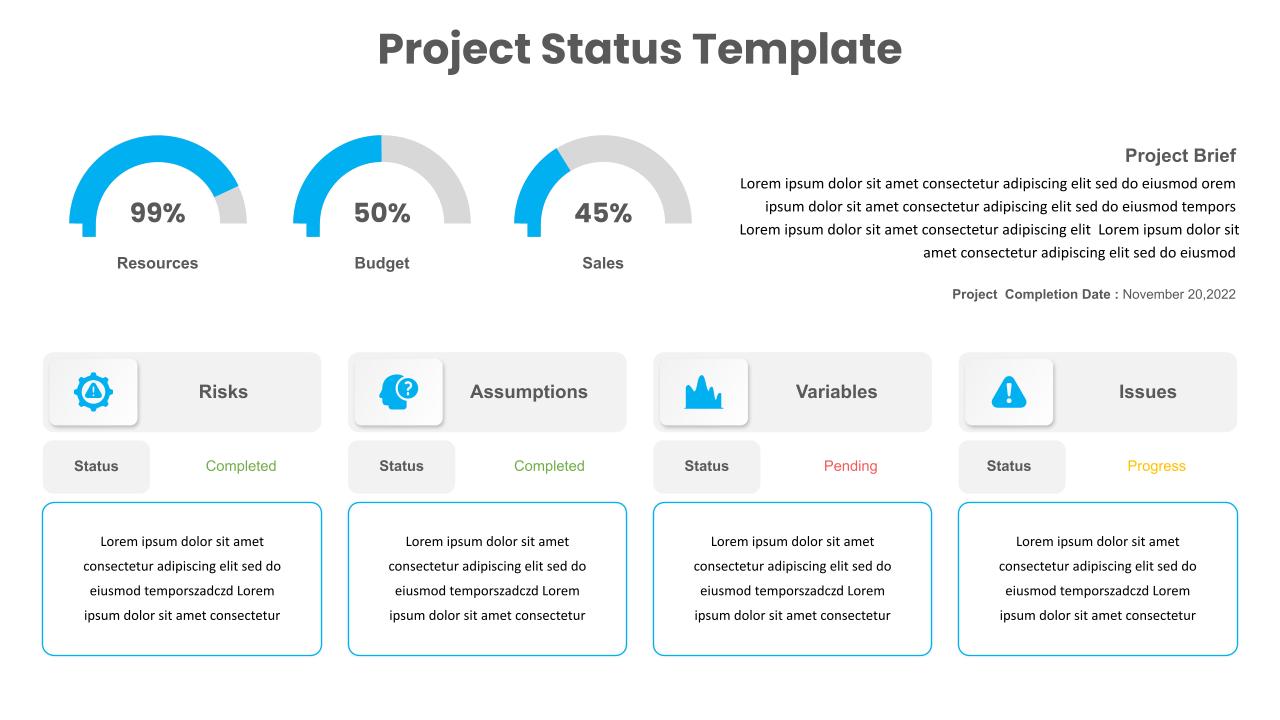
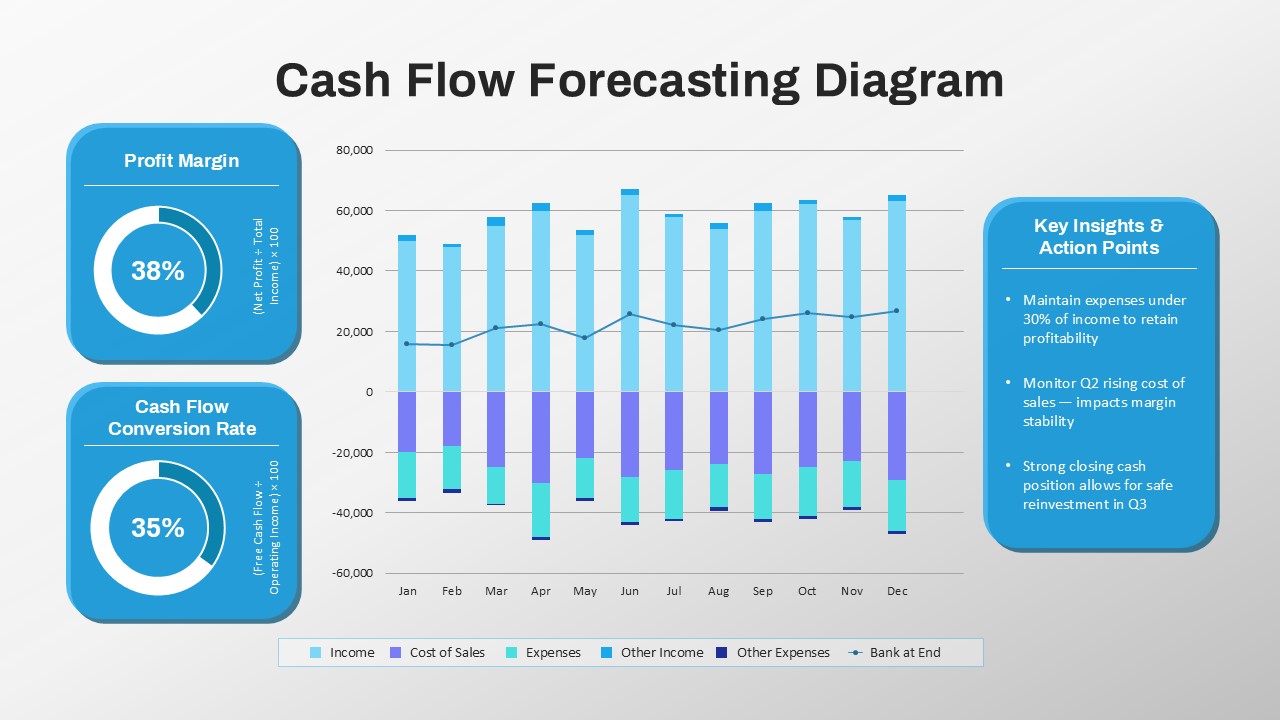
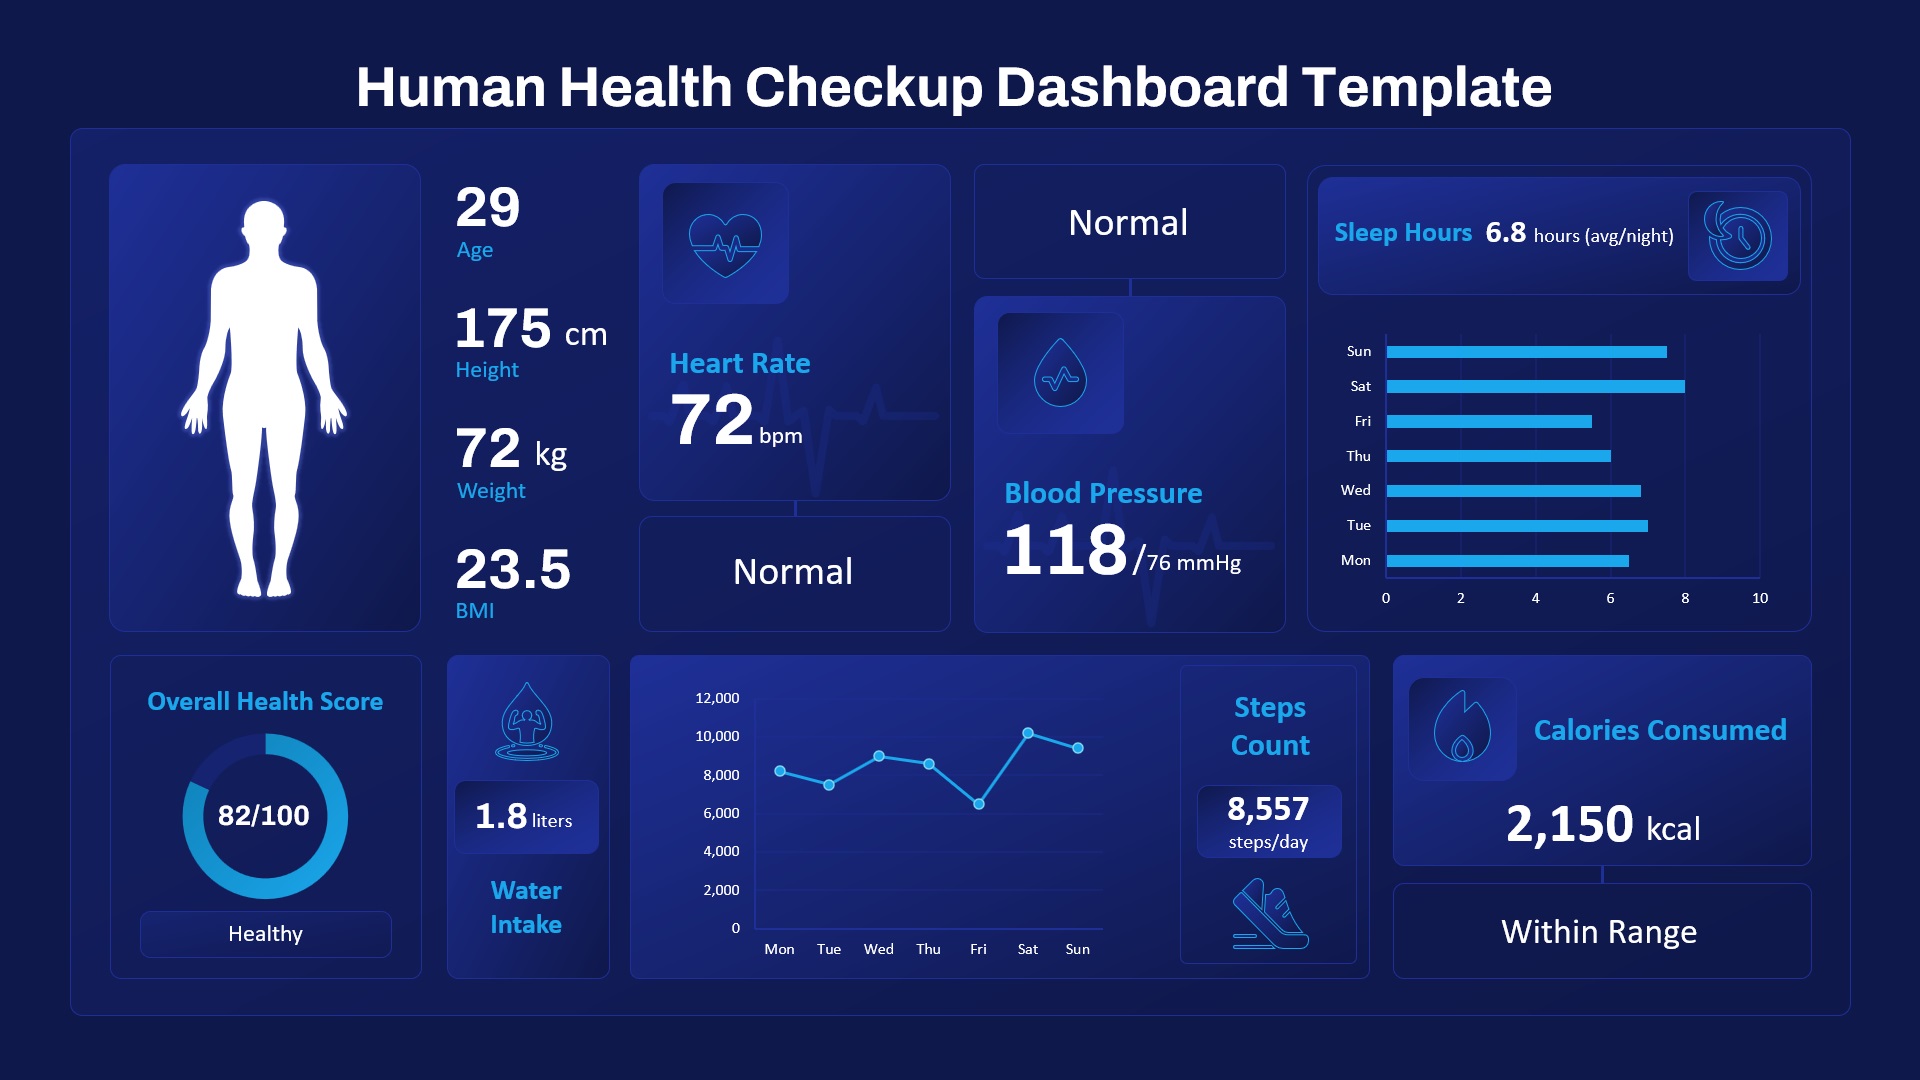
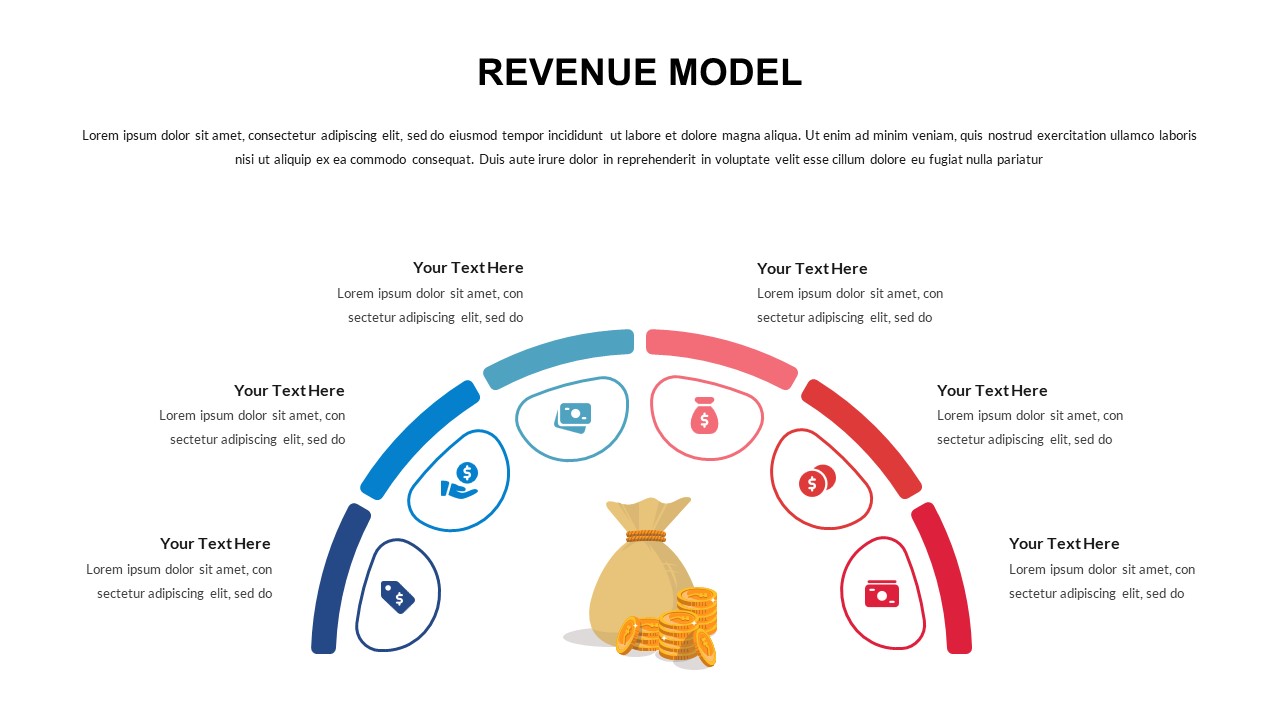
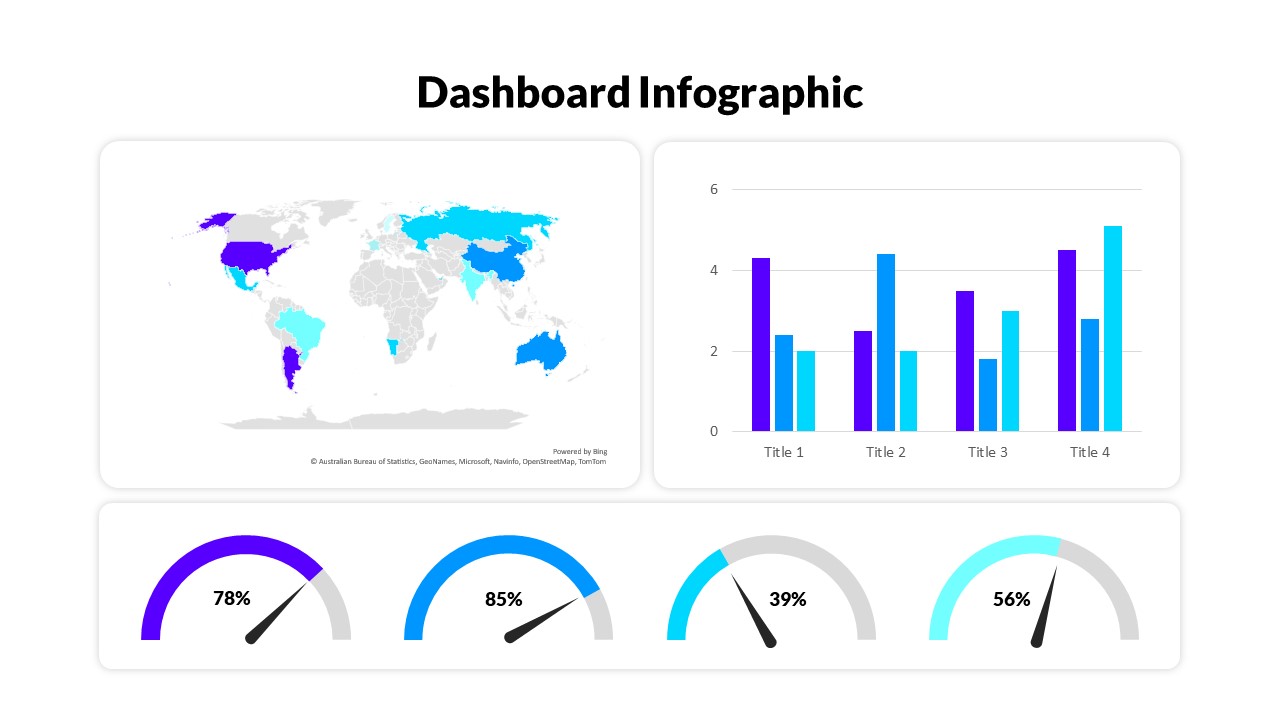
Featuring visually distinct sections, the template displays current versus previous month comparisons for revenue and expenses, coupled with intuitive gauge charts representing gross and net profit margins. A payment status chart highlights the proportions of paid, partial, and unpaid balances, ensuring cash flow tracking remains transparent. Complementary pie charts and trend lines break down top expense categories and revenue trends over six months, enabling informed decision-making and strategic planning.
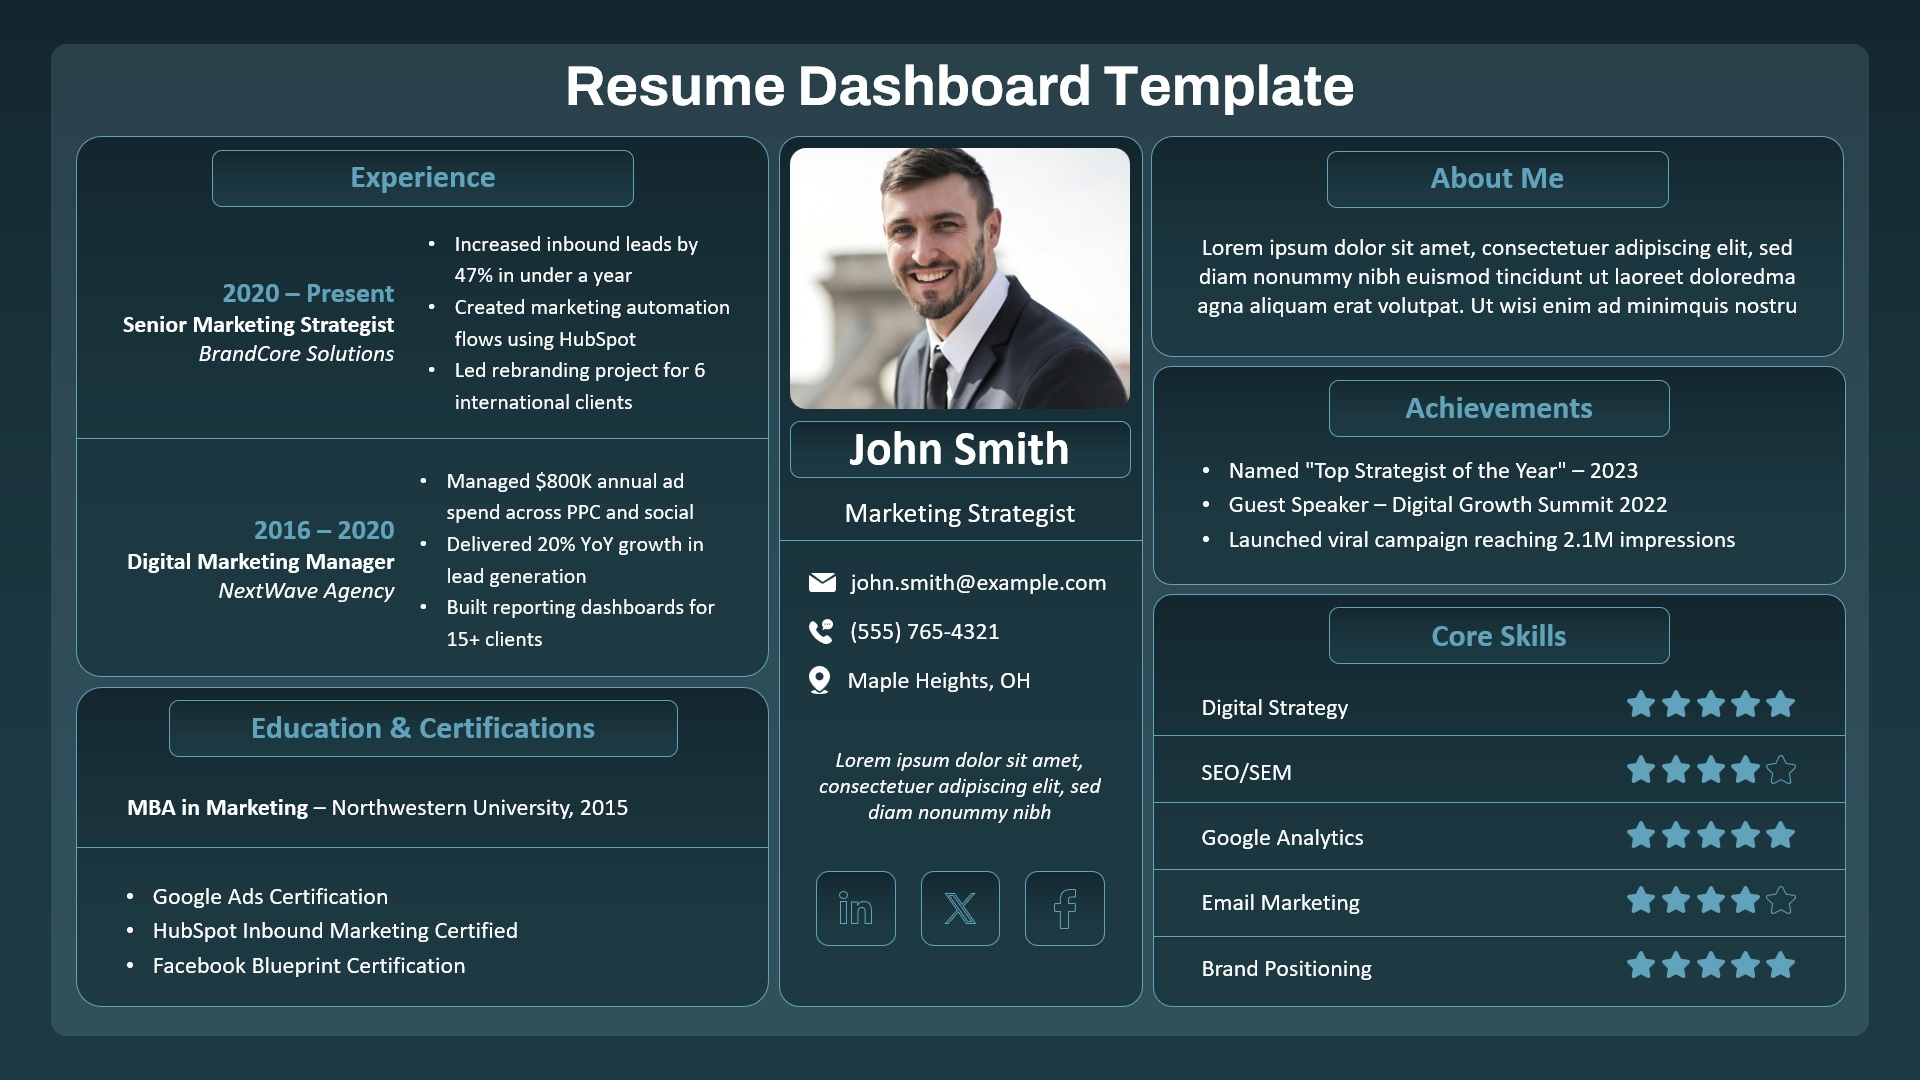
Designed for easy customization in both PowerPoint and Google Slides, this template allows users to adapt figures, colors, and labels to match their brand identity and specific financial data. Its clean, modern, and professional layout enhances presentations to stakeholders, simplifying complex financial data into digestible insights.
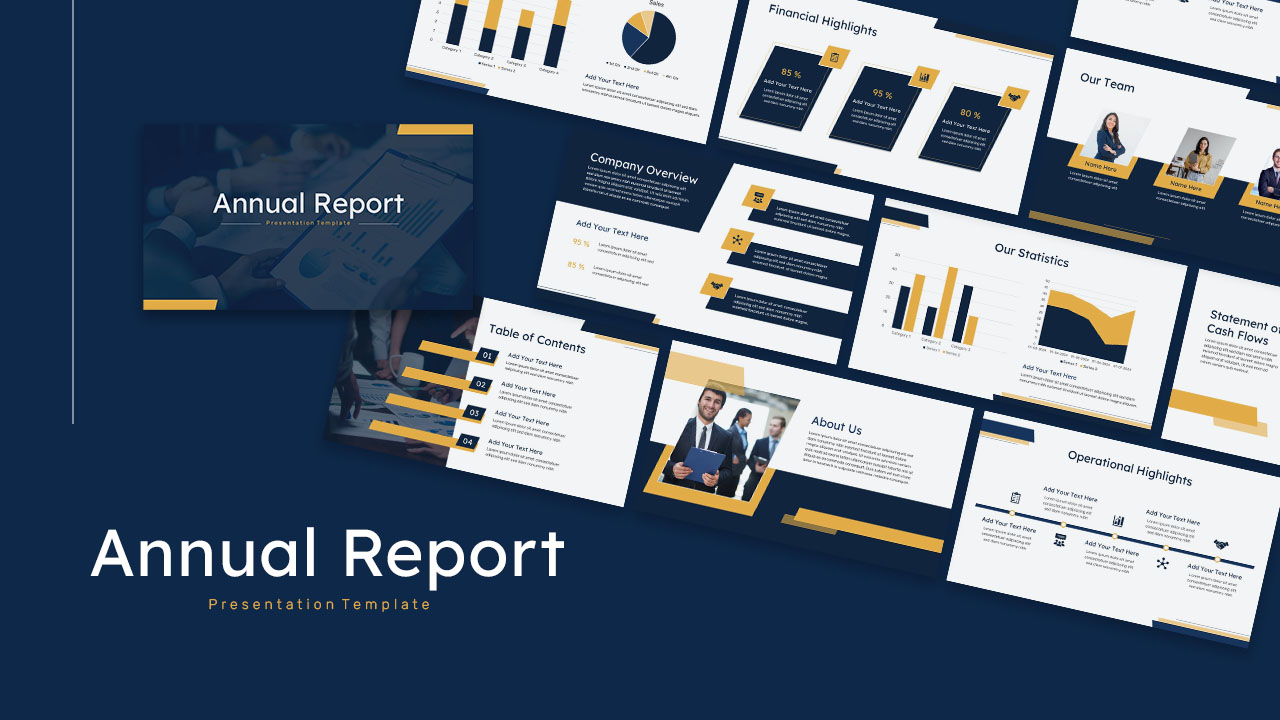
Ideal for monthly financial reviews, board meetings, investor updates, or internal reports, the P&L Dashboard Template elevates your reporting process, making it more engaging and insightful.
See more

Aspect Ratio
16:9Item ID
SKT03985
Features of this template
Other User Cases of the Template:
Financial reporting, Business performance review, Monthly revenue tracking, Expense management, Investor presentations, Board meetings, Budget monitoring, Sales and profit analysis.
FAQs
You May Also Like These Presentation Templates


- Free

- Free

- Free

- Free
- Free
- Free
- Free