Kubler Ross Change Curve PowerPoint and Google Slides
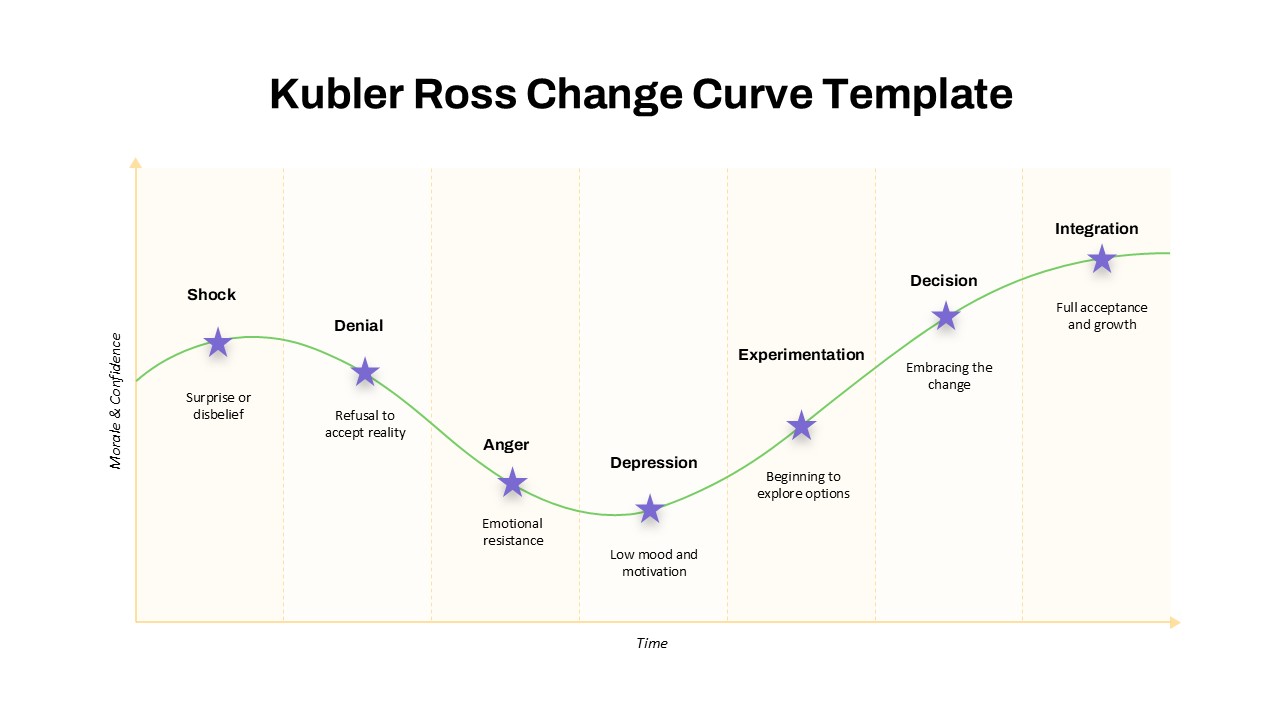
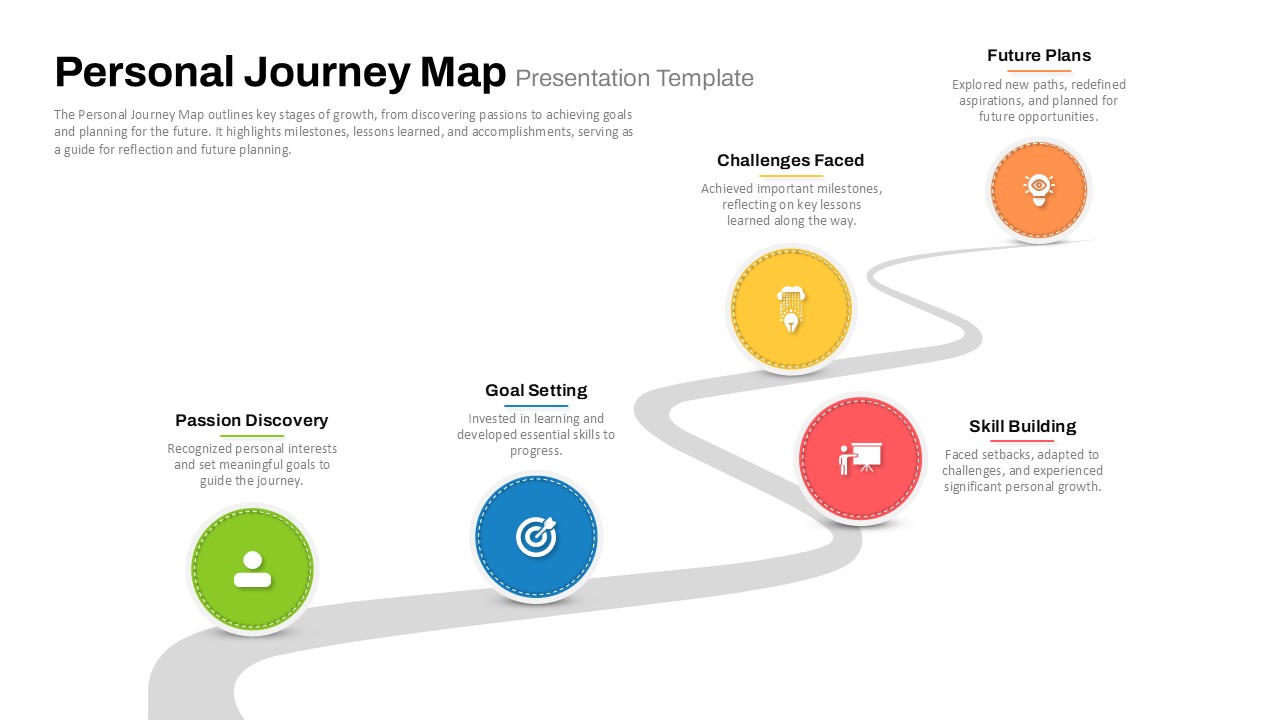
The Kubler Ross Change Curve Template provides a visual representation of the emotional stages people typically experience during a major change or transition. This curve, inspired by the Kubler-Ross model, highlights the progression from initial shock through denial, anger, and depression to eventual acceptance and integration of the change. It is especially useful for understanding the psychological impact of change and can serve as a helpful tool in organizational change management, personal development, or therapy contexts.
This template makes it easy to communicate the emotional journey individuals or teams may undergo, providing clear markers for each stage. The upward curve symbolizes the eventual movement towards growth and acceptance, making the chart a valuable tool for any presentation aimed at managing or explaining change processes. It is designed to be both informative and visually engaging, offering a clean layout with clear labels, making it ideal for presentations that require explaining complex emotional transitions in an easy-to-understand format.
Whether you’re dealing with organizational restructuring, personal development, or a crisis management scenario, the Kubler Ross Change Curve Template can be adapted to suit your needs. By leveraging this template, you can present the emotional stages of change in a structured, empathetic manner that resonates with your audience.
See more

Aspect Ratio
16:9Item ID
SKT03698
Features of this template
Other User Cases of the Template:
Change management, organizational development, emotional intelligence training, leadership training, crisis management, personal growth, therapy sessions, team development, conflict resolution, motivational workshops.
FAQs
You May Also Like These Presentation Templates


- Free
- Free
- Free
- Free
- Free

- Free
- Free
- Free
- Free
- Free
- Free