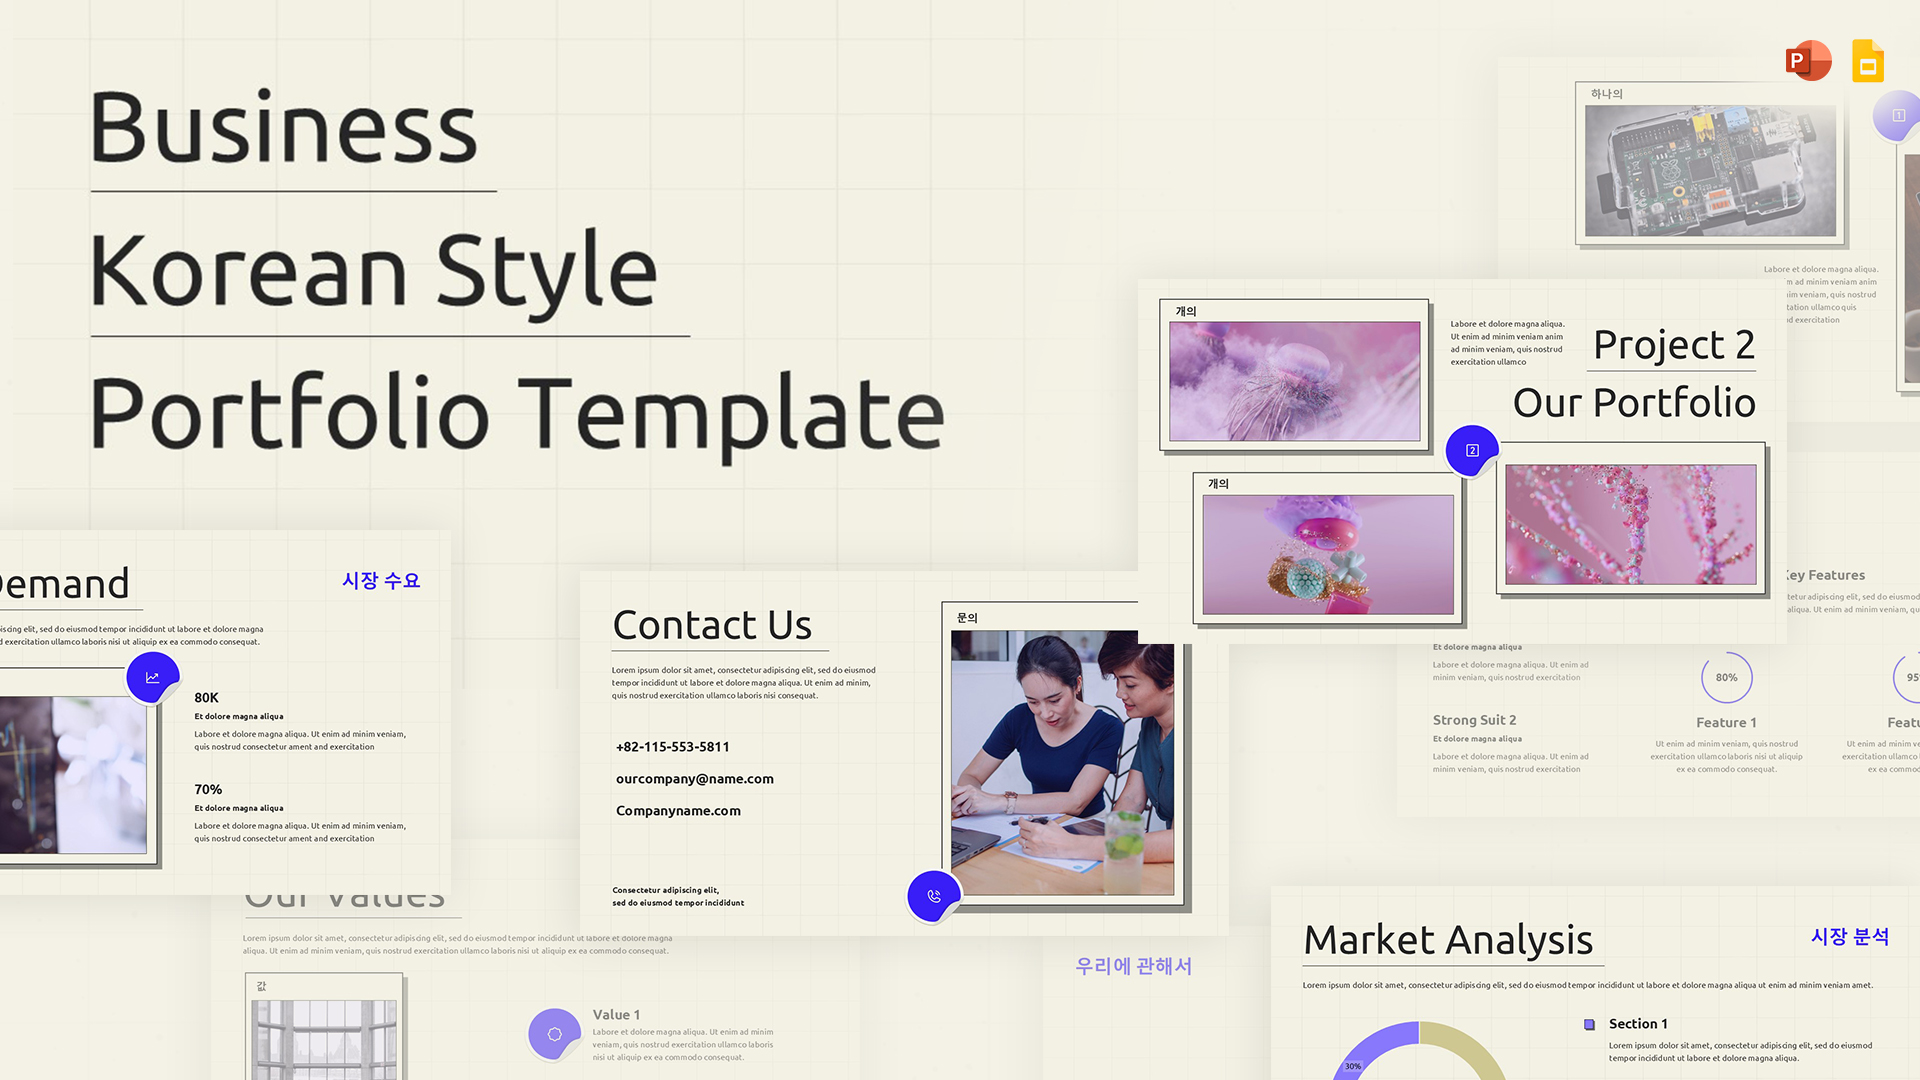
Growth Share Matrix Template for PowerPoint & Google Slides
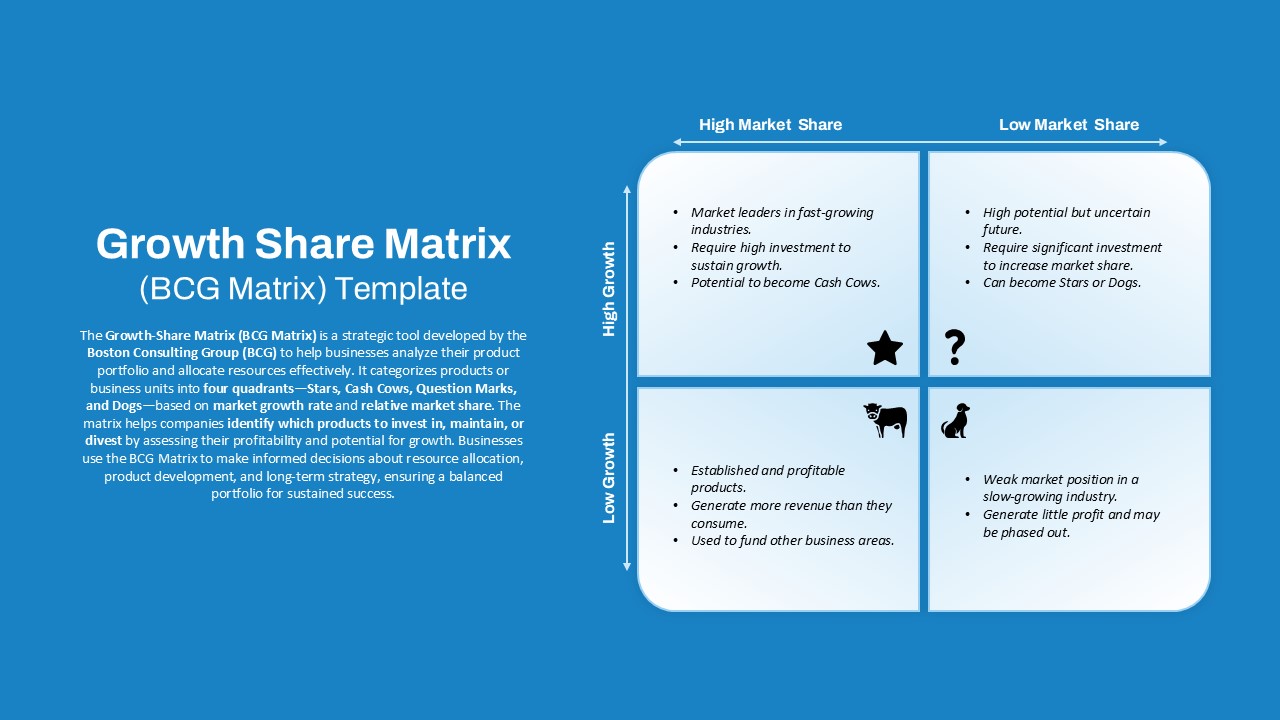
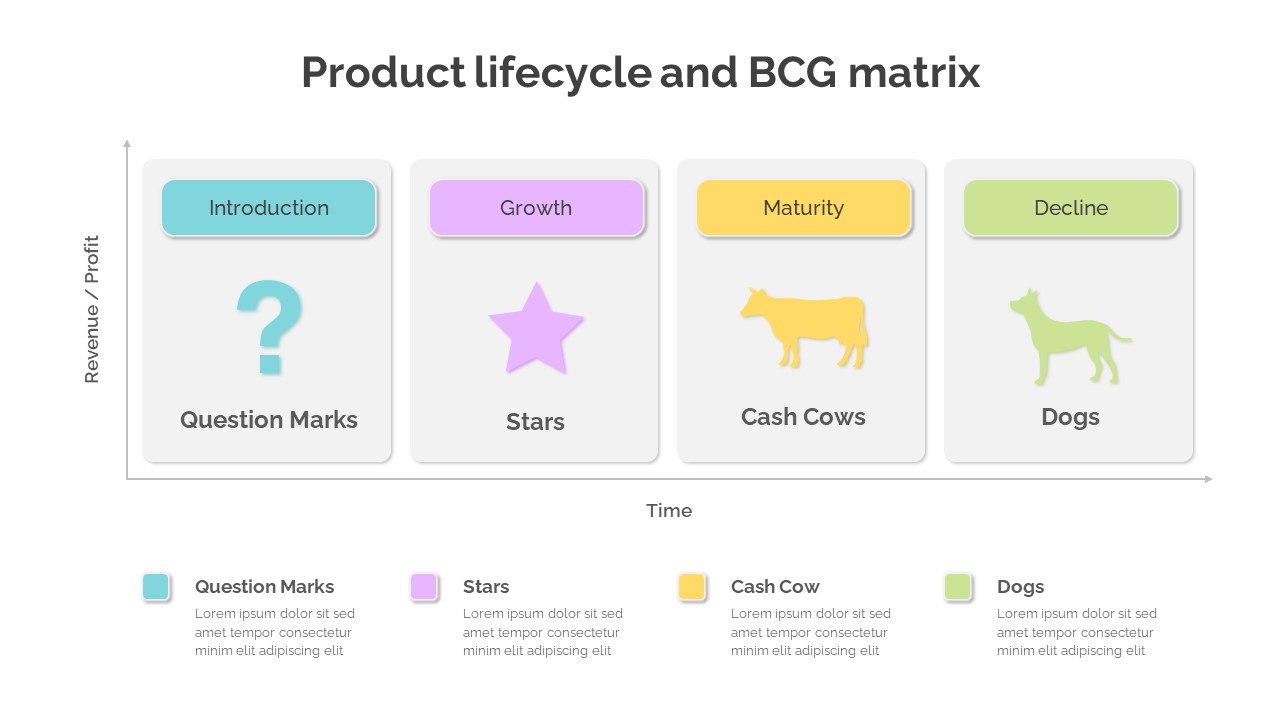
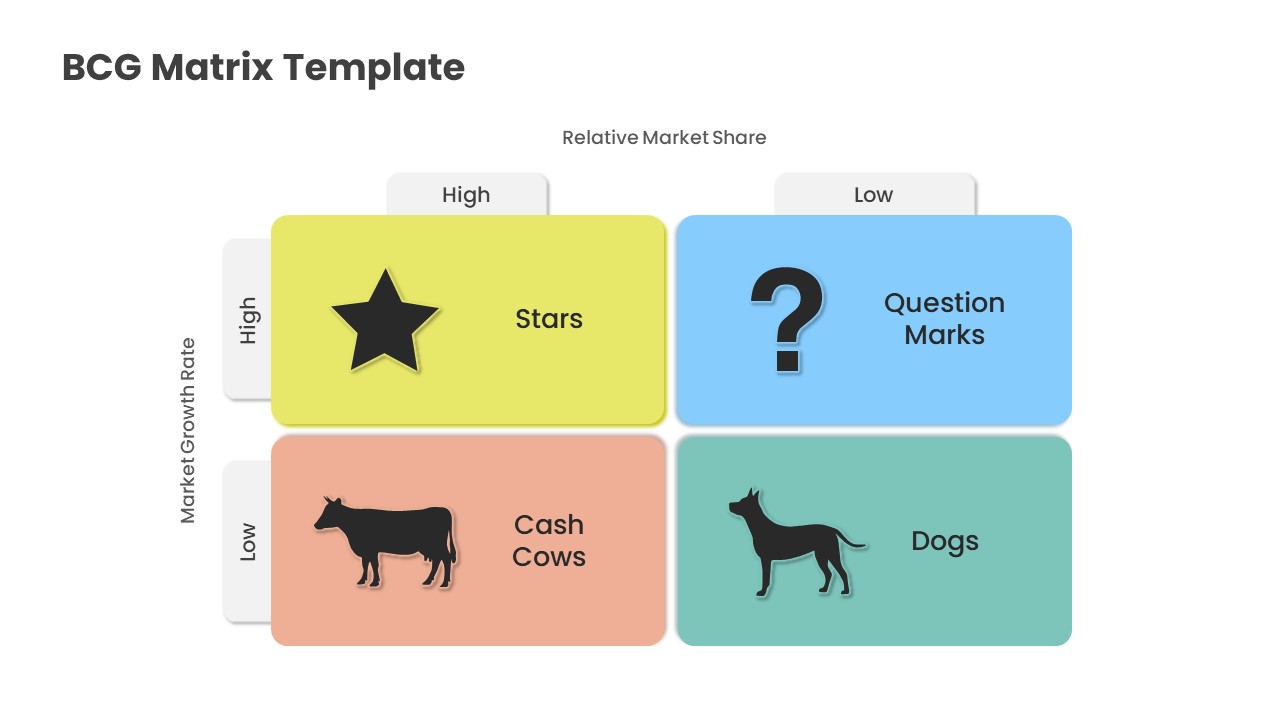
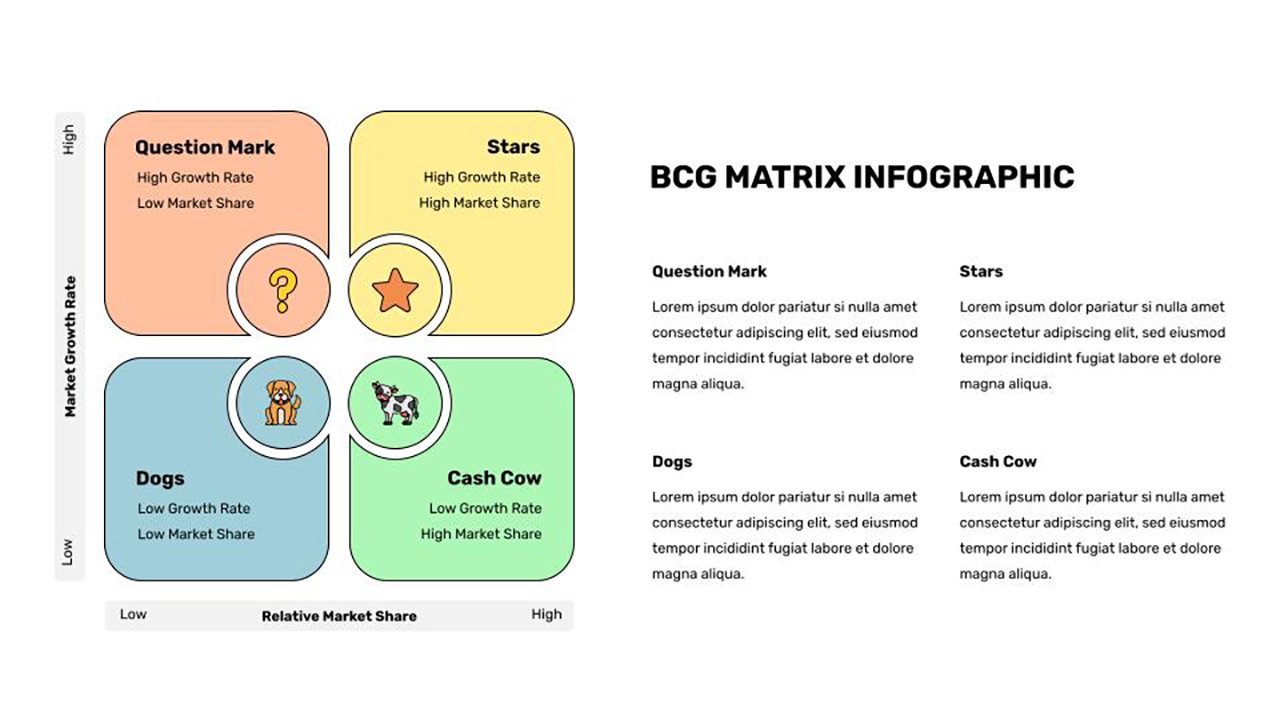
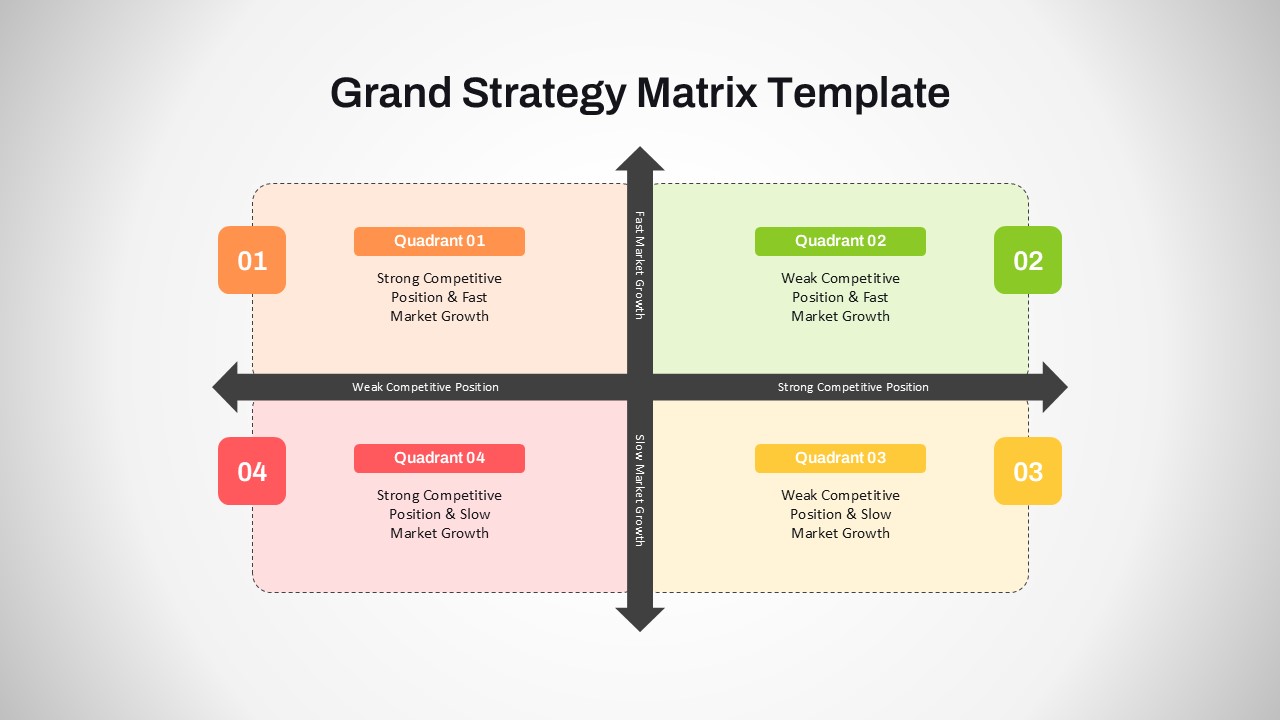
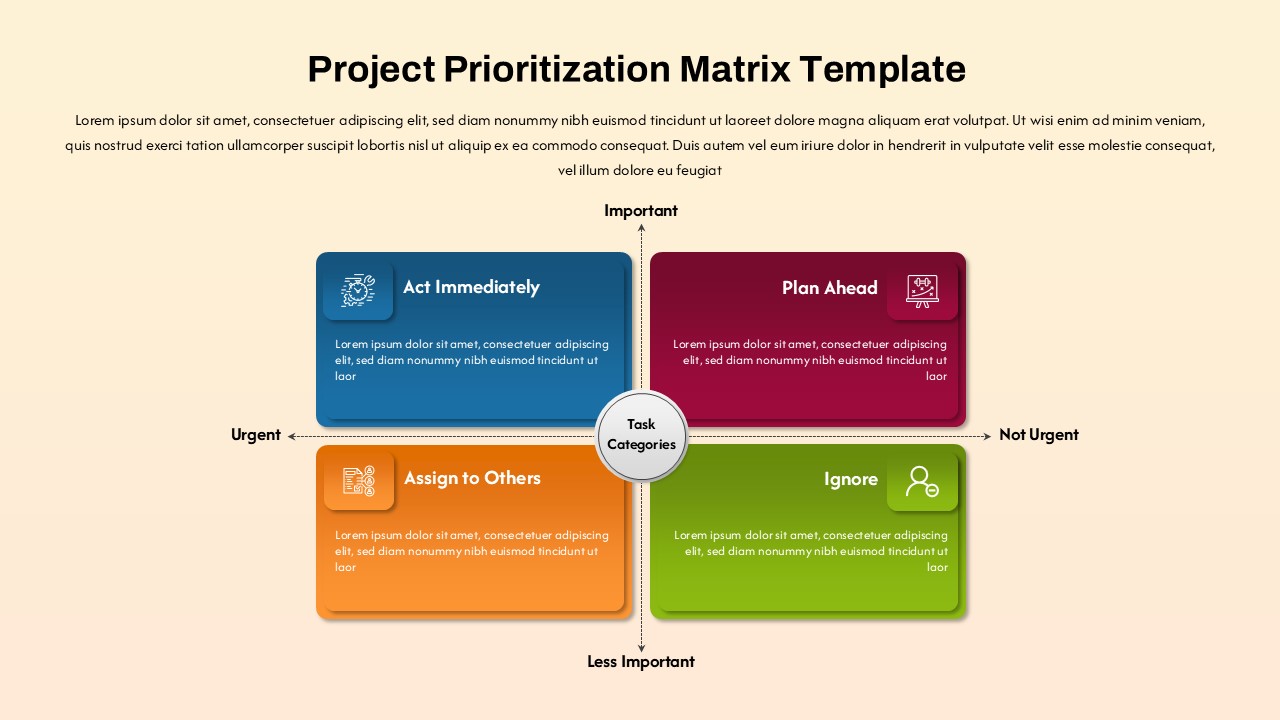
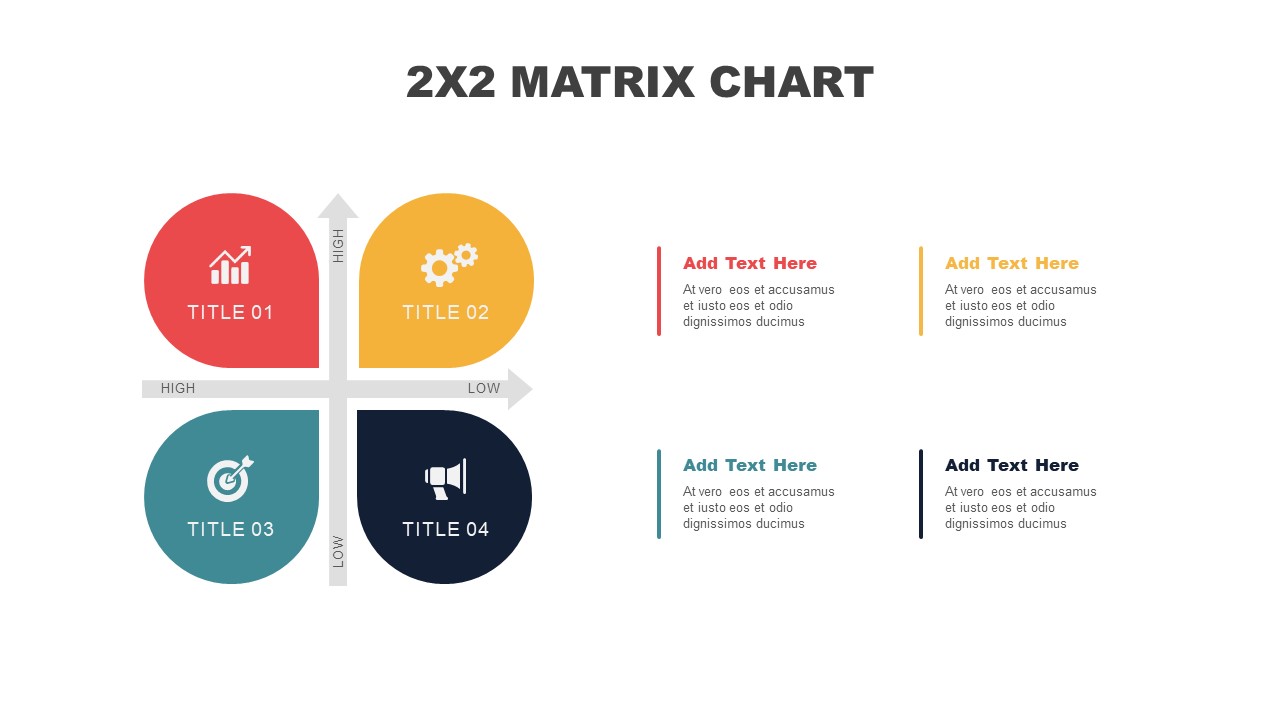
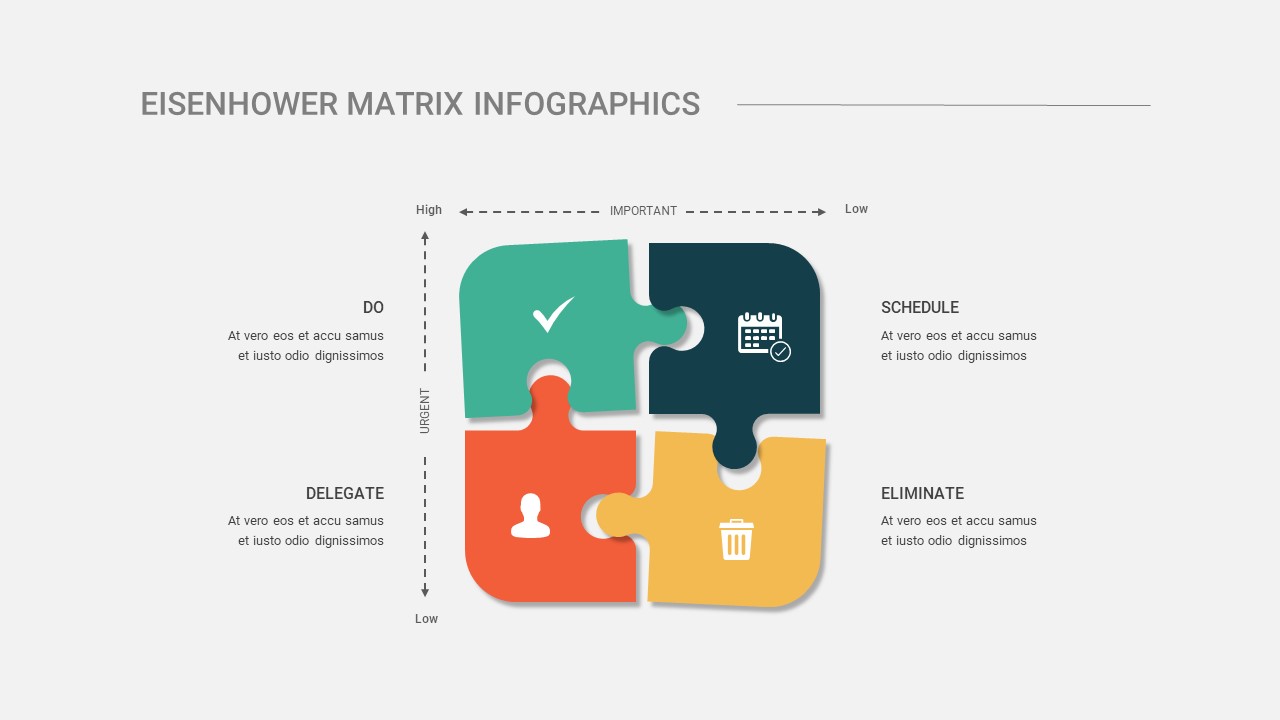
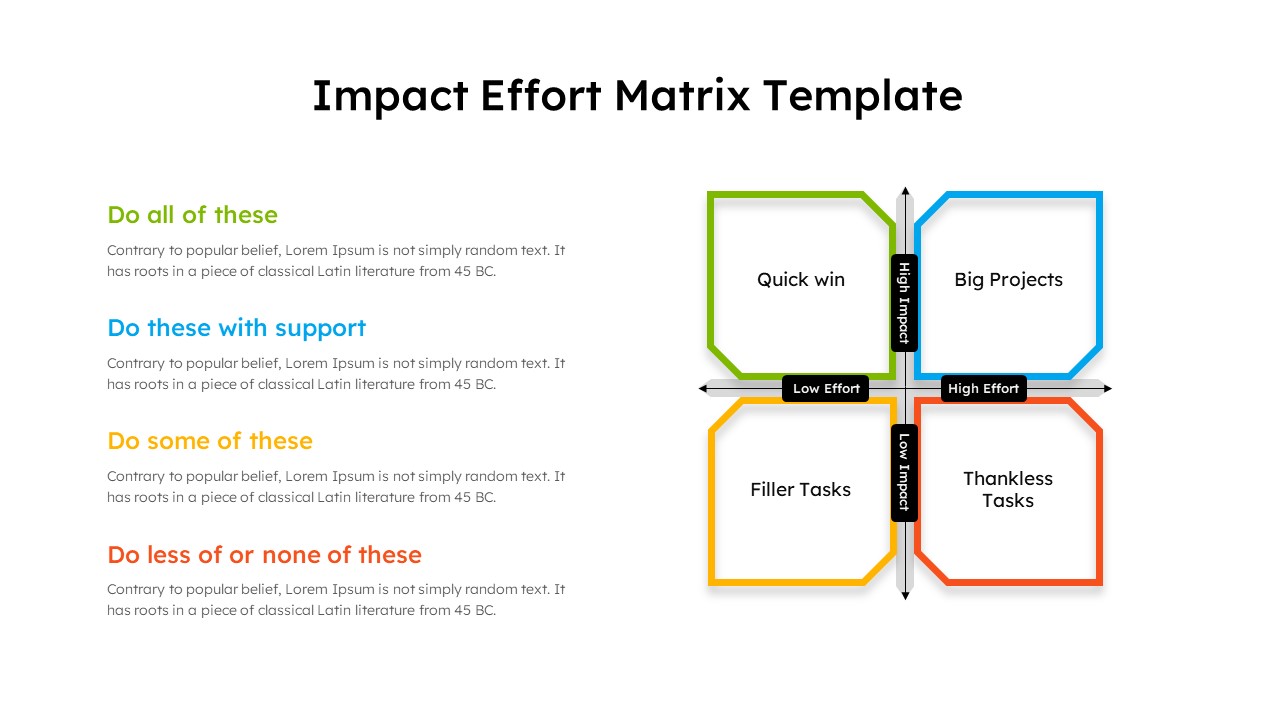
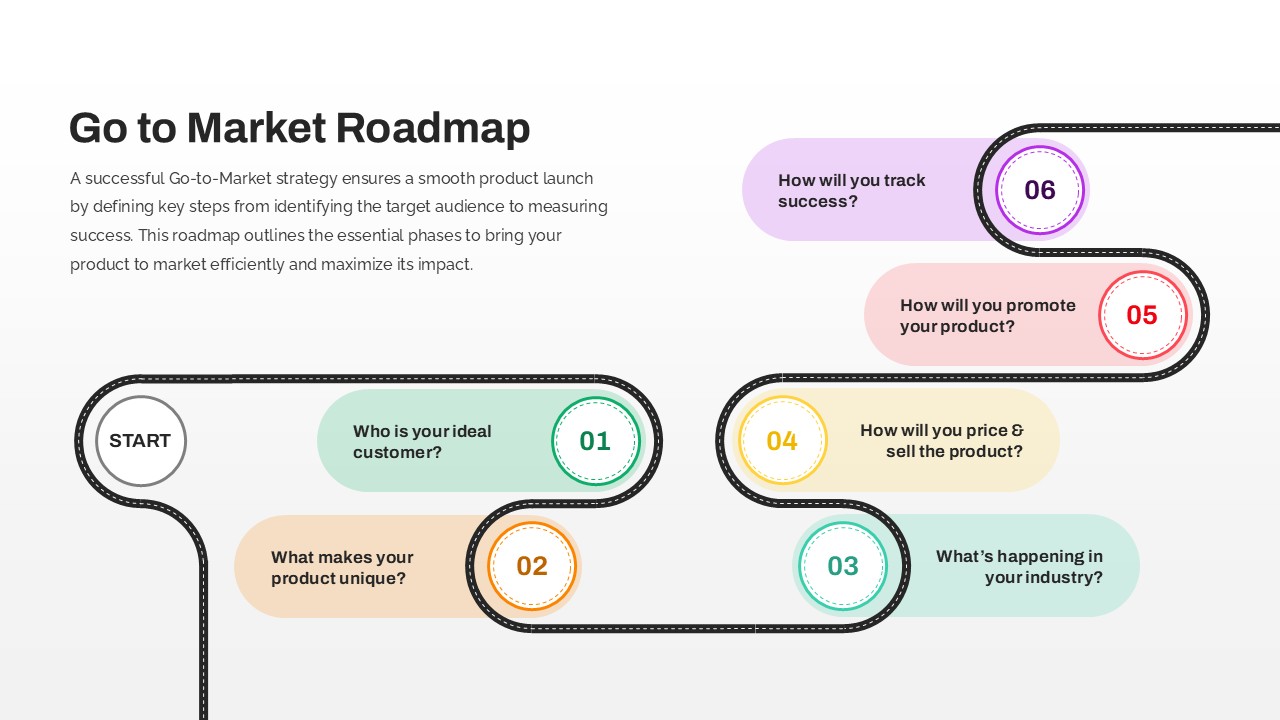
Make smarter business decisions with this Growth Share Matrix (BCG Matrix) Template, designed for PowerPoint and Google Slides. The BCG Matrix is a renowned strategic tool developed by the Boston Consulting Group (BCG) to help companies analyze their product portfolio based on market growth and relative market share. This template visualizes the matrix’s four key quadrants—Stars, Cash Cows, Question Marks, and Dogs—allowing teams to identify where to invest, maintain, or divest.
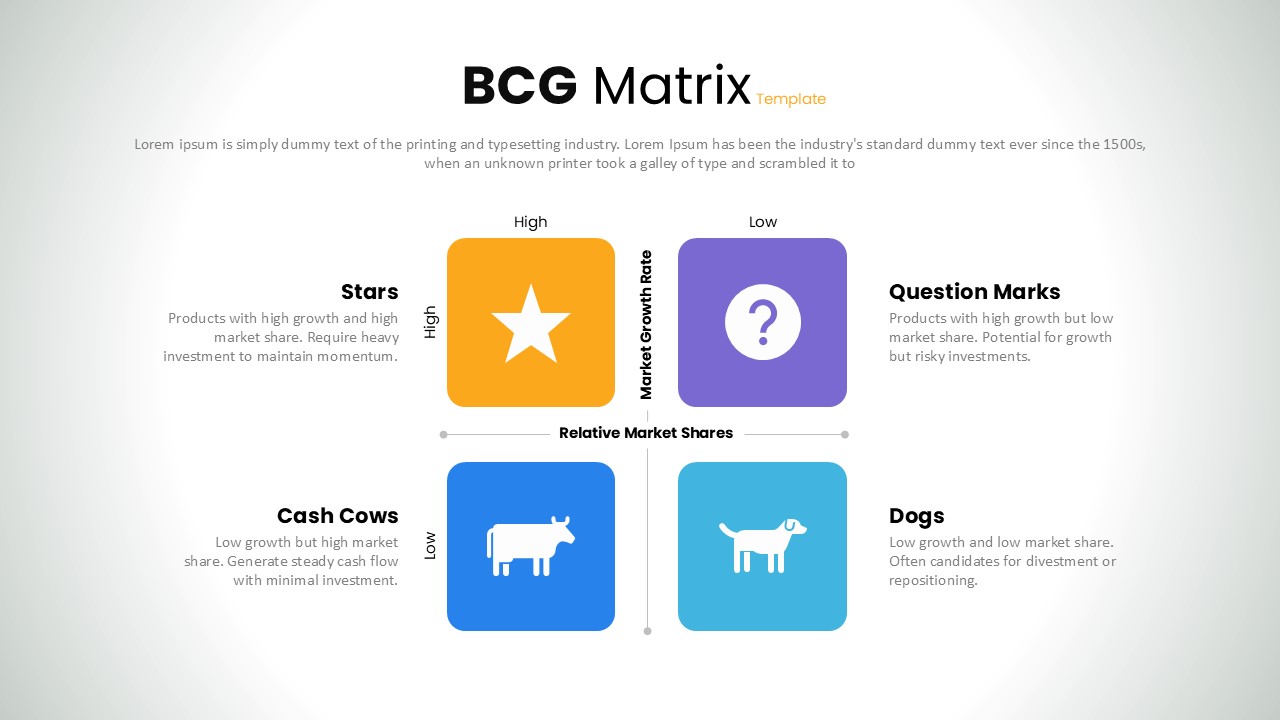
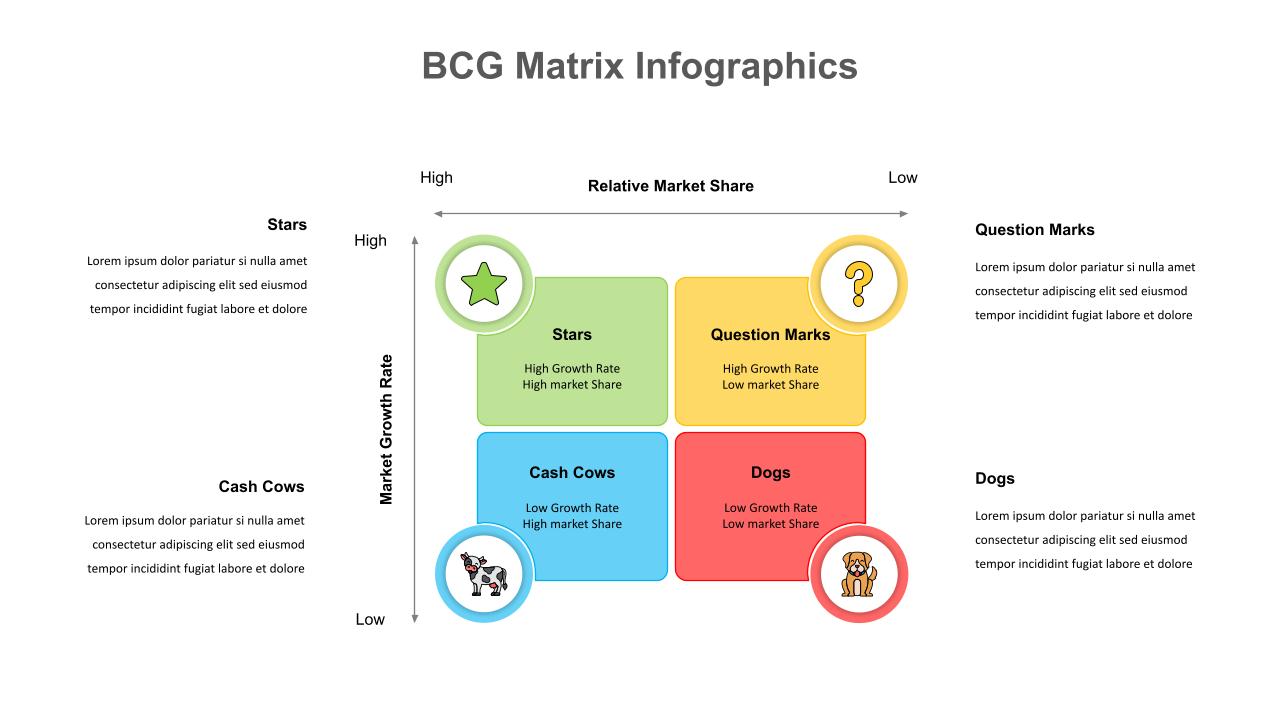
Ideal for product managers, strategists, and business analysts, the template provides a clear, concise layout that summarizes the characteristics of each quadrant. It highlights high-growth market leaders (Stars), established profit generators (Cash Cows), potential growth opportunities (Question Marks), and underperforming units (Dogs). This insight assists in resource allocation, product development prioritization, and long-term strategic planning.
Key Features:
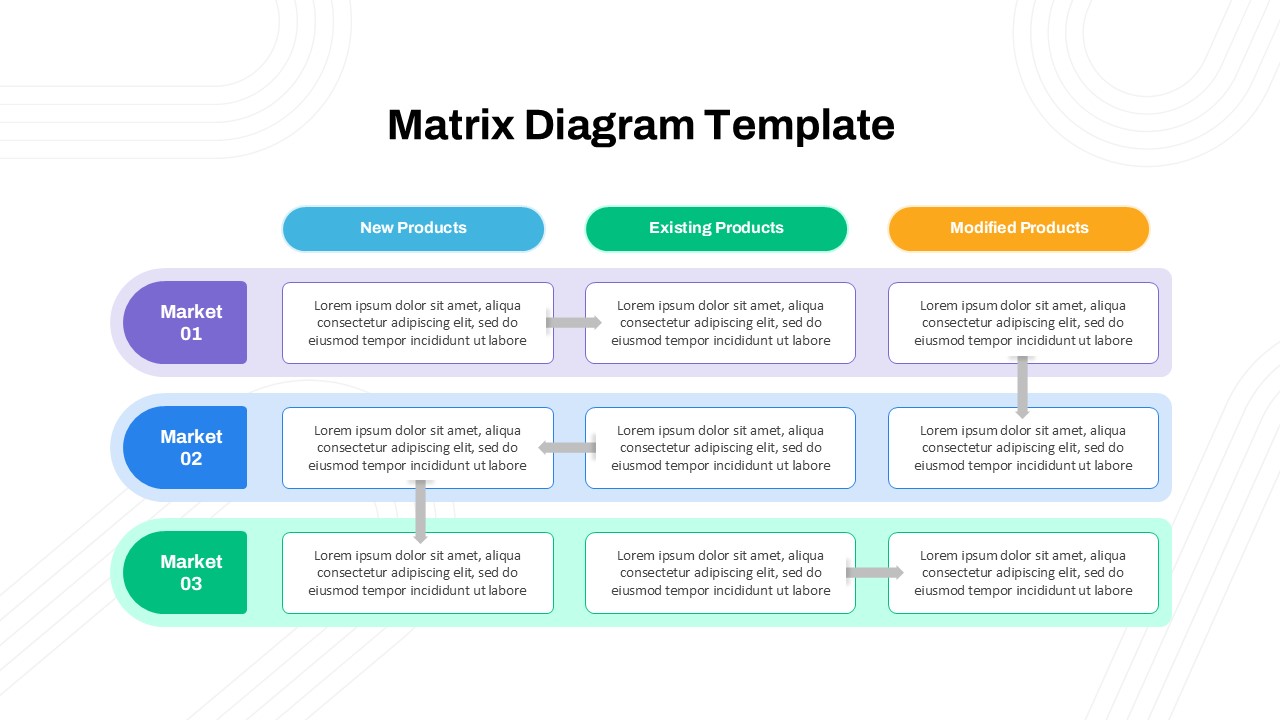
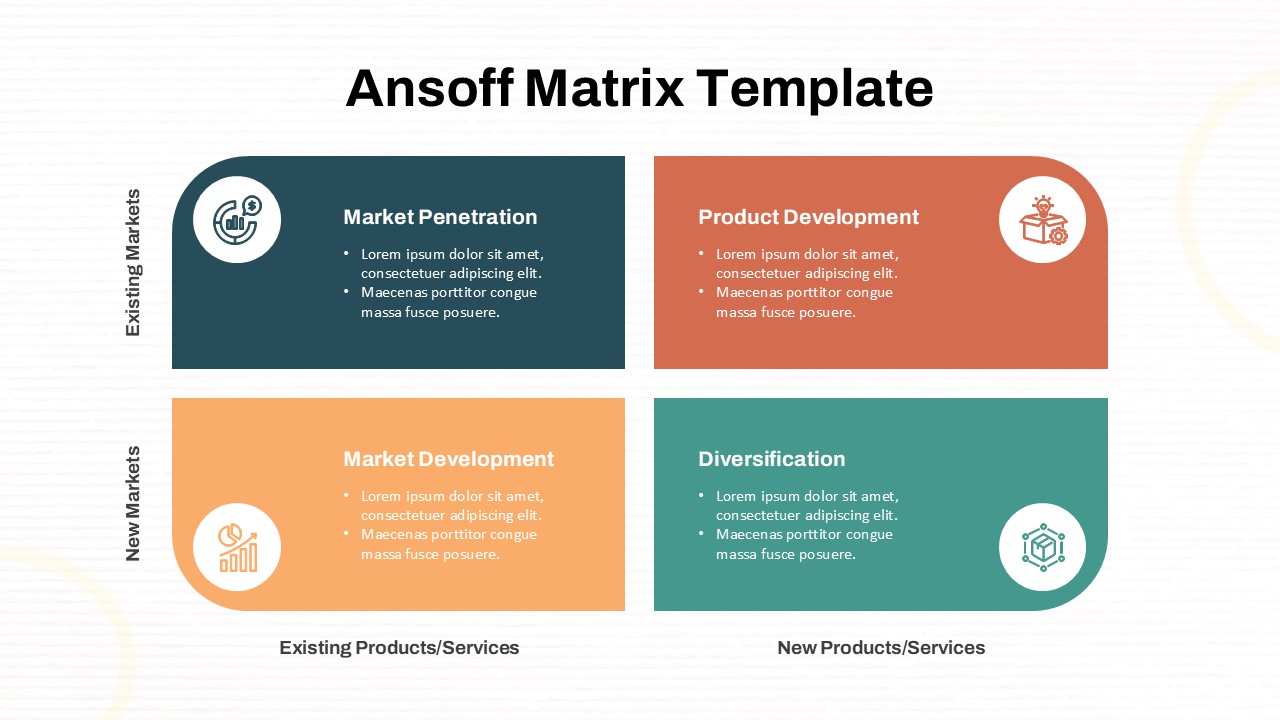
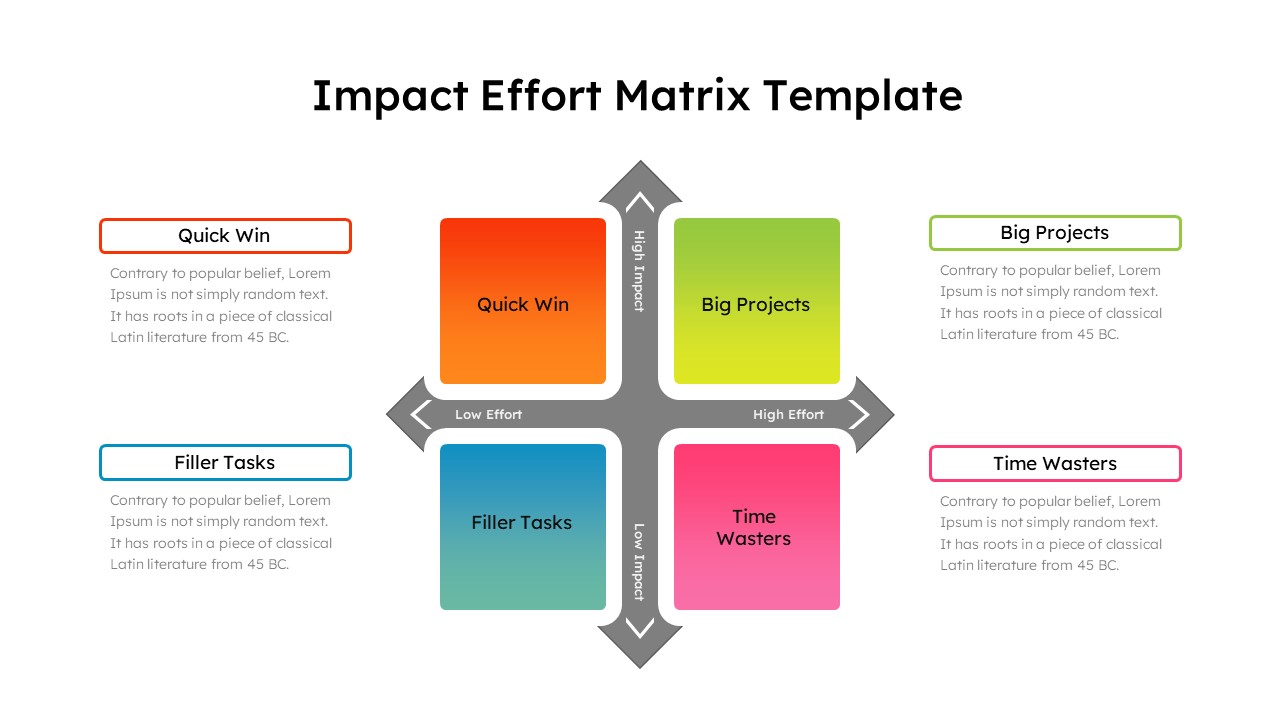
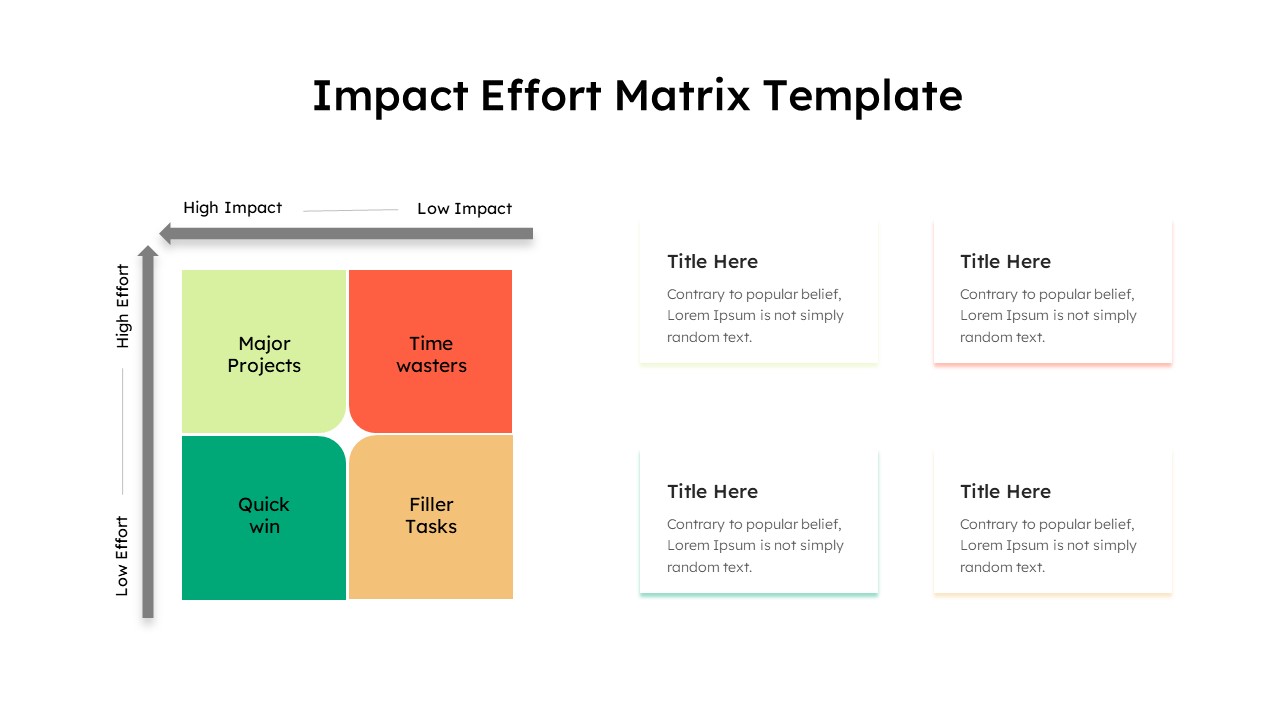
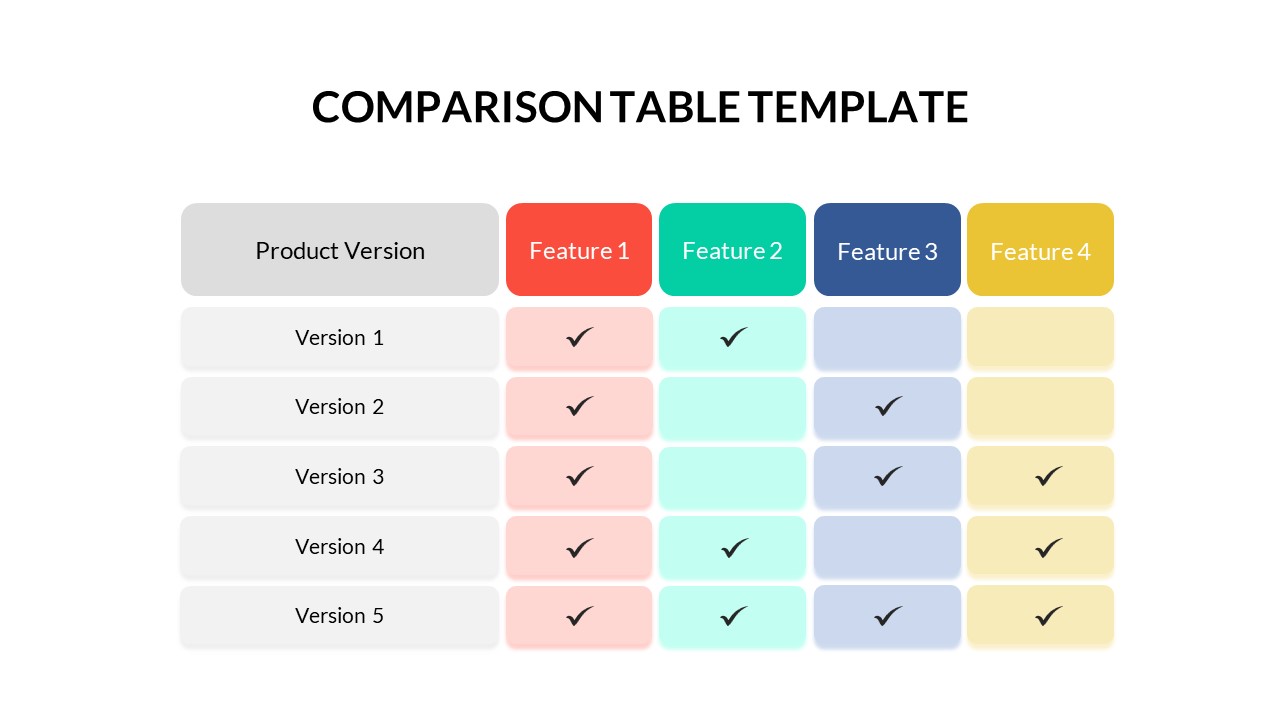
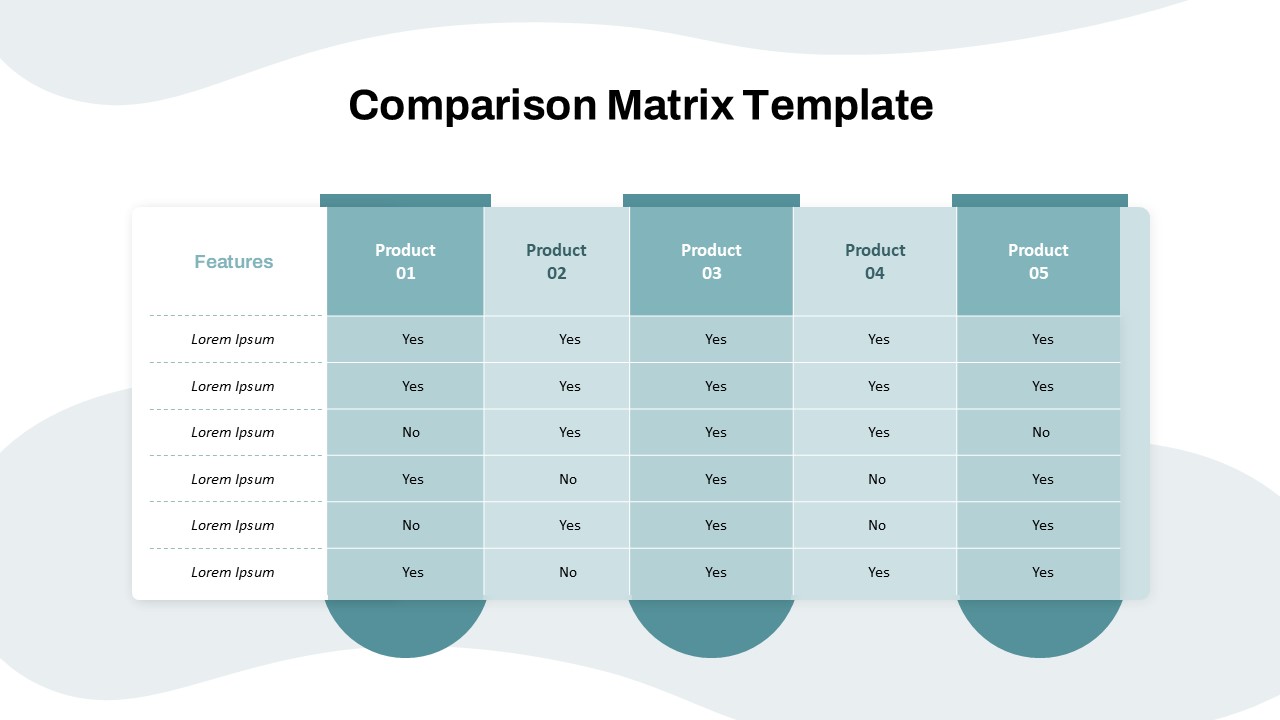
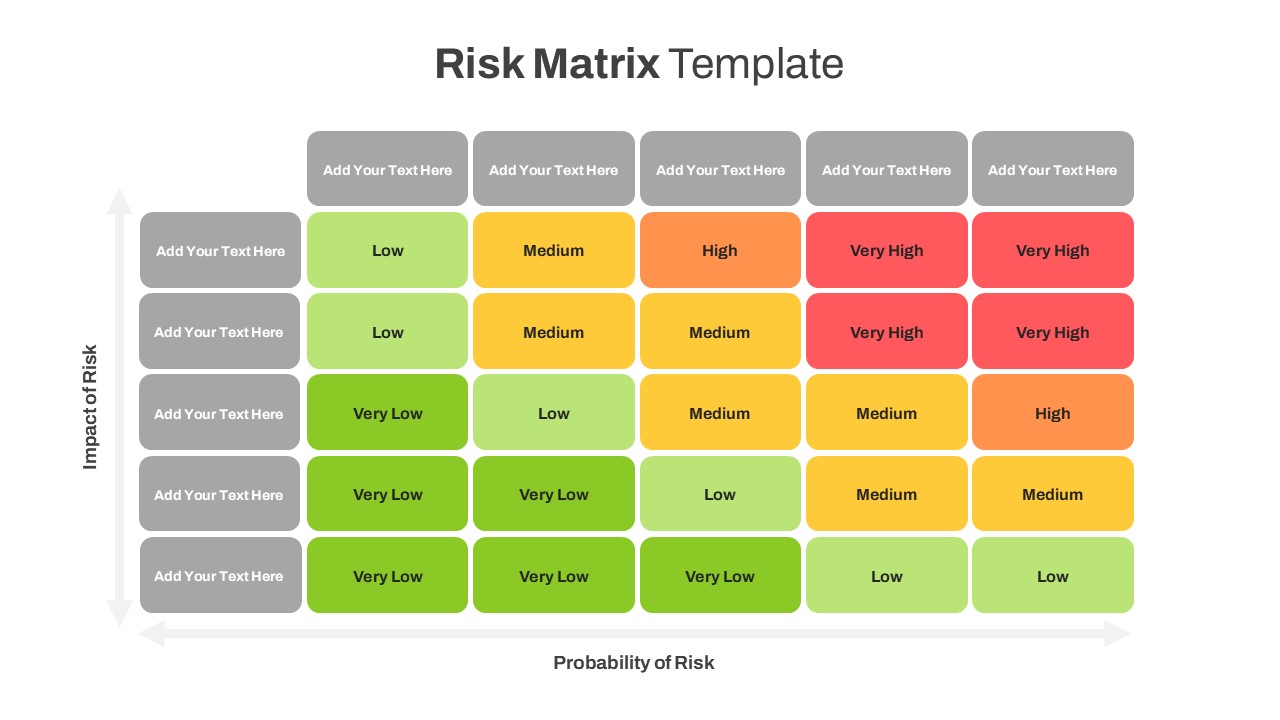
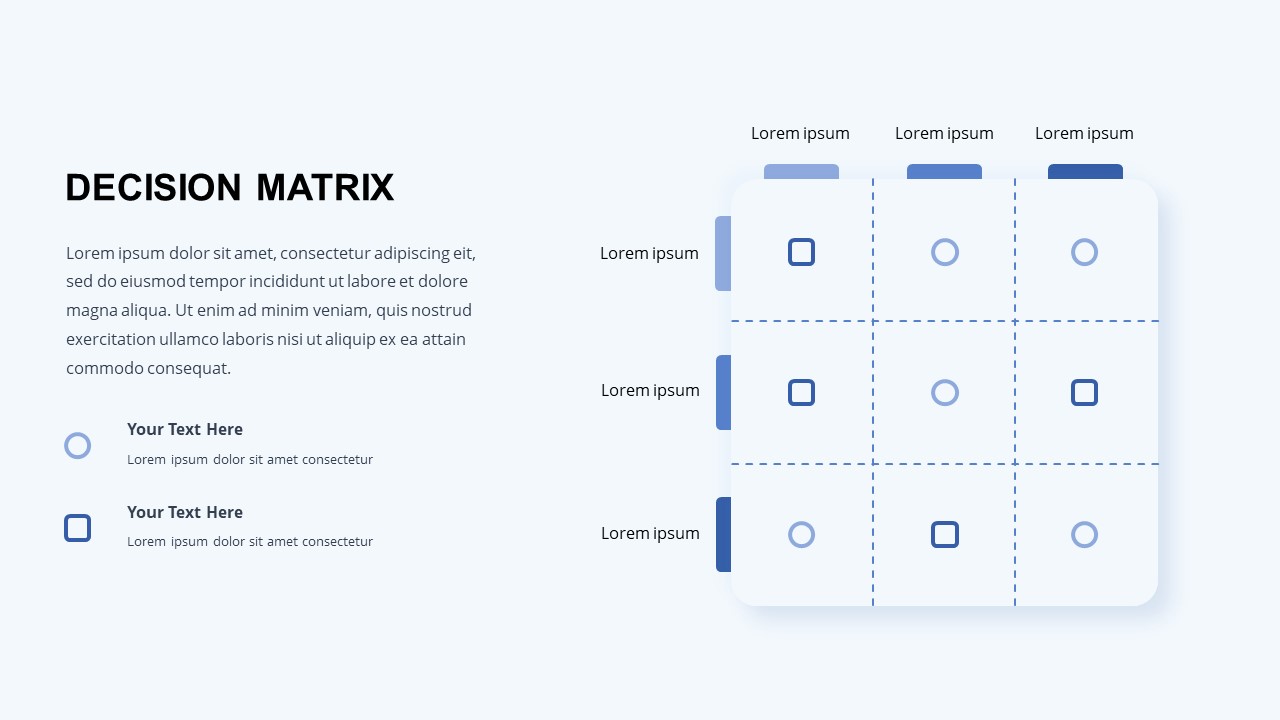
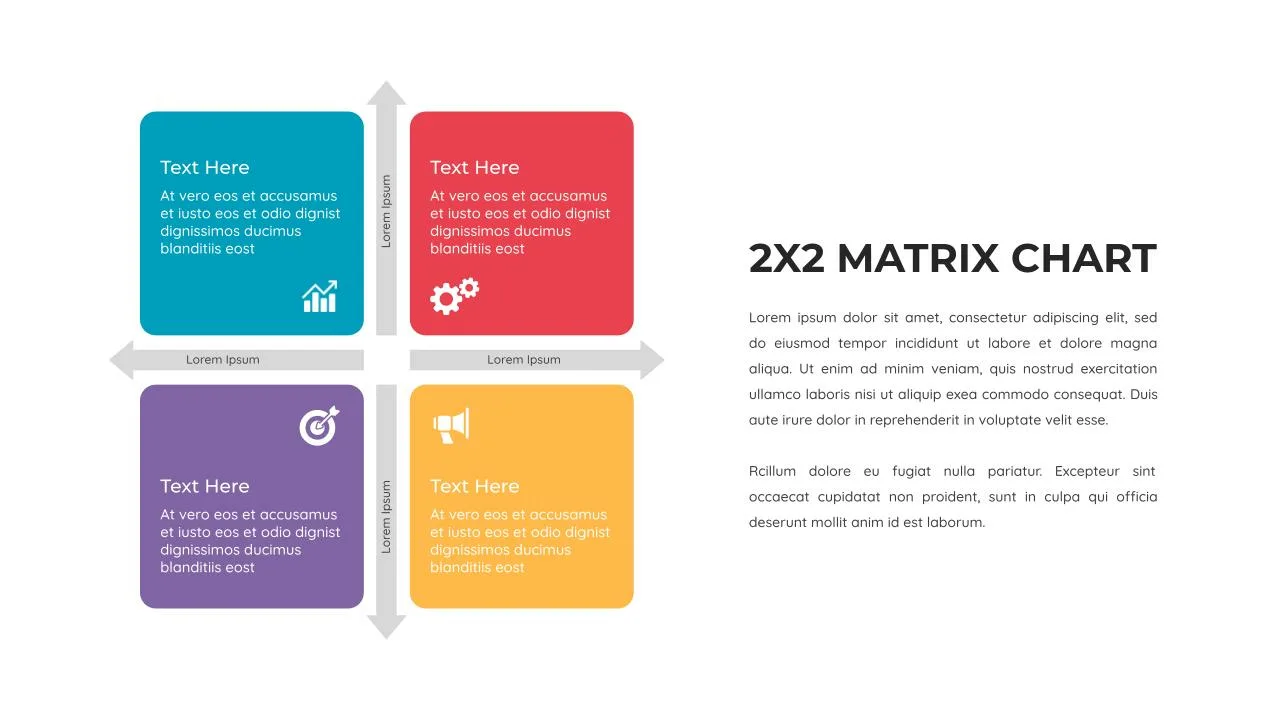
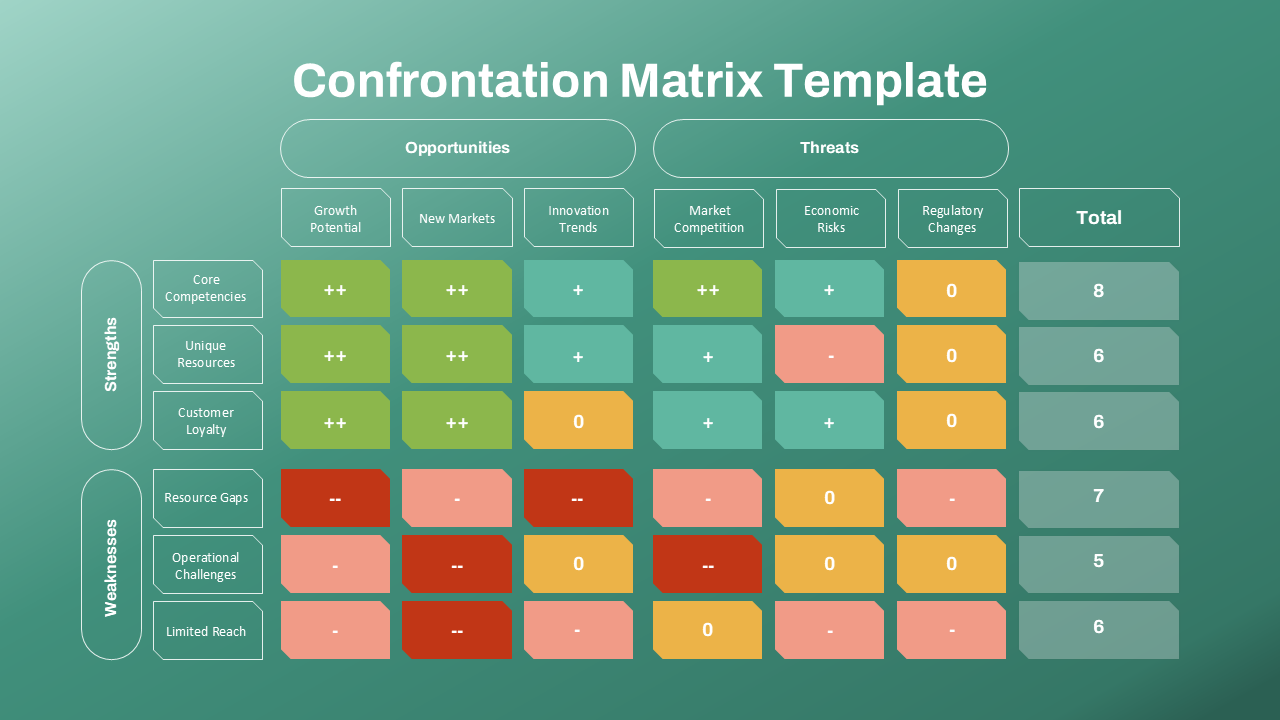
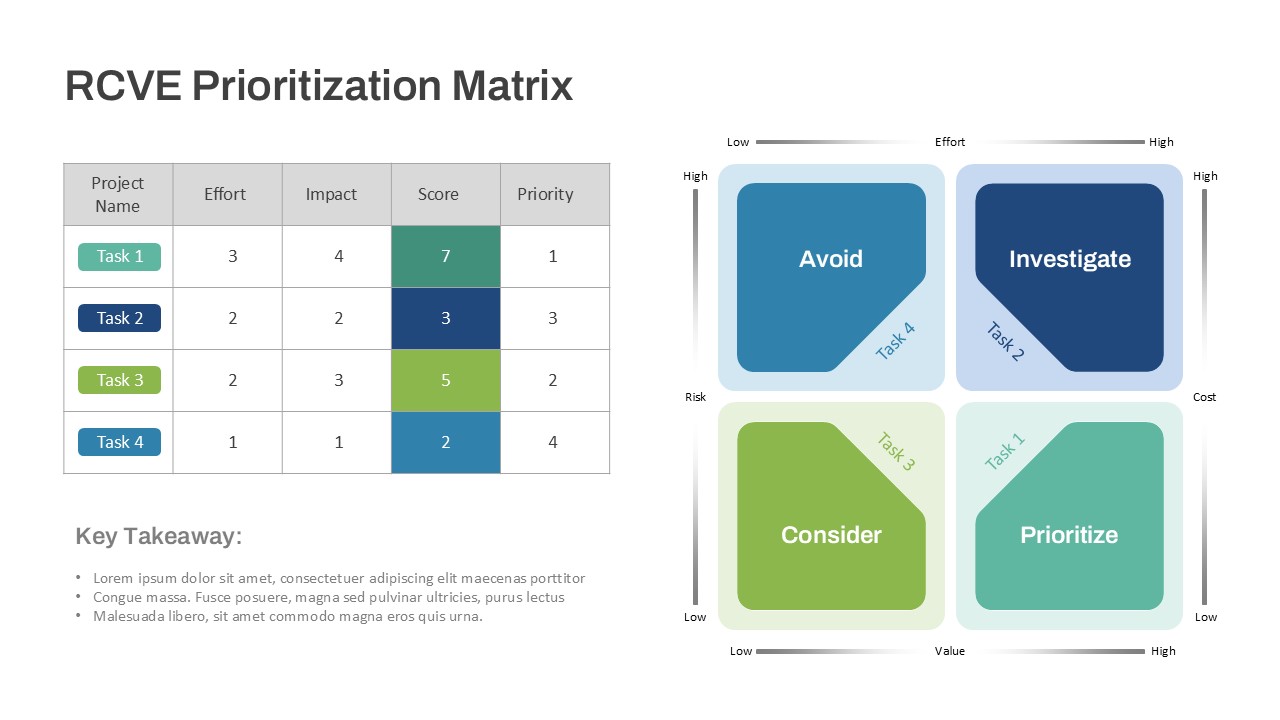
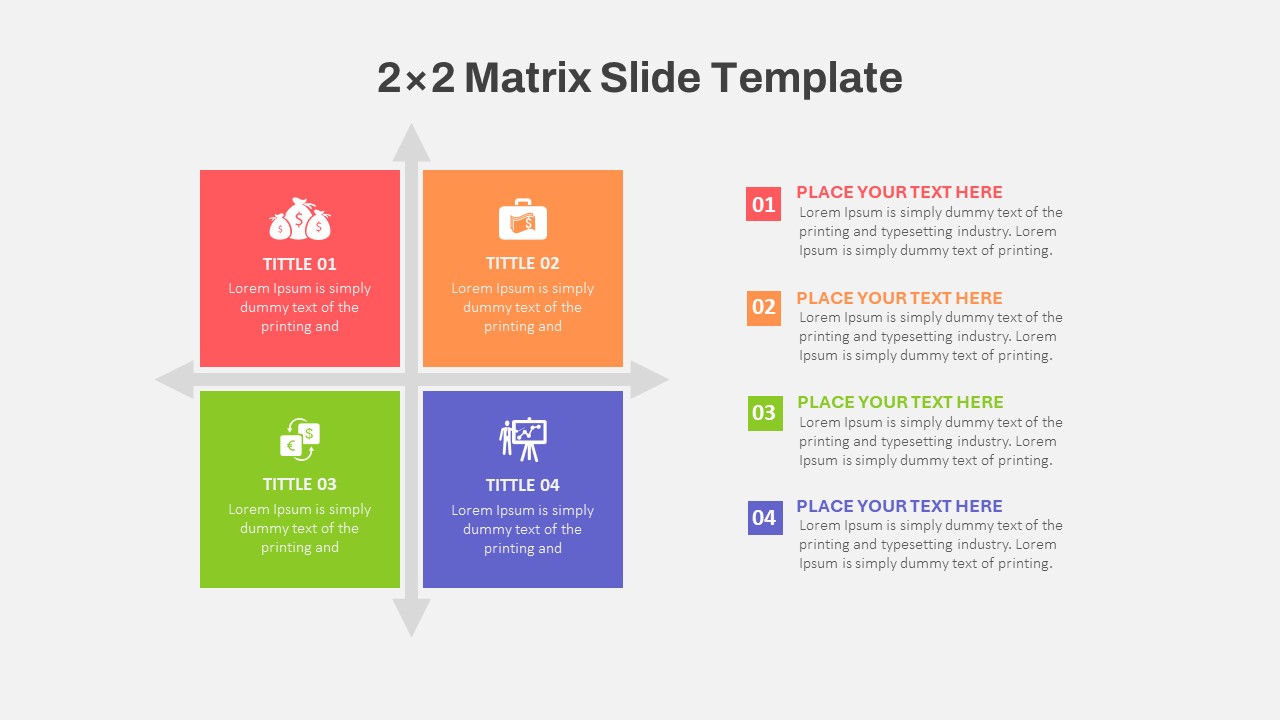
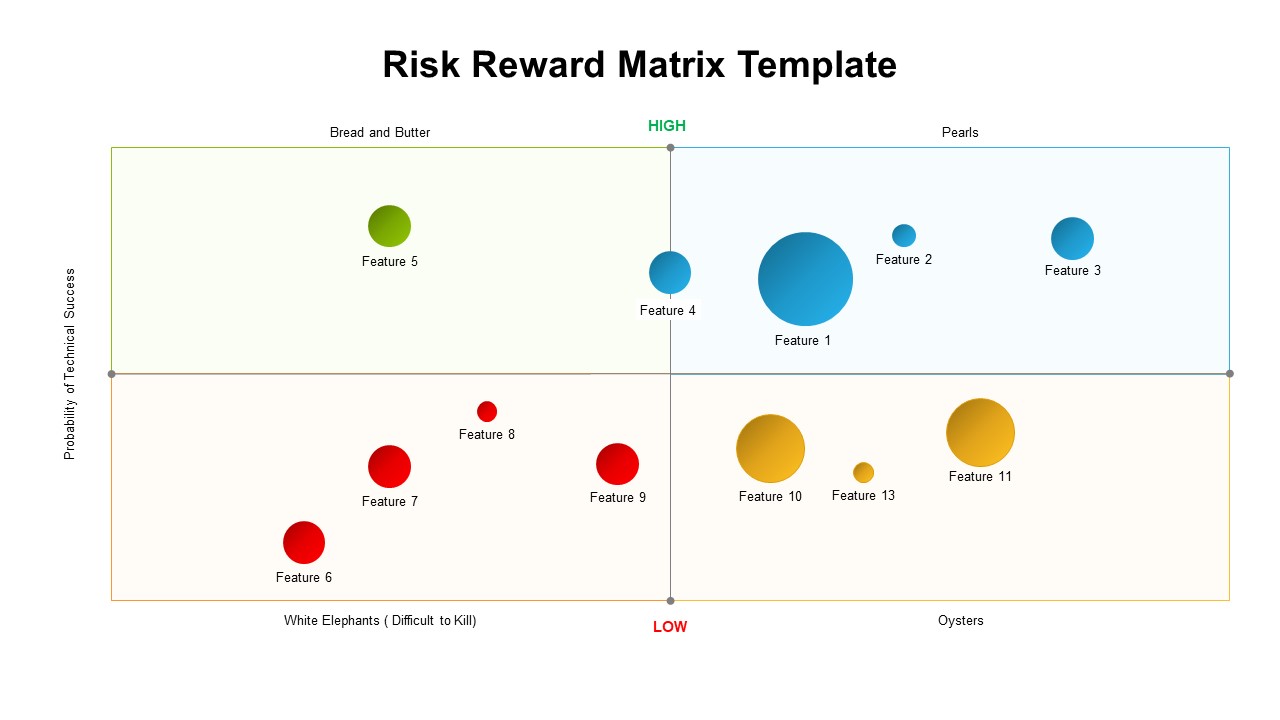
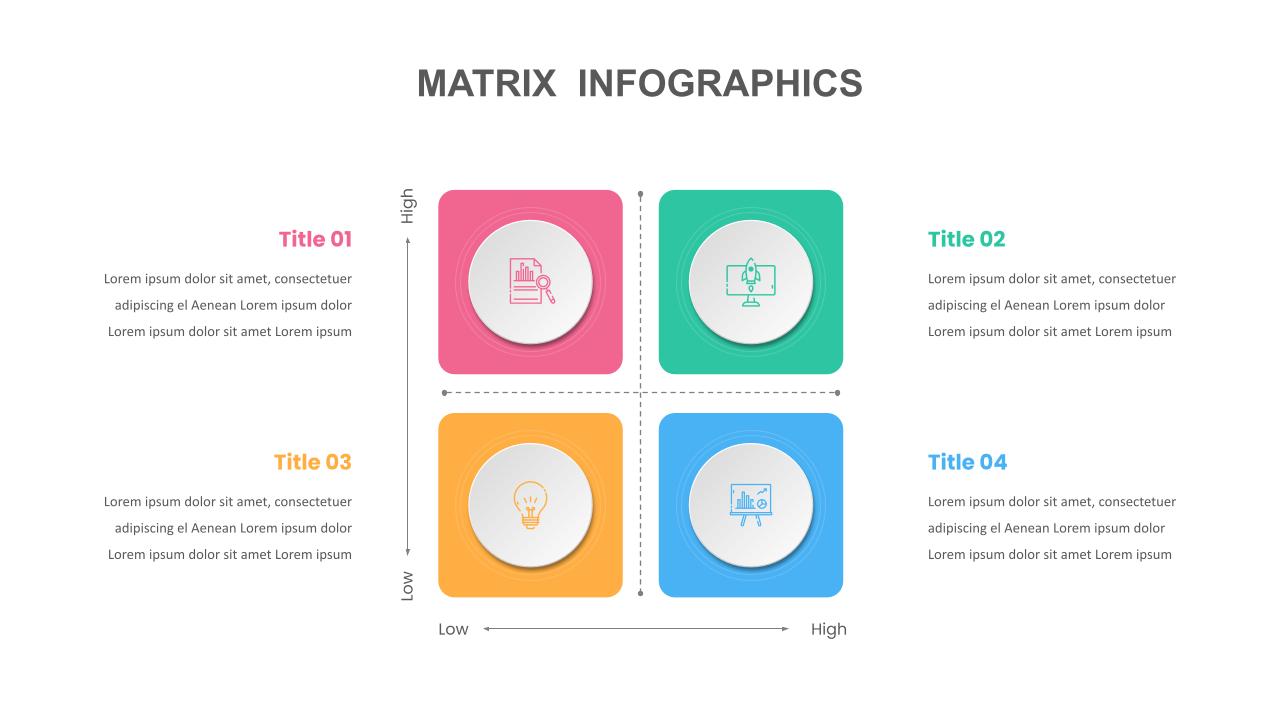
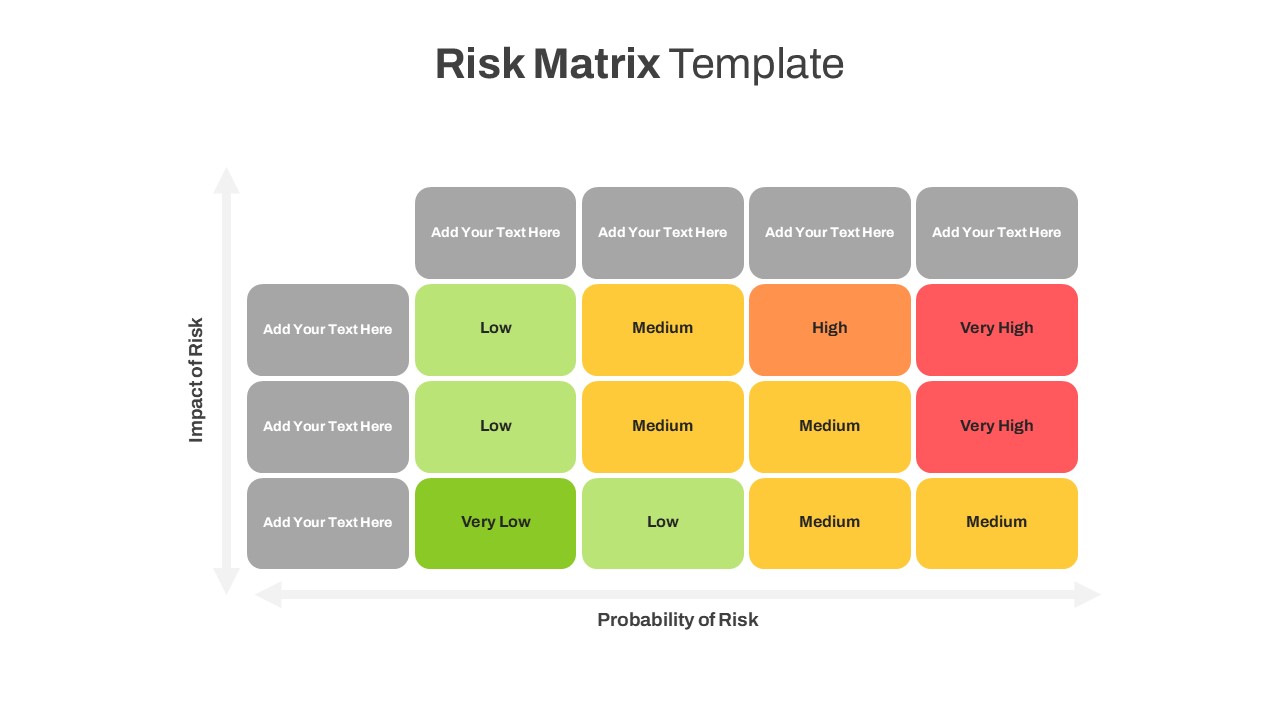
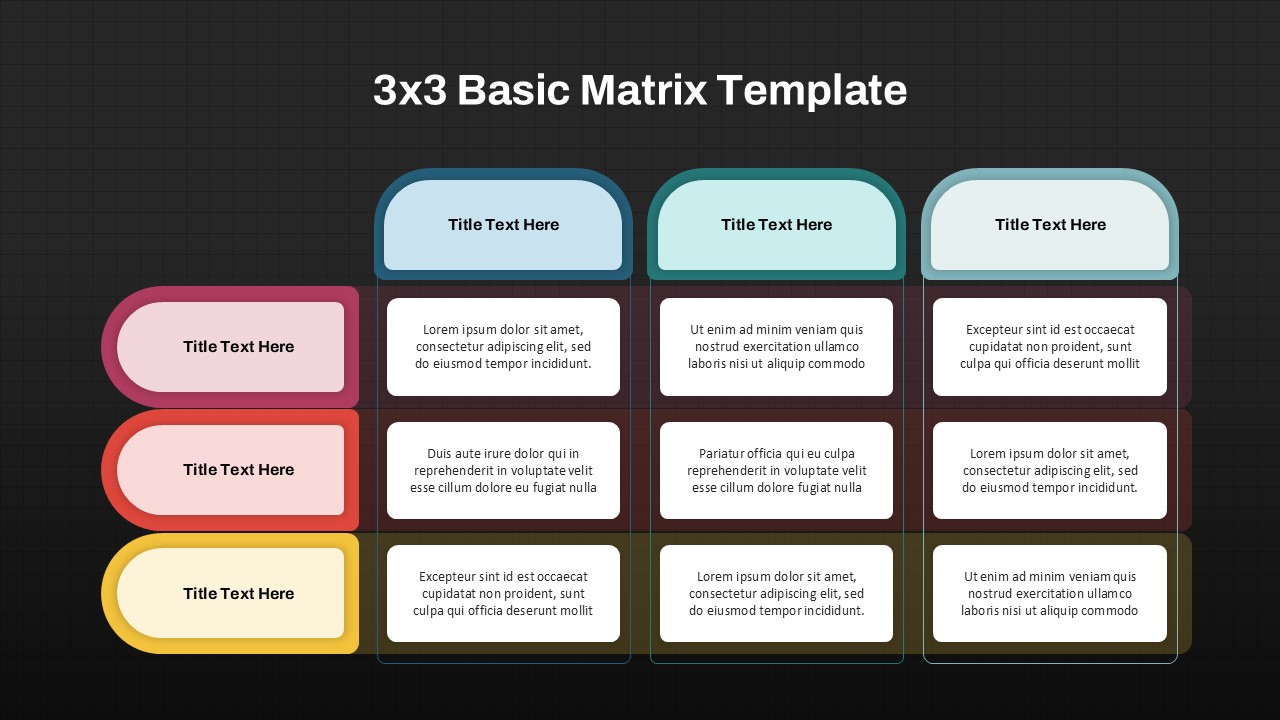
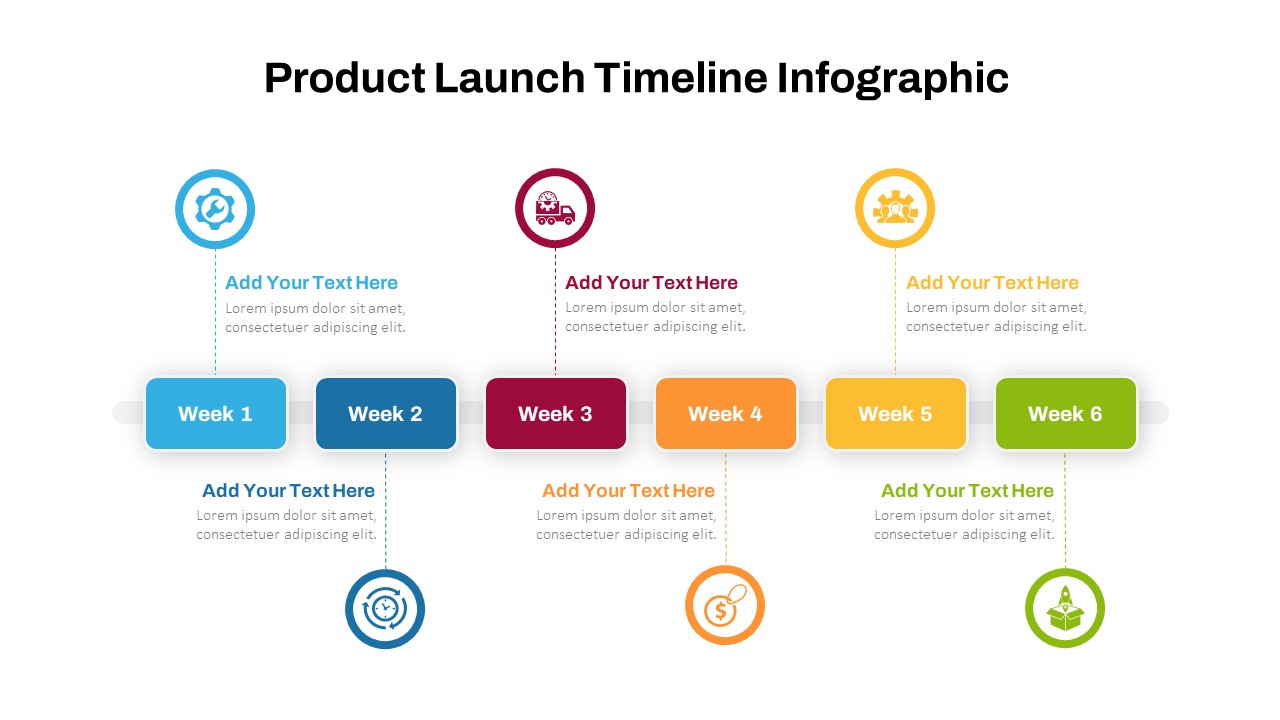
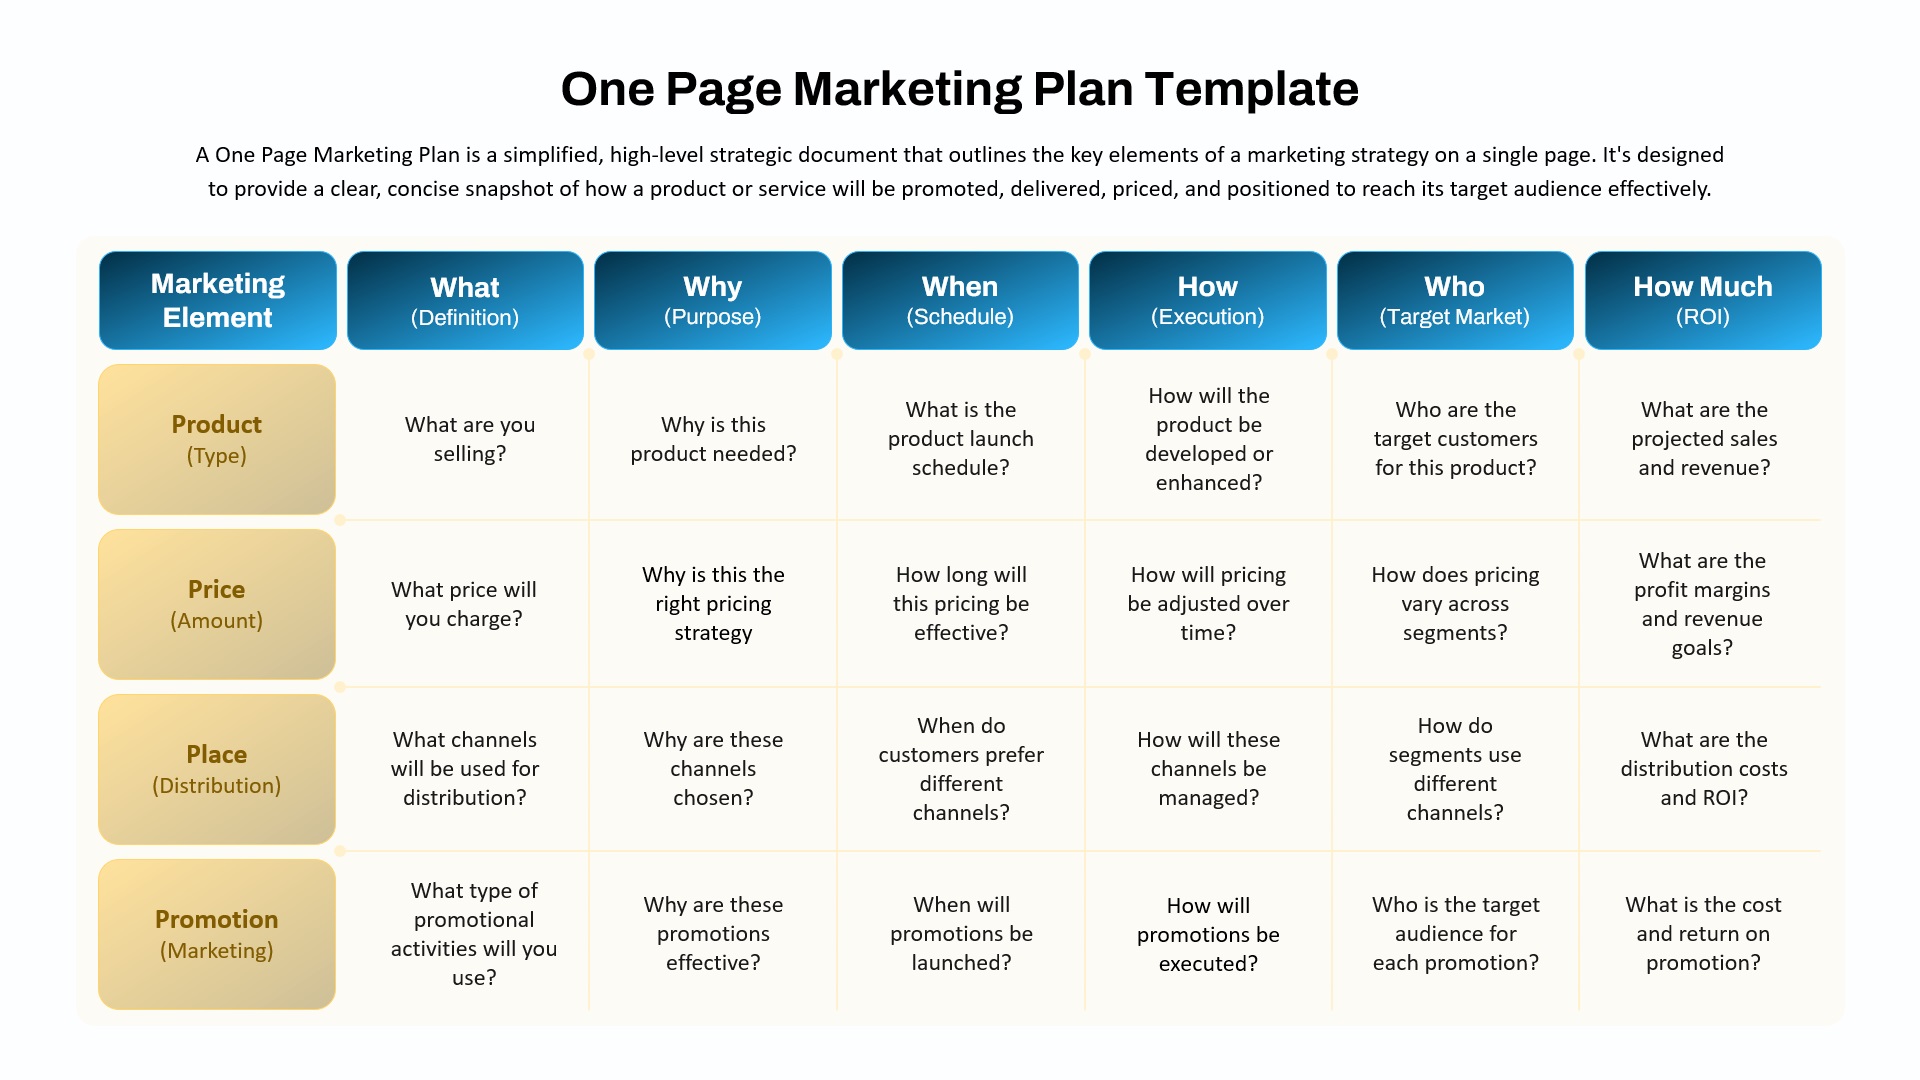
- Clear 2×2 Matrix Layout: Easy visualization of growth and market share dynamics
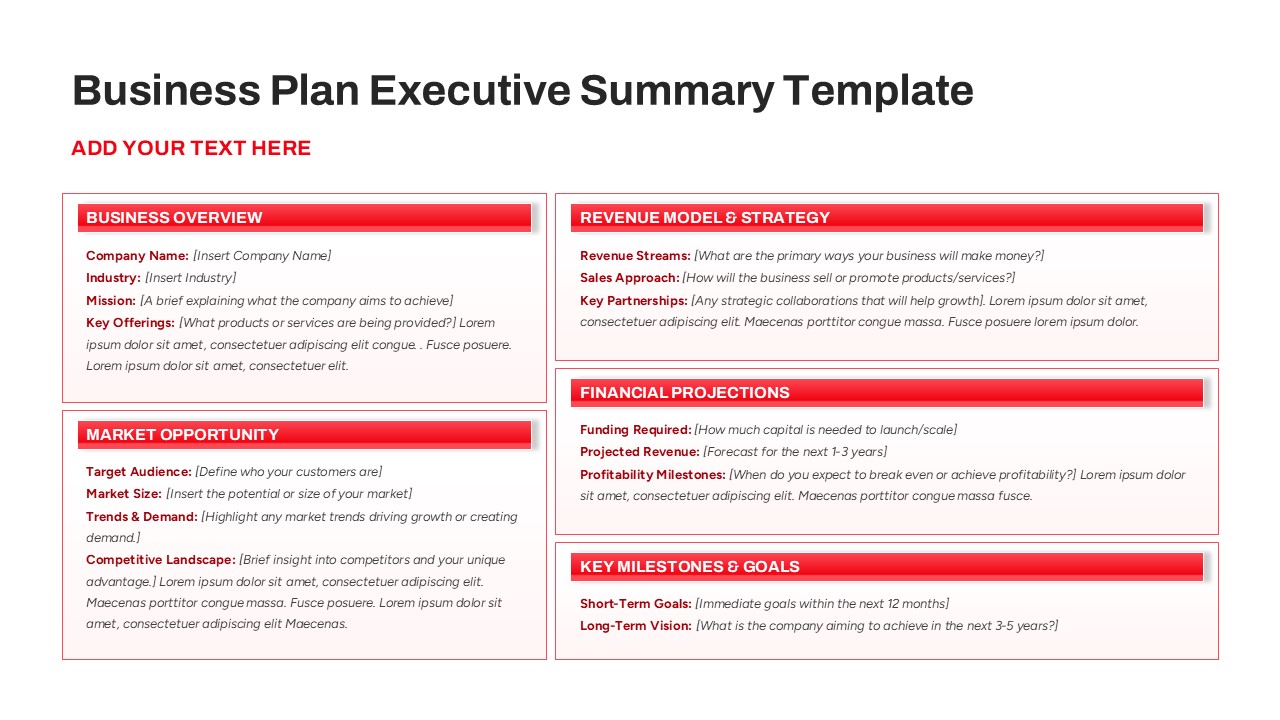
- Detailed Quadrant Descriptions: Helps explain investment rationale and portfolio management
- Customizable Design: Adapt colors, icons, and content to suit your corporate style and data
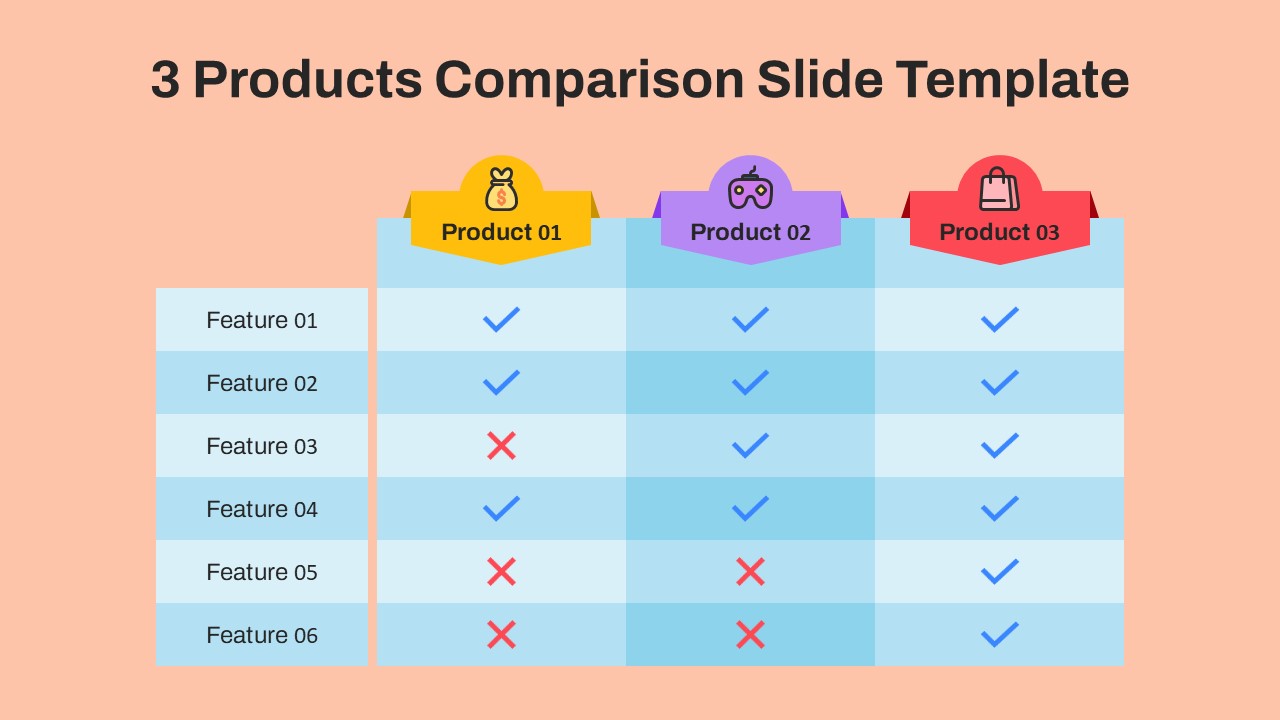
- Versatile Application: Useful in strategy sessions, executive briefings, and portfolio reviews
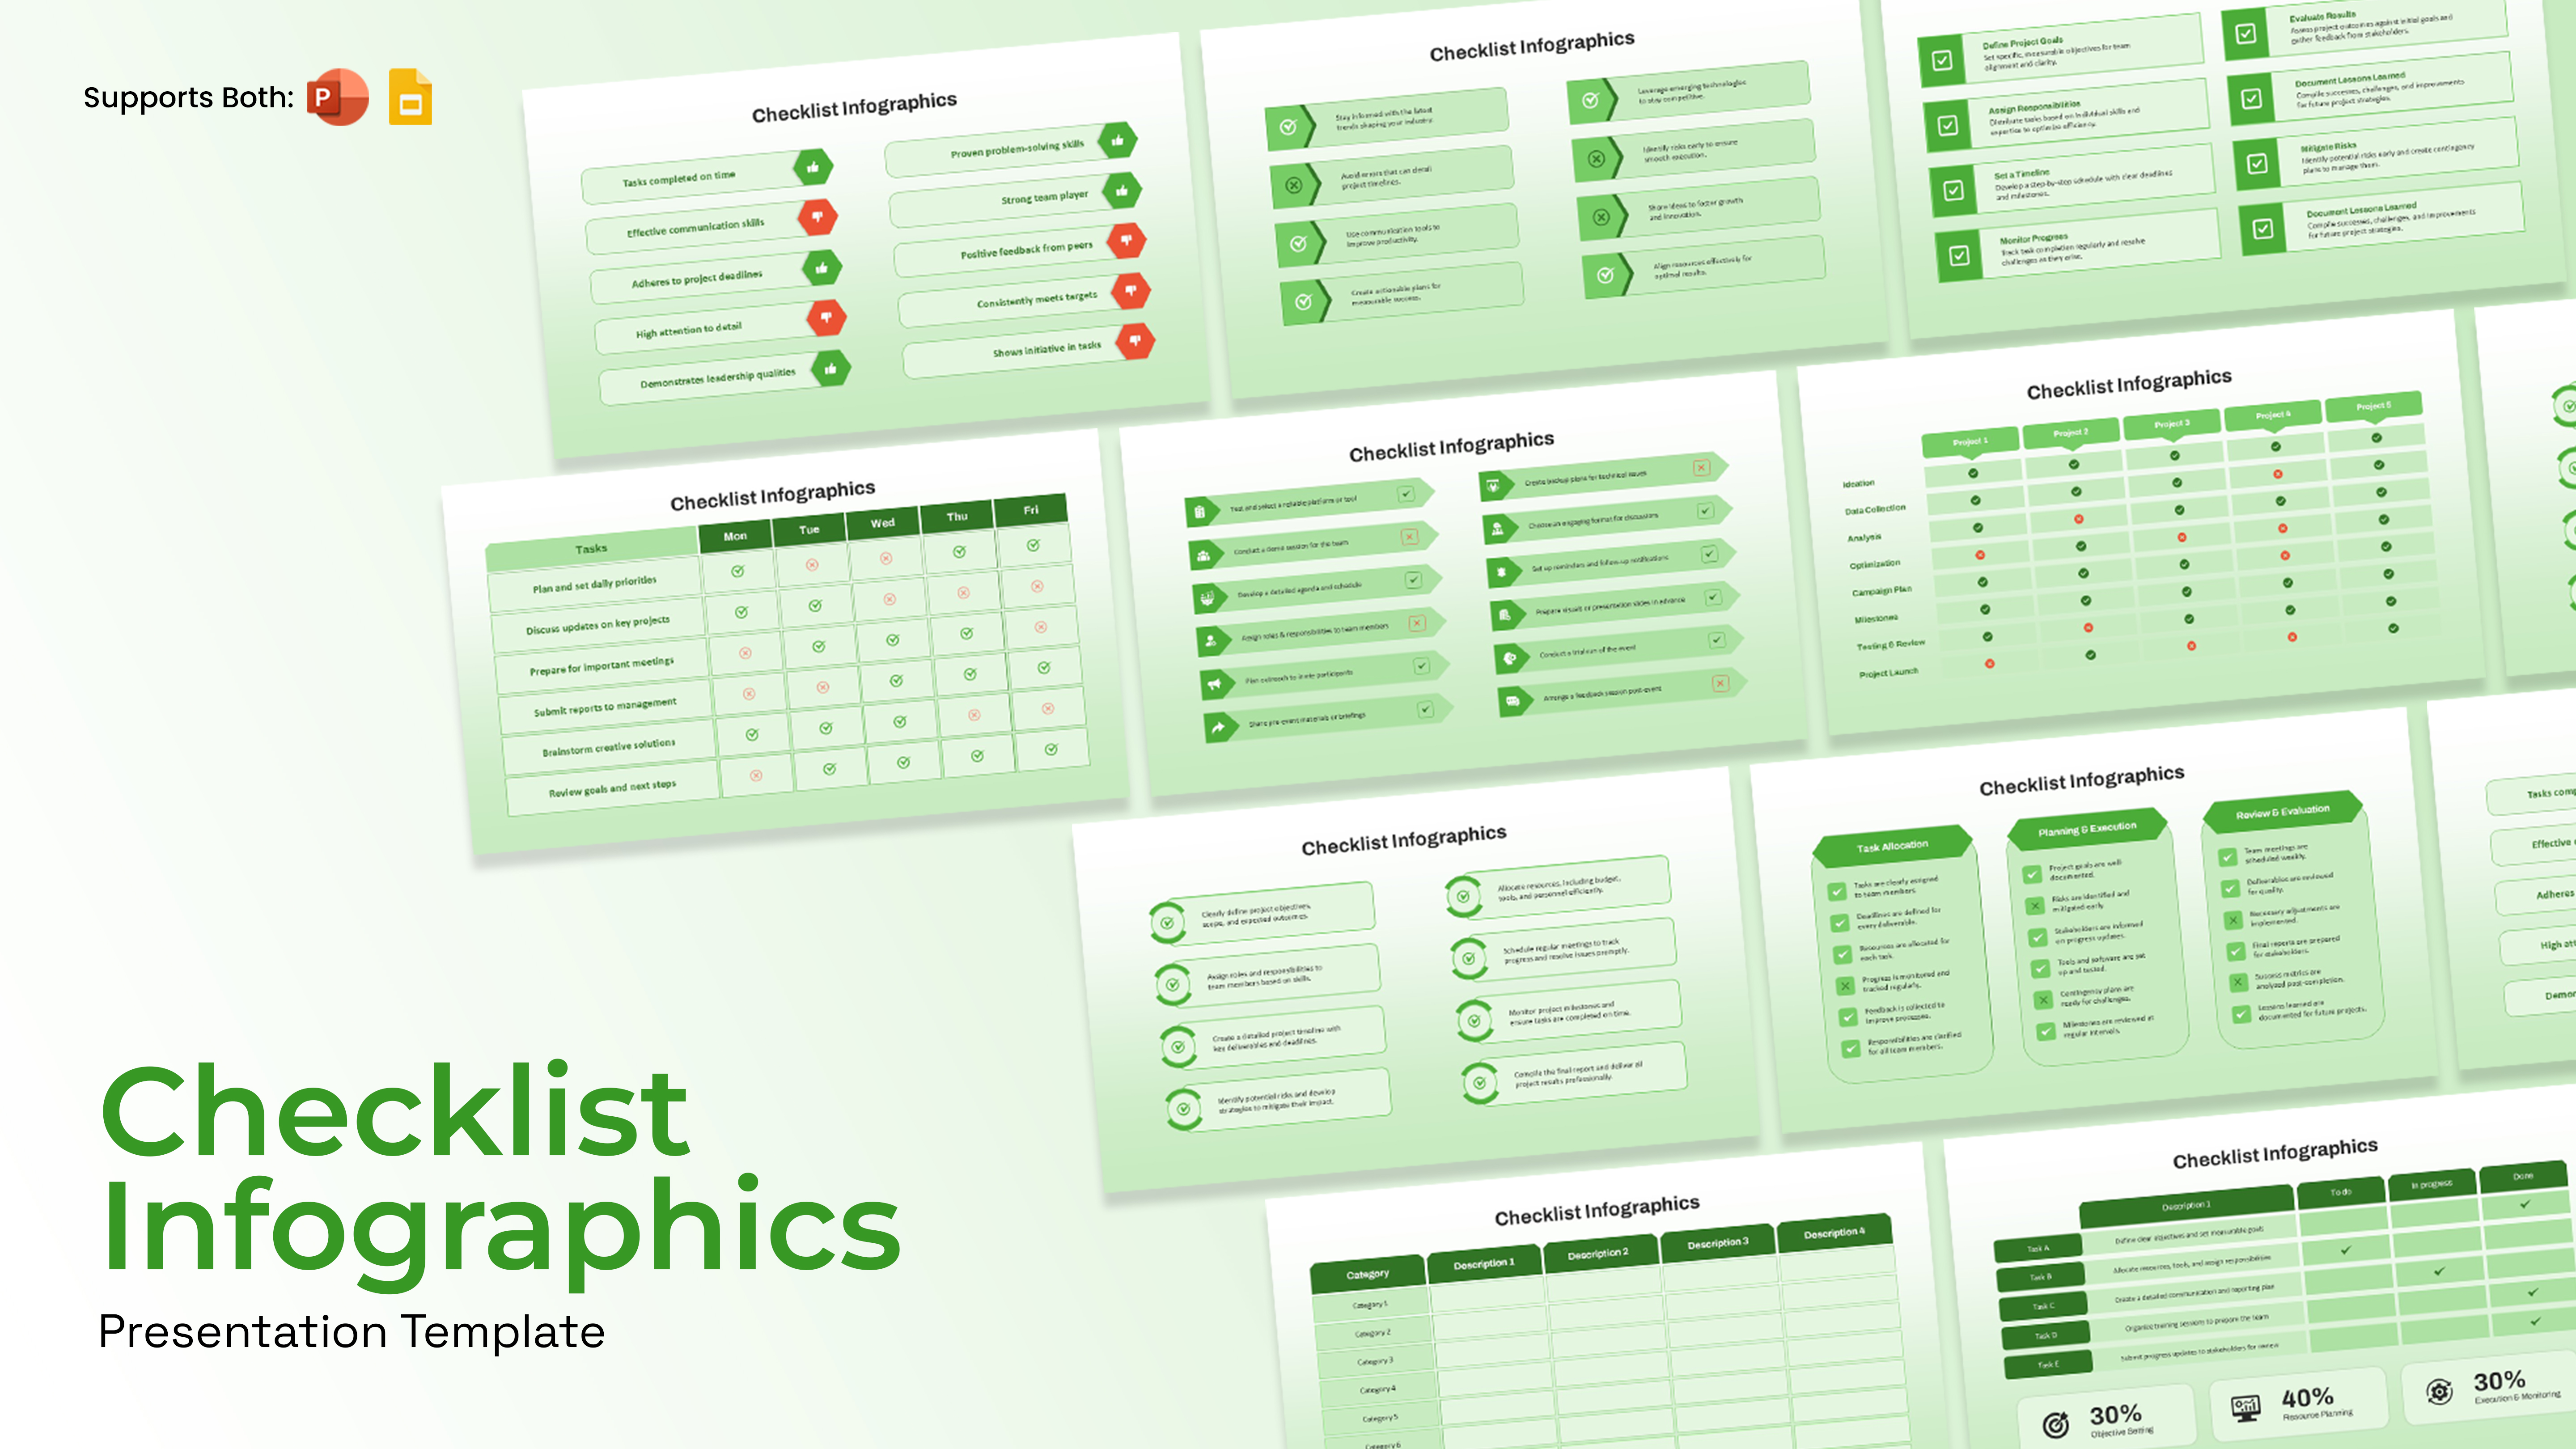
- User-Friendly: Compatible with both PowerPoint and Google Slides for effortless editing
Use this template to communicate your product or business unit strategy clearly, prioritize investments effectively, and optimize your portfolio for sustained success.
See more

Aspect Ratio
16:9Item ID
SKT03618
Features of this template
Other User Cases of the Template:
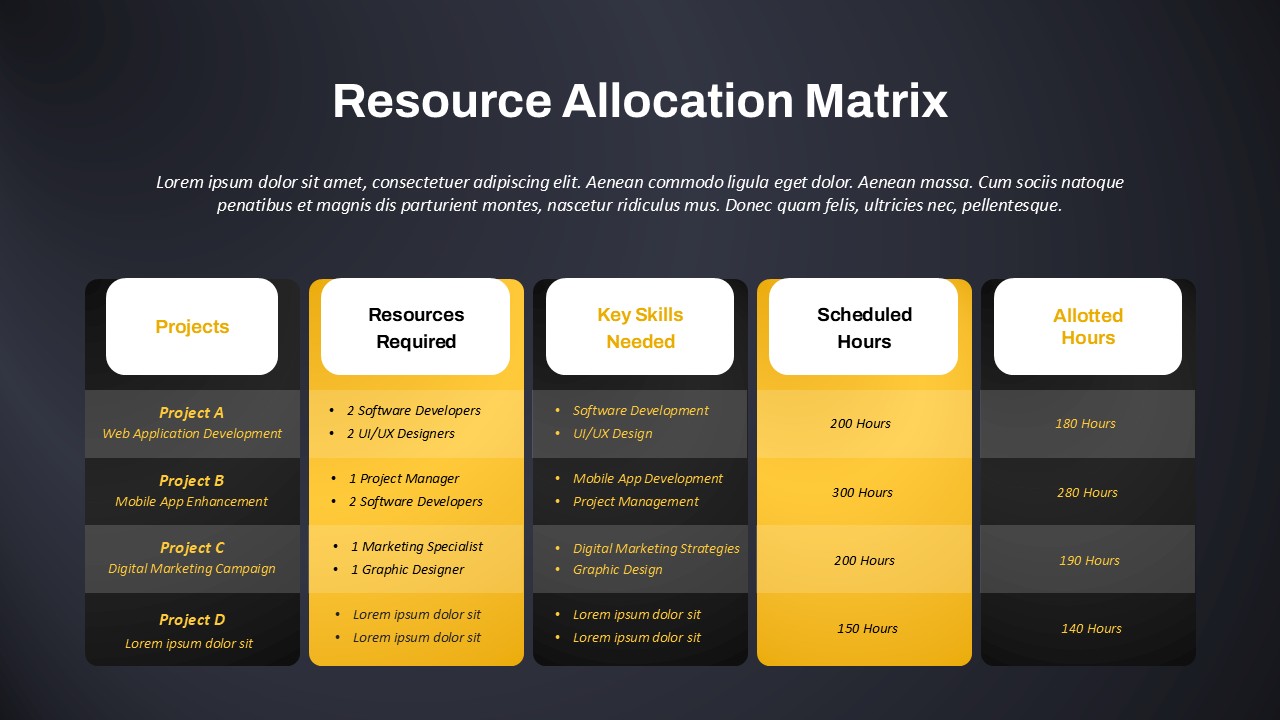
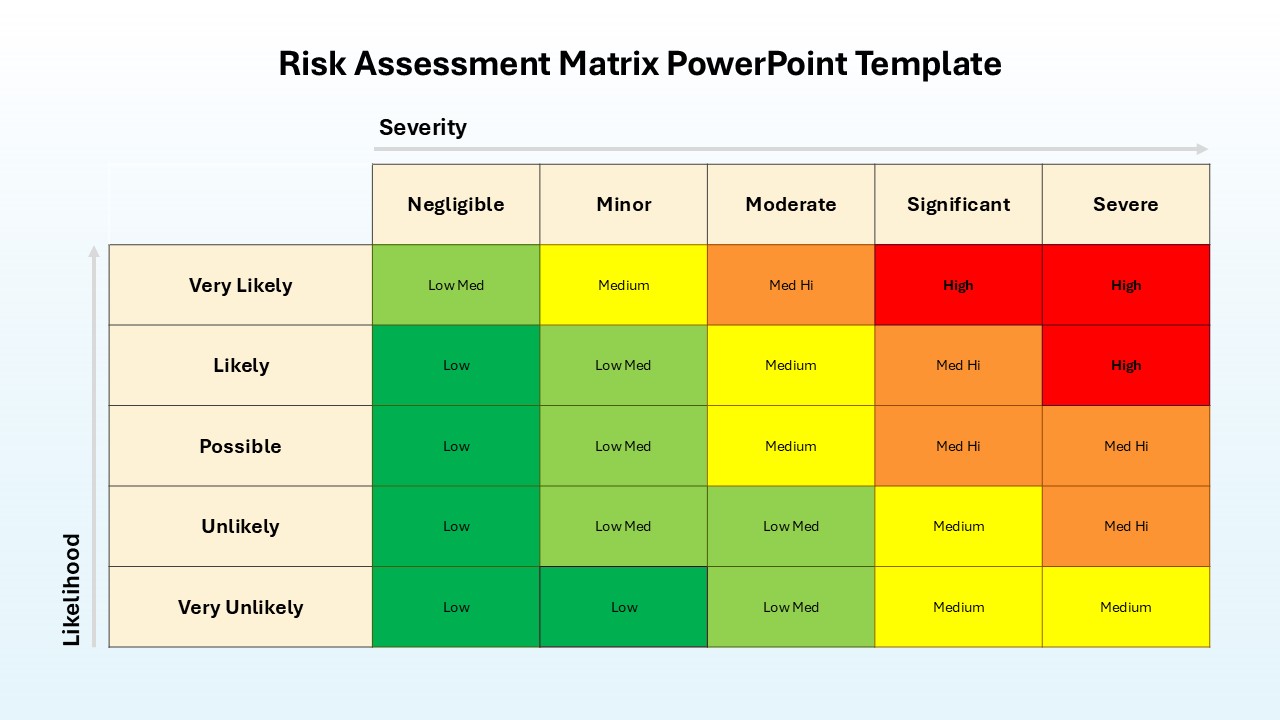
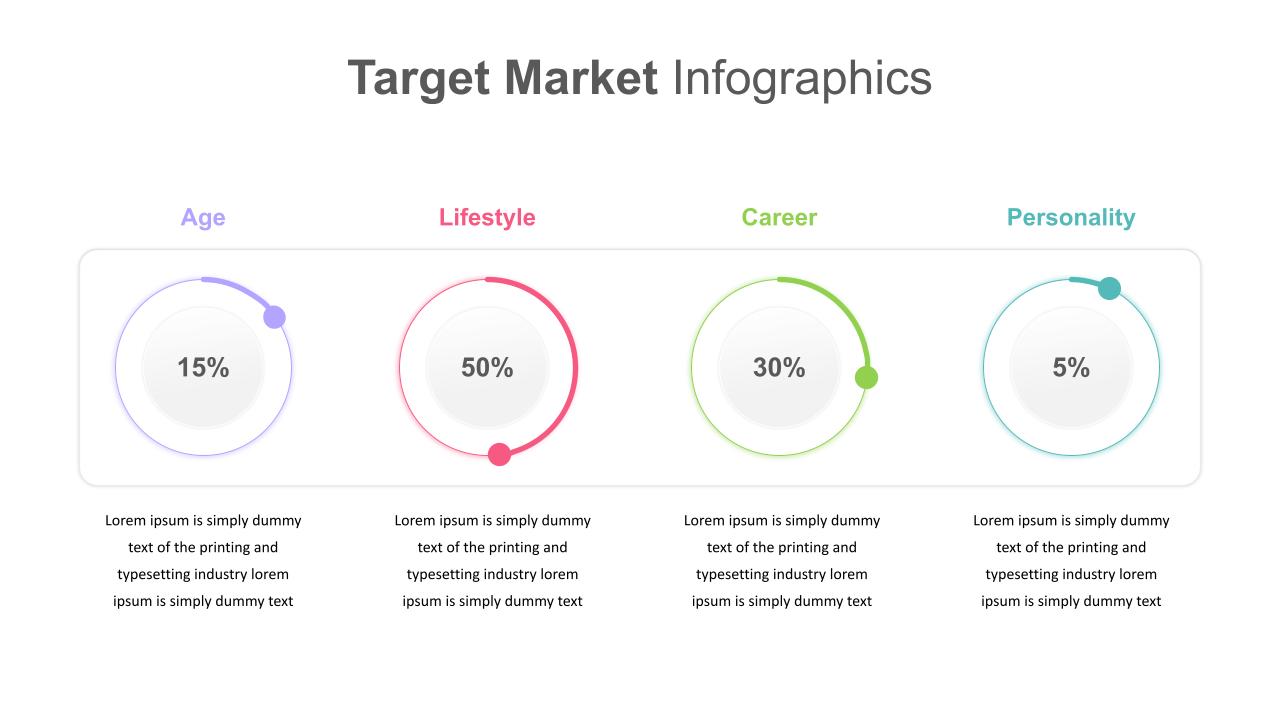
portfolio management, strategic business planning, product lifecycle analysis, resource allocation, investment prioritization, marketing strategy, executive presentations, business development, competitive analysis, innovation strategy
FAQs
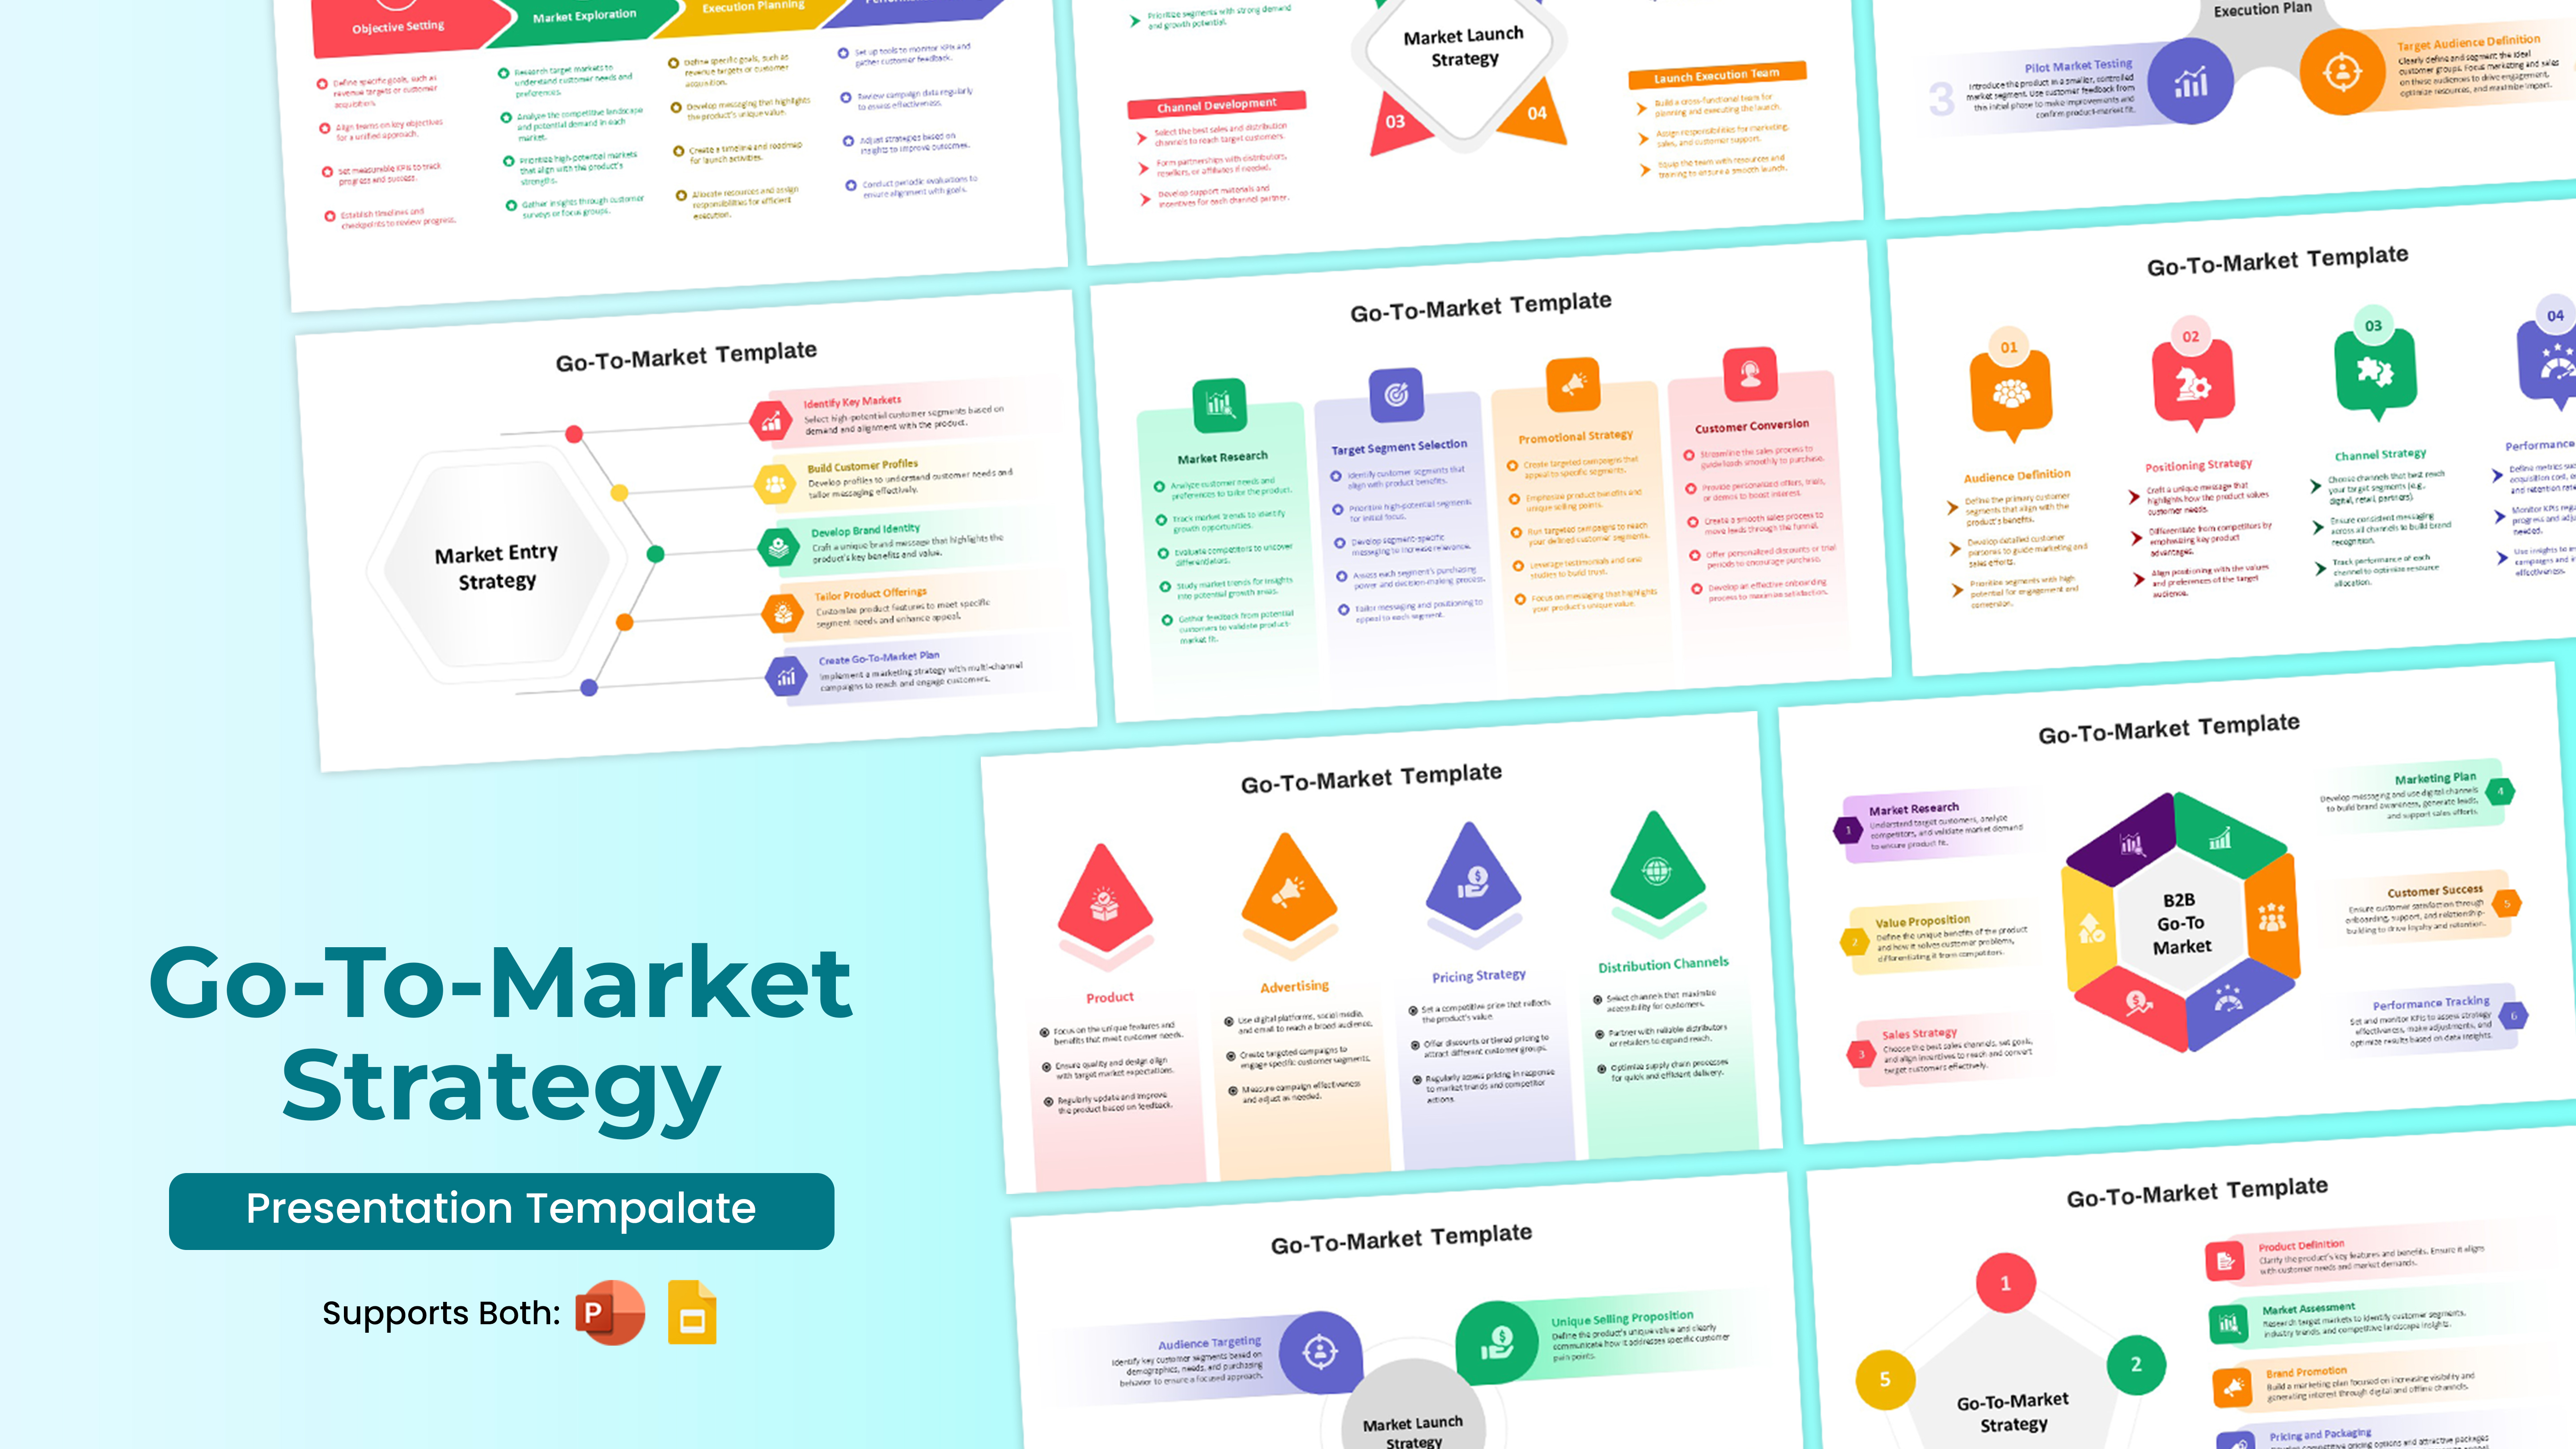
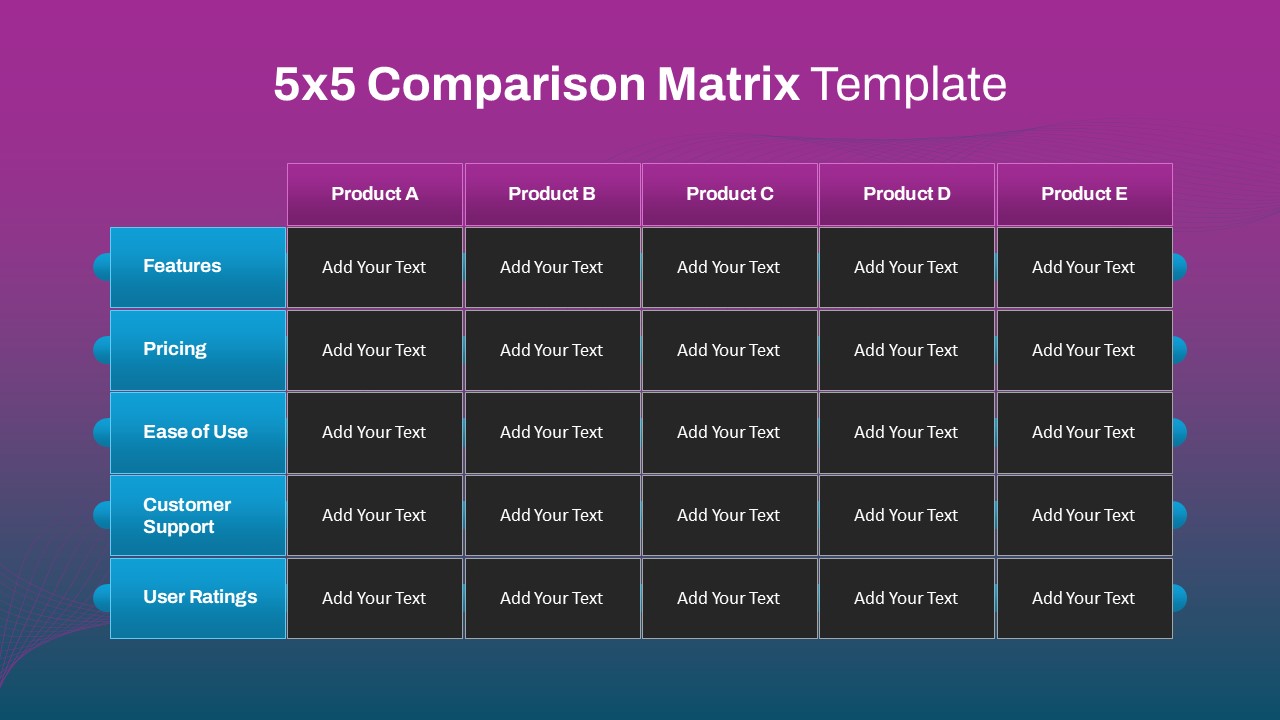
You May Also Like These Presentation Templates


- Free

- Free
- Free
- Free
- Free