Euler Diagram PowerPoint and Google Slides Template
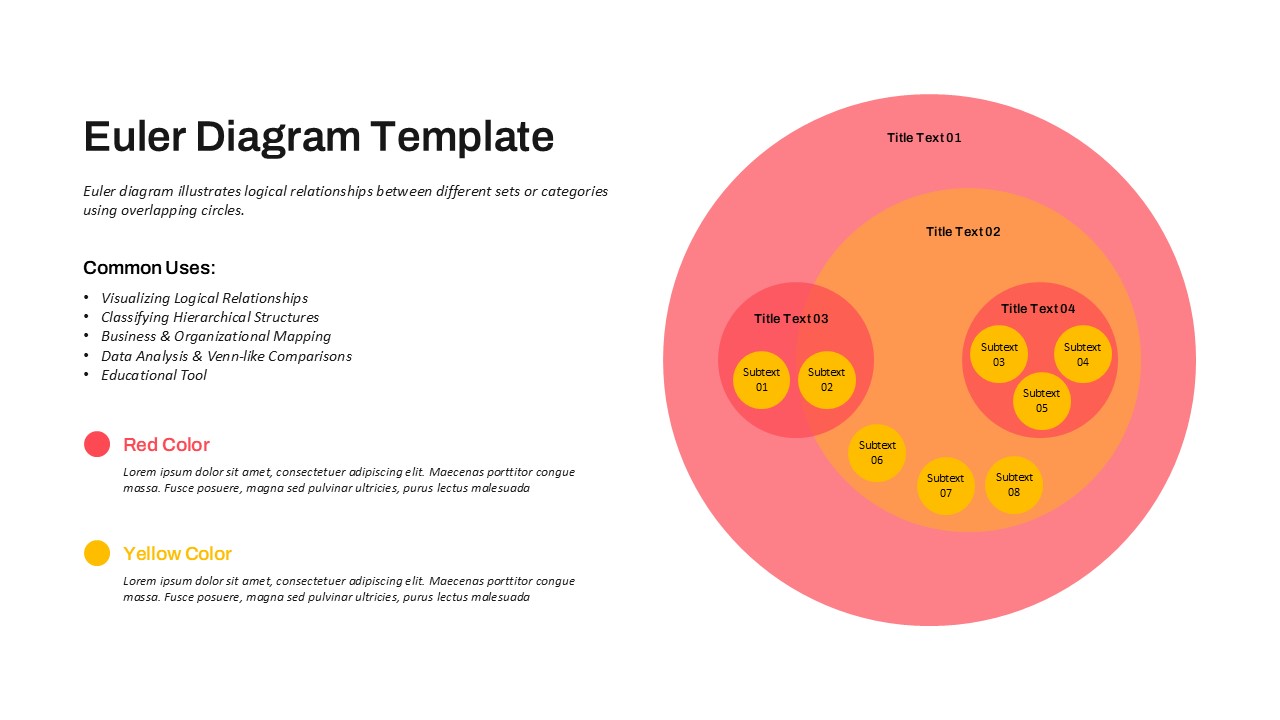
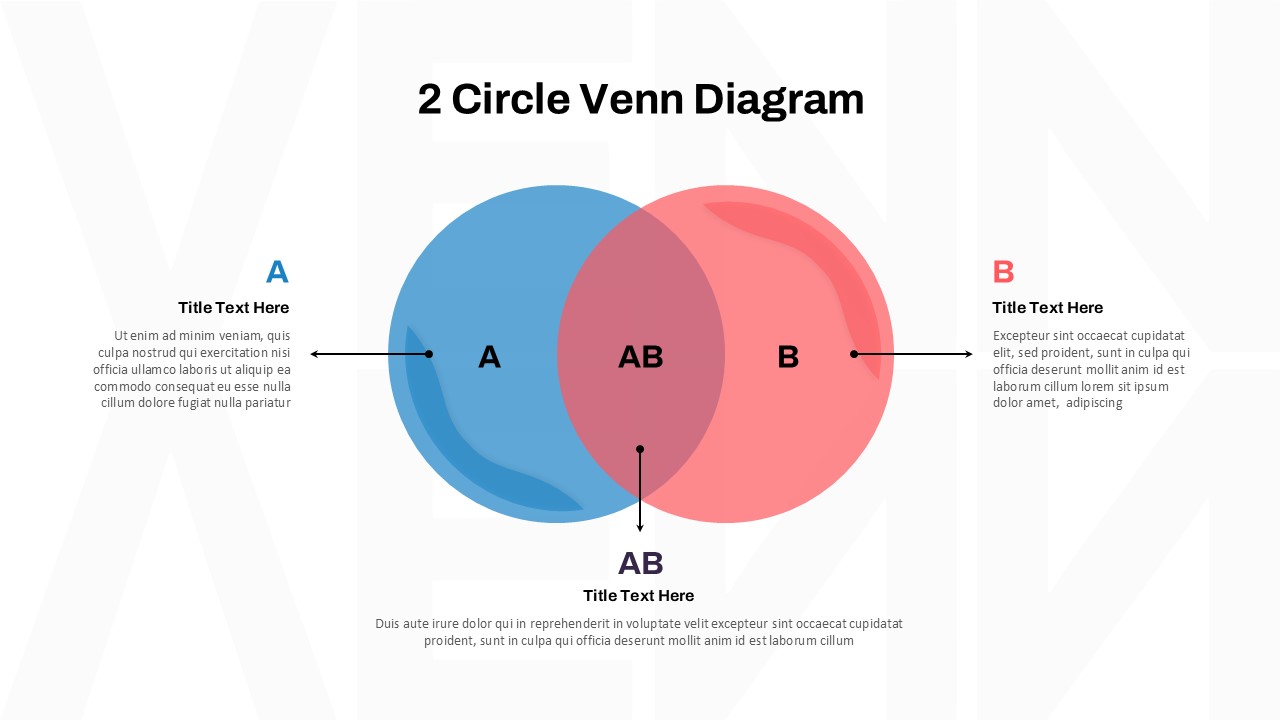
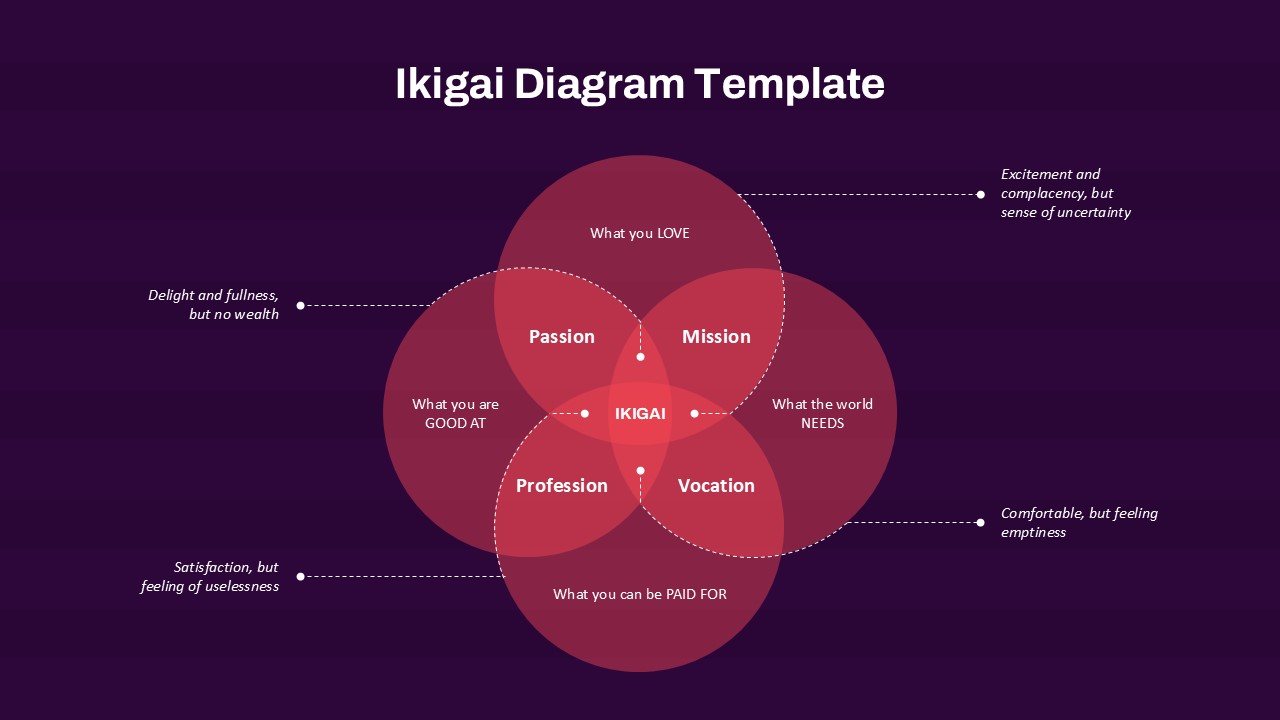
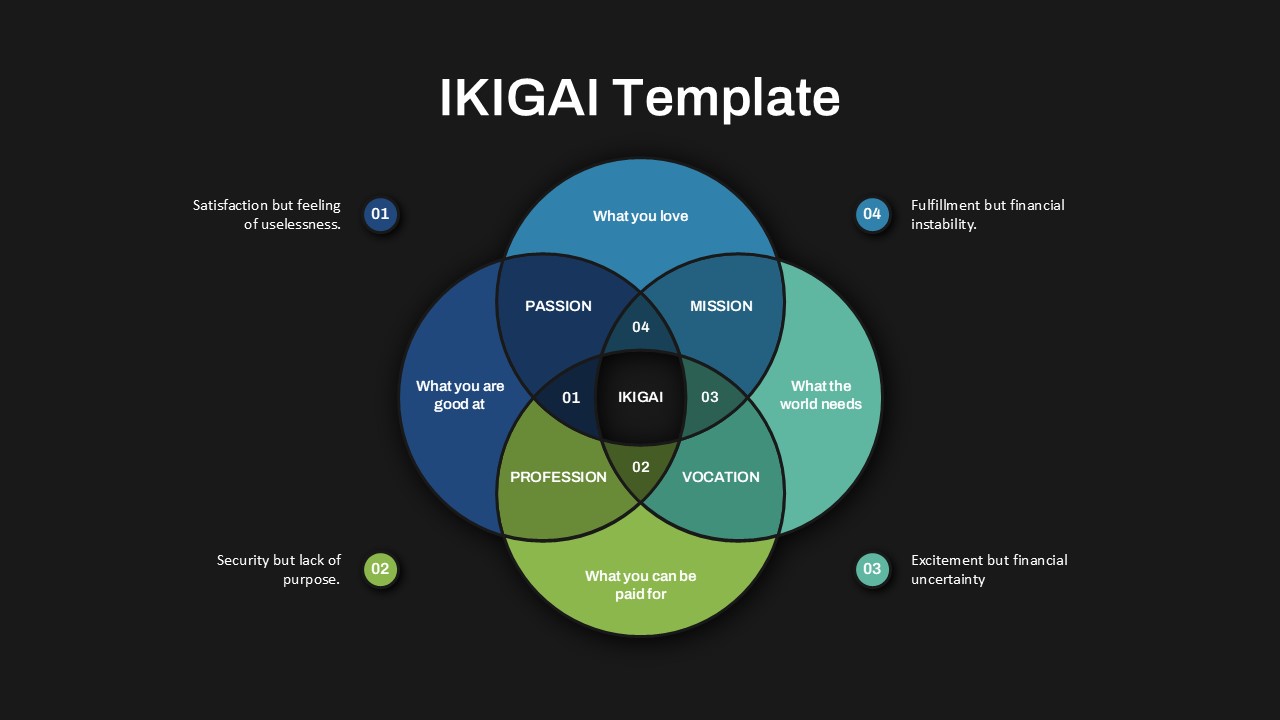
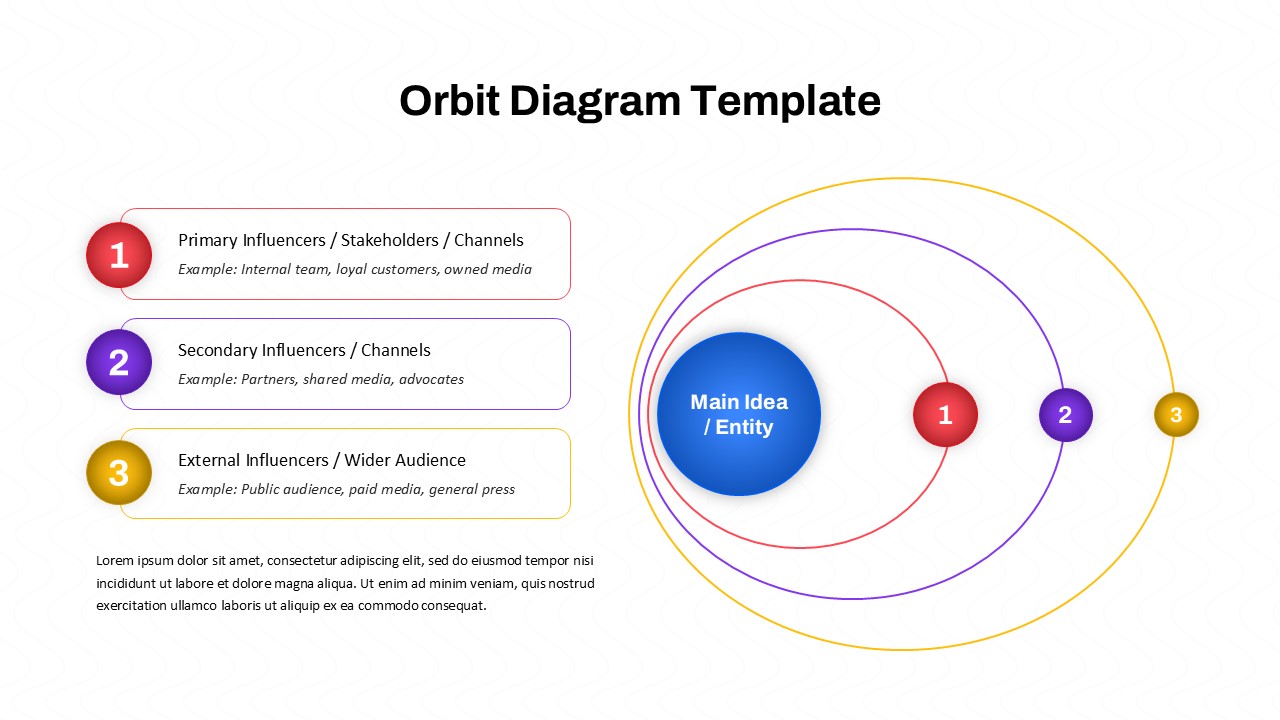
The Euler Diagram Template is a powerful visual tool designed to represent logical relationships, category hierarchies, and overlapping data sets through a clean and layered circular structure. Unlike standard Venn diagrams, Euler diagrams offer a more precise depiction of actual set interactions, making them highly valuable for analytical and organizational presentations.
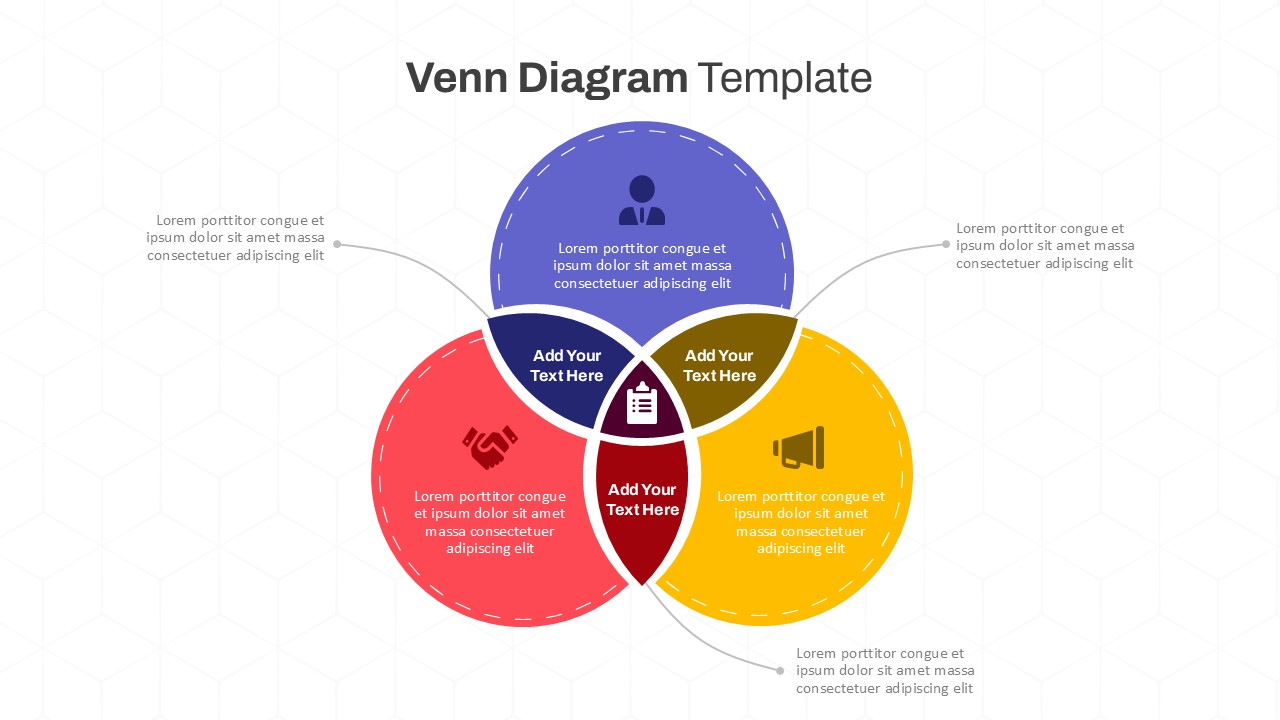
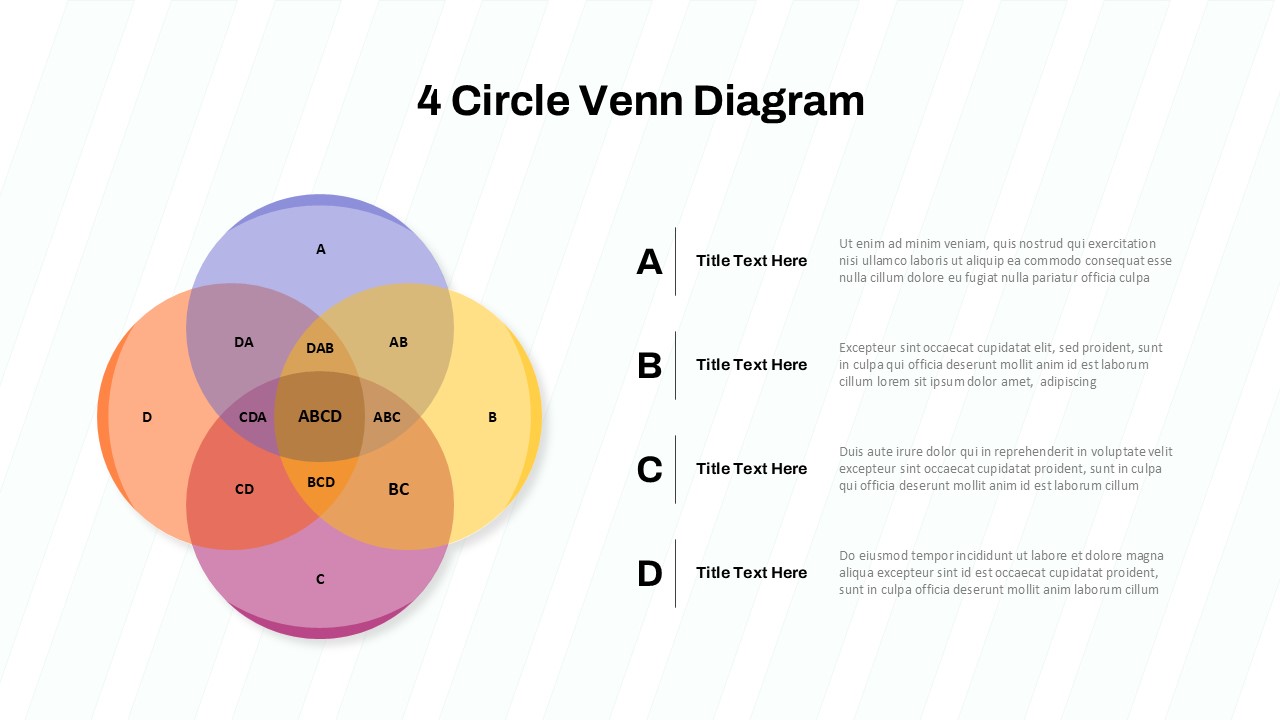
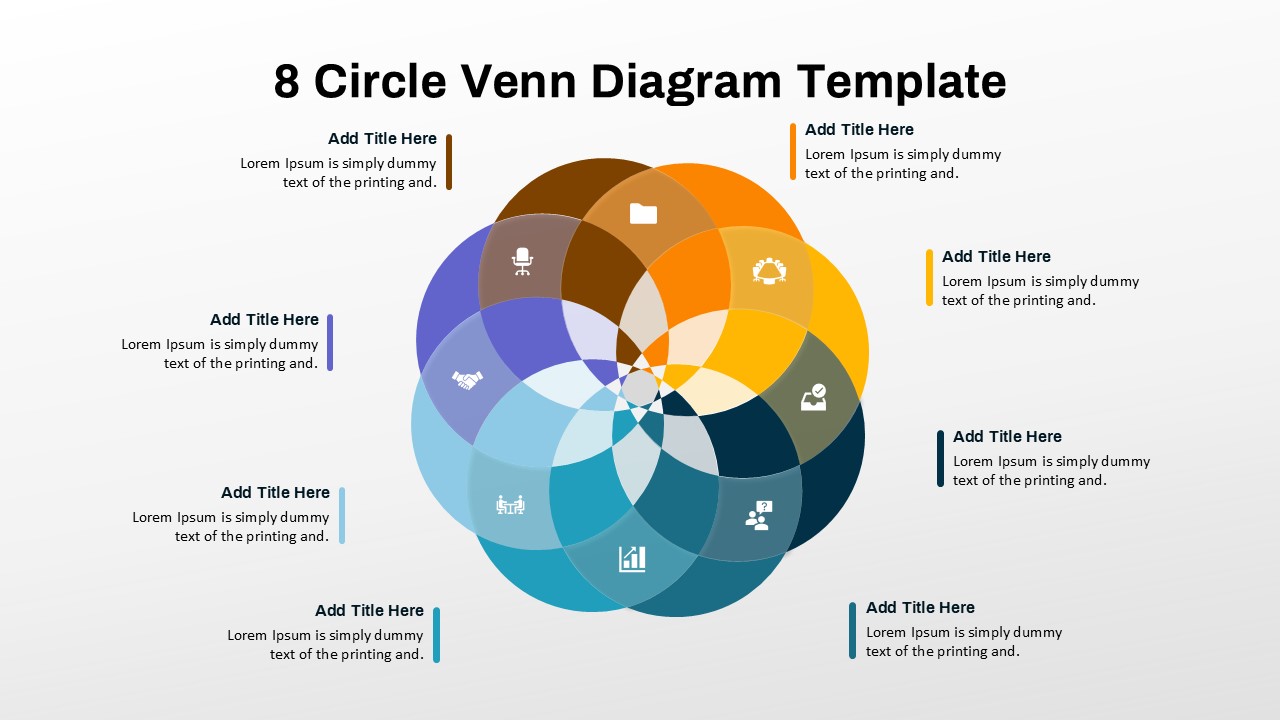
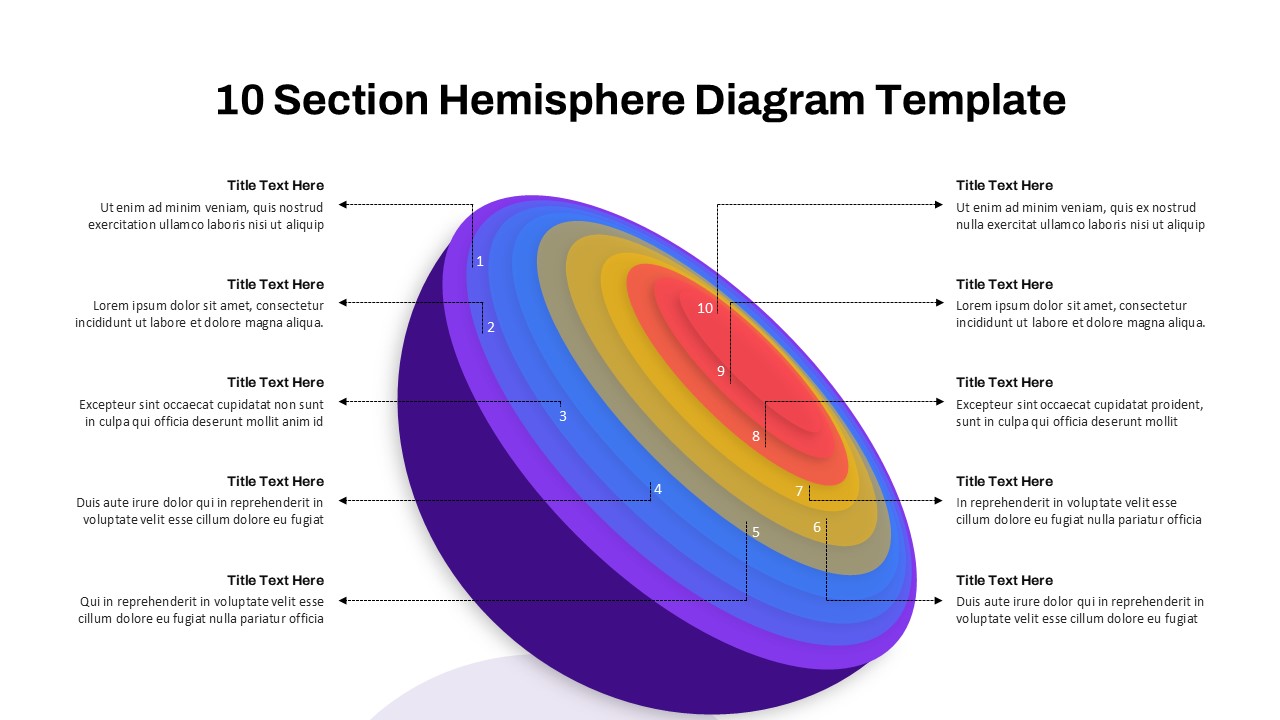
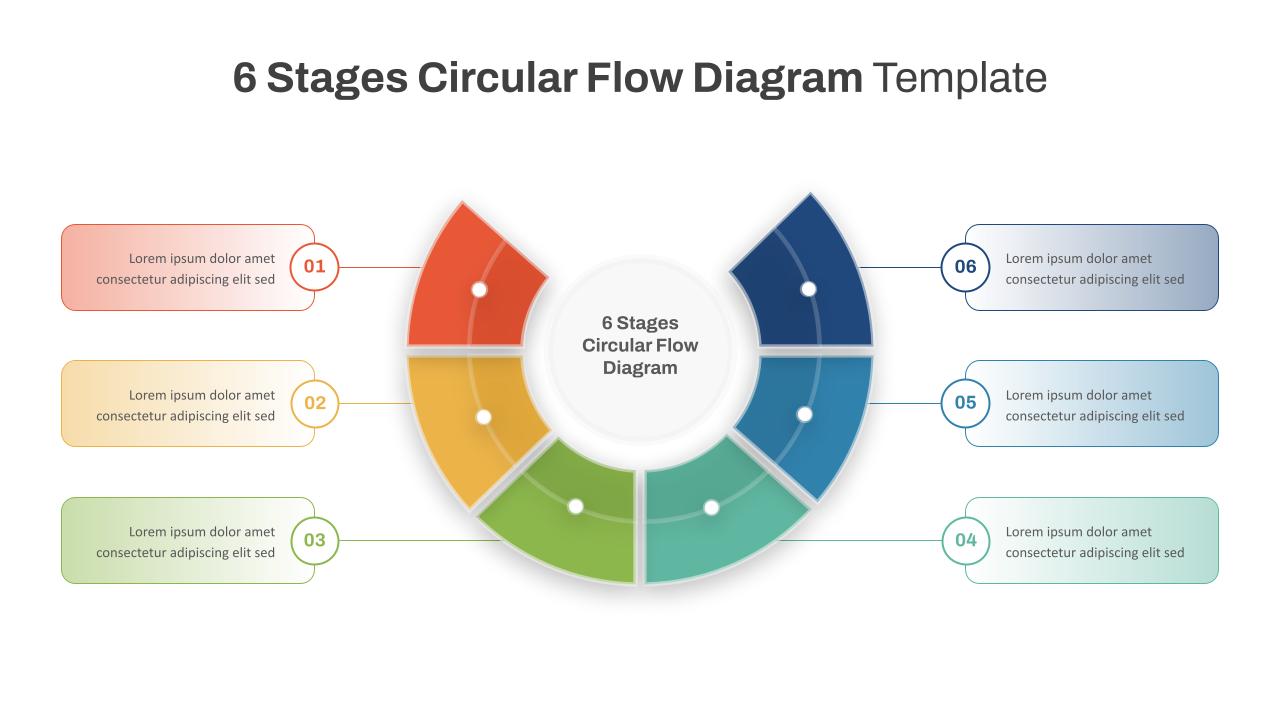
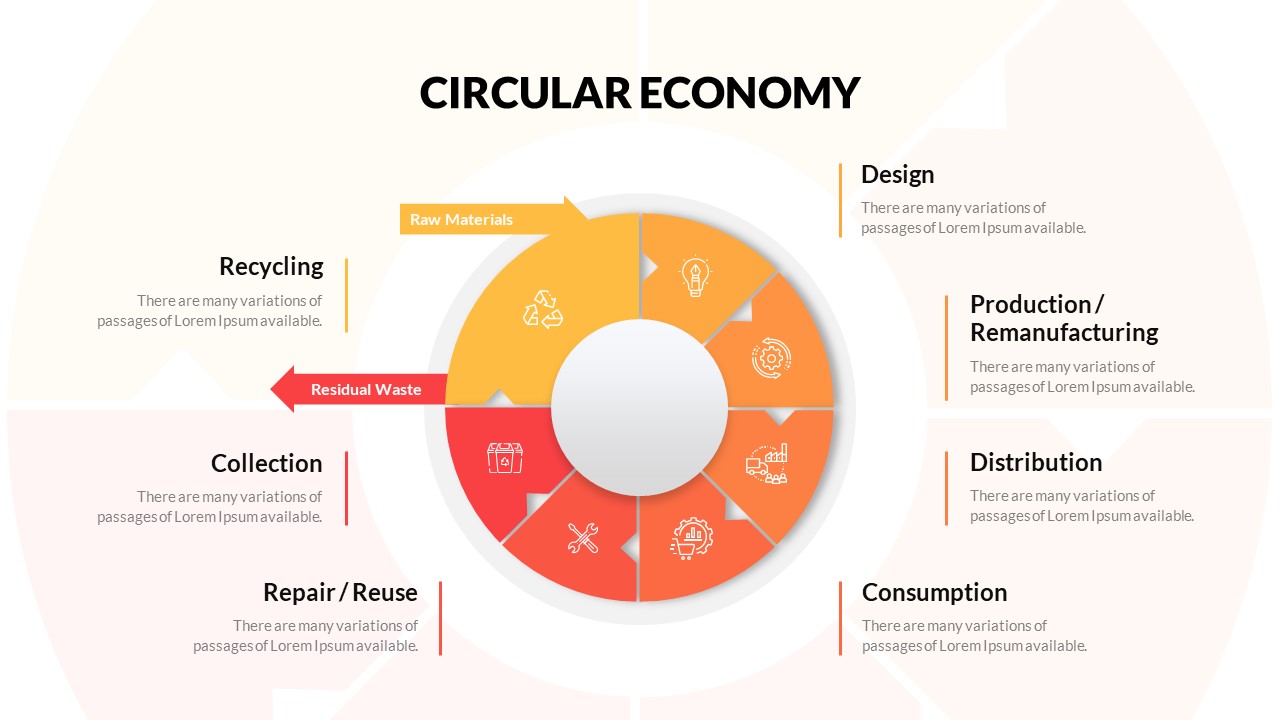
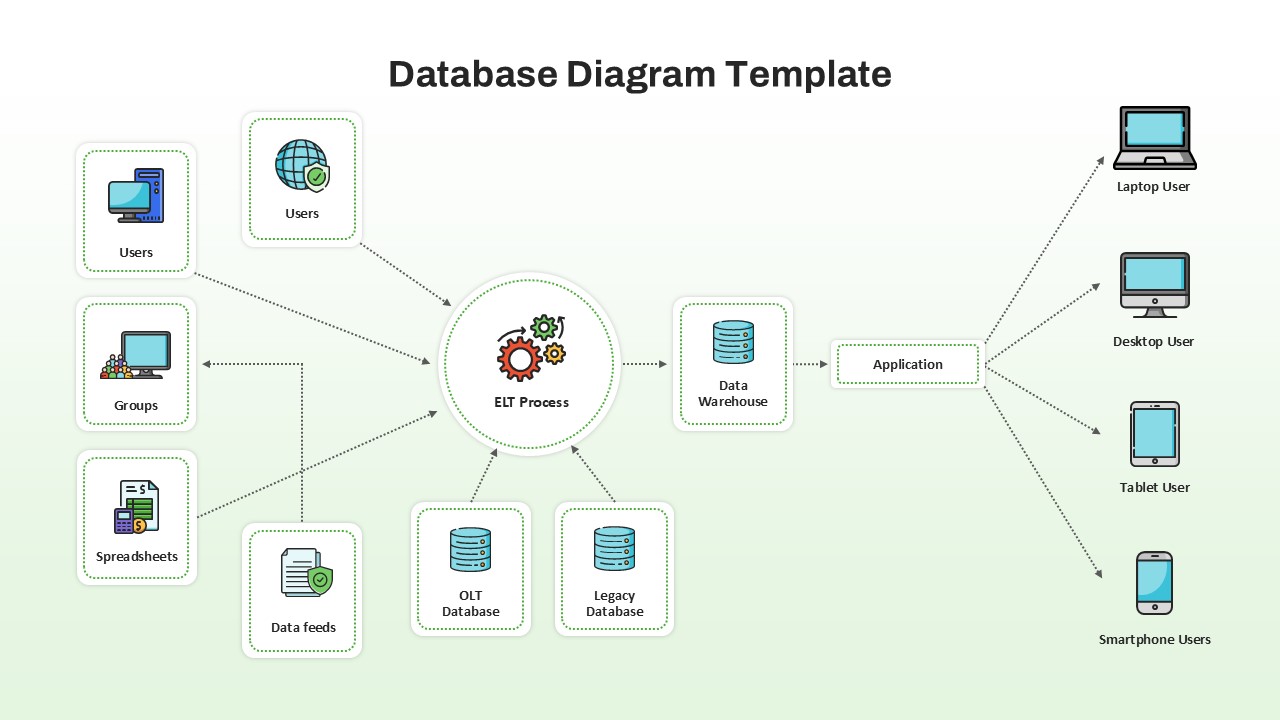
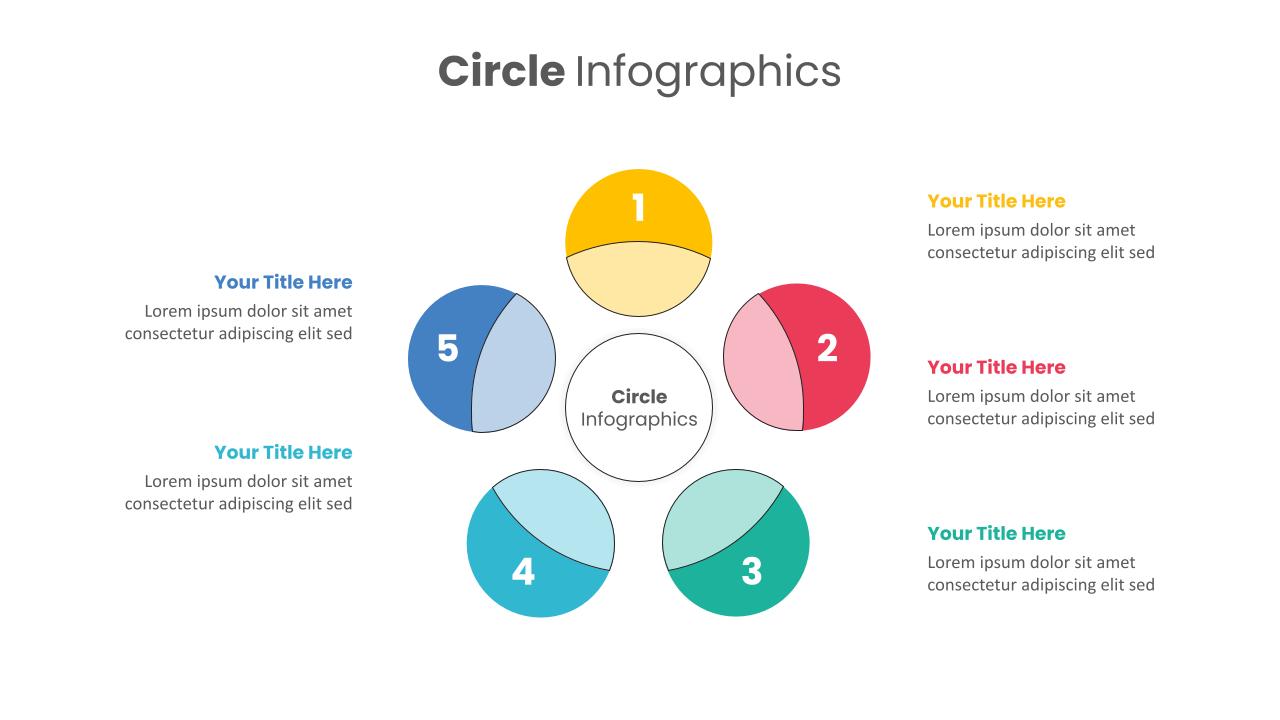
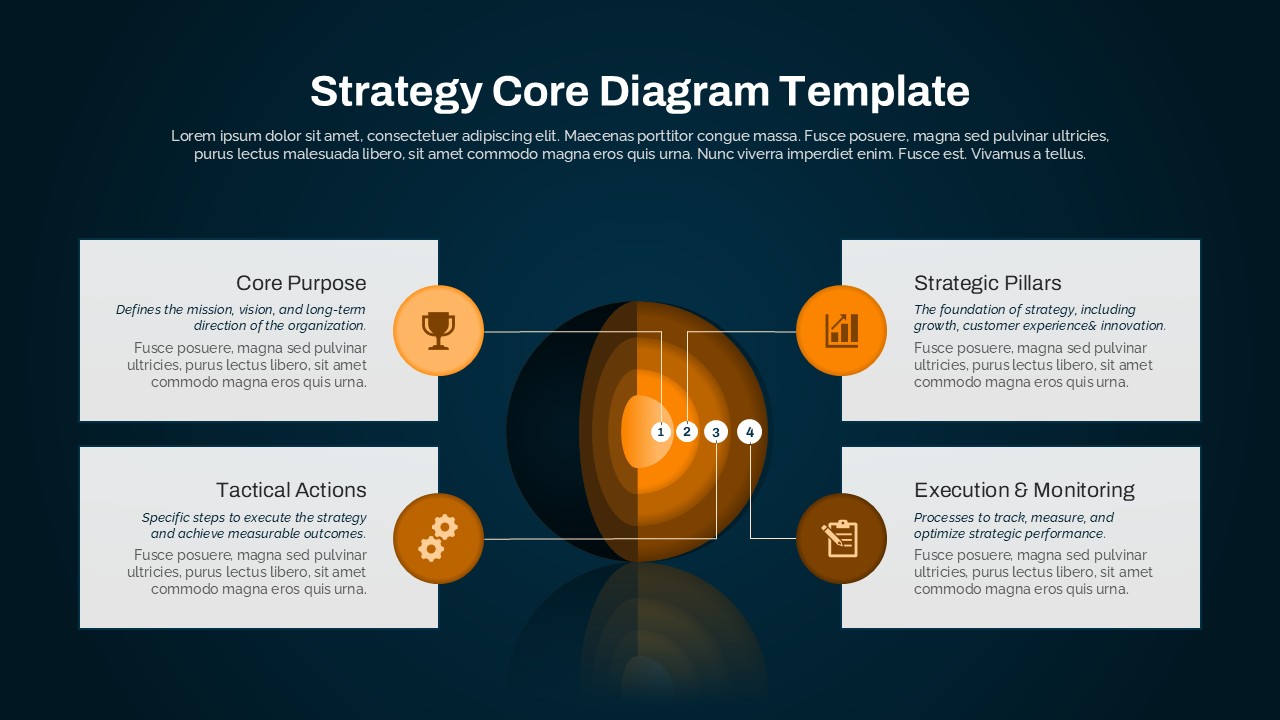
This euler diagram example template features a colorful, nested circular layout that enables users to show hierarchical and subset relationships with clarity. Large parent circles contain smaller, color-coded inner circles, each of which can be customized with titles and subtexts to reflect real-world categories, processes, or classifications. The red and yellow color palette ensures a clear distinction between groupings while maintaining a cohesive design.
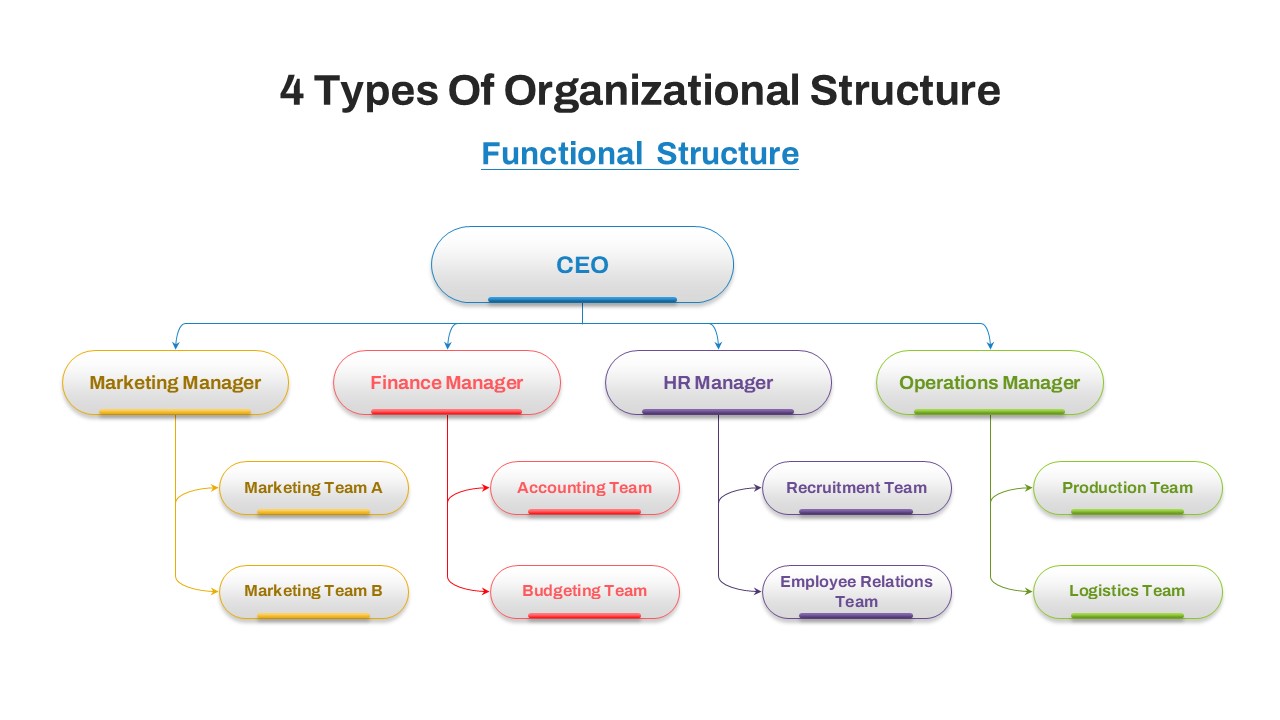
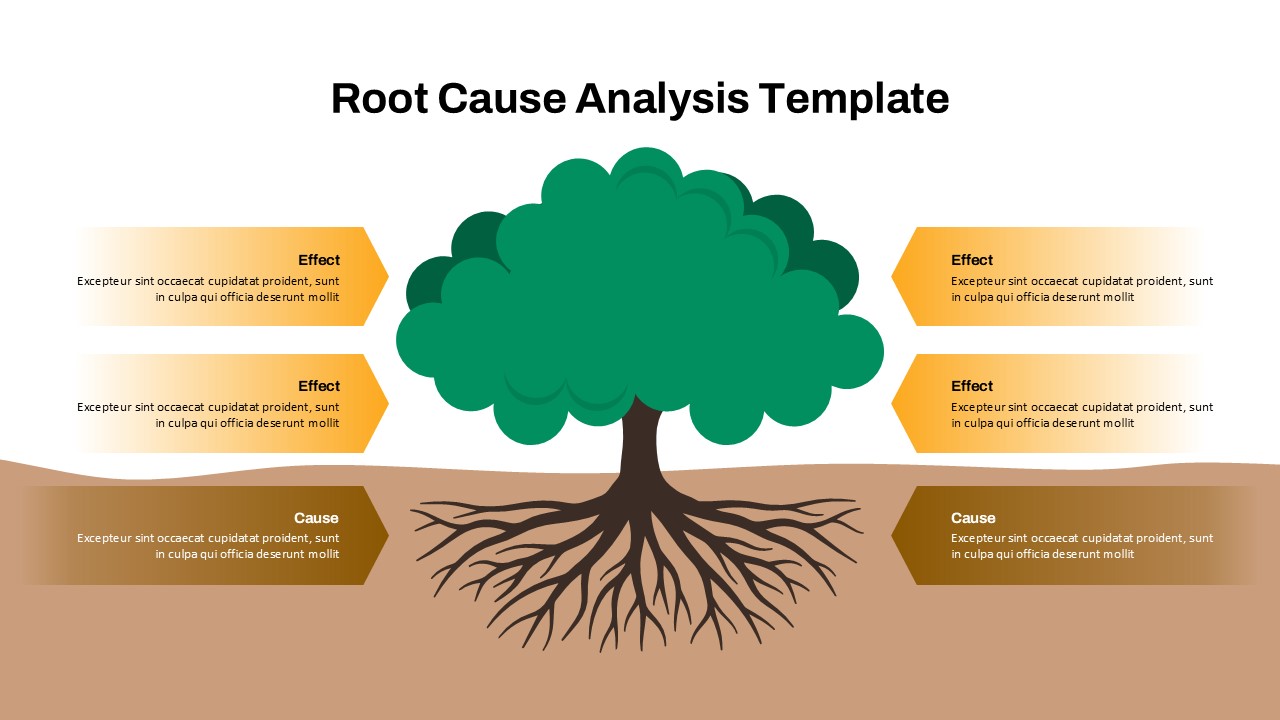
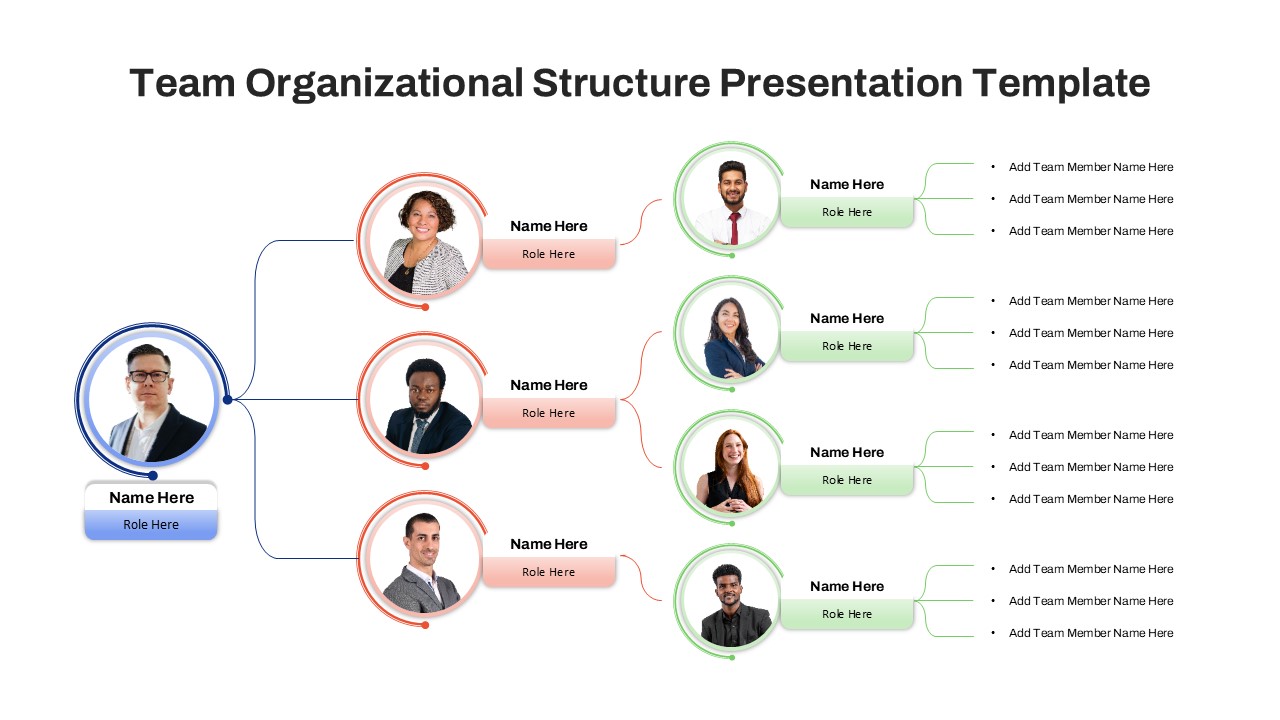
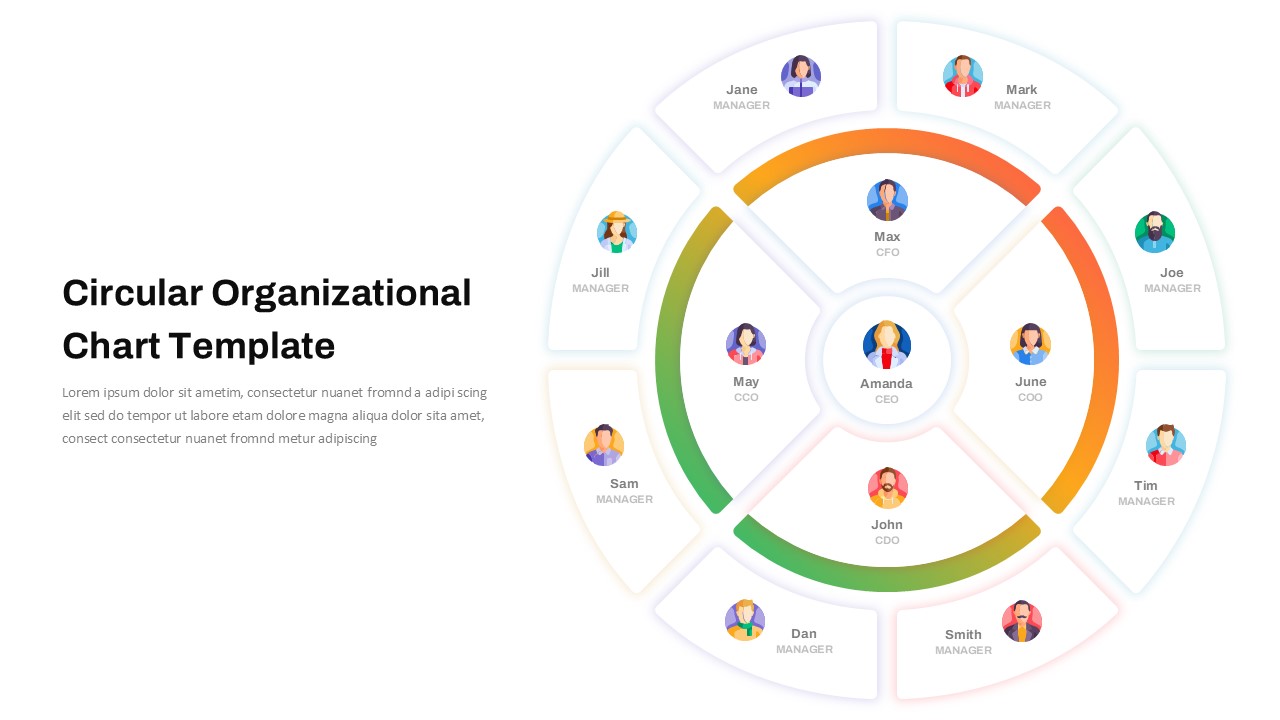
Perfect for visualizing data structures, business functions, taxonomies, and educational content, this template suits professionals and educators alike. Whether you’re mapping a corporate structure, illustrating database segmentation, or presenting overlapping departmental roles, this layout provides a dynamic yet simple way to convey complex relationships.
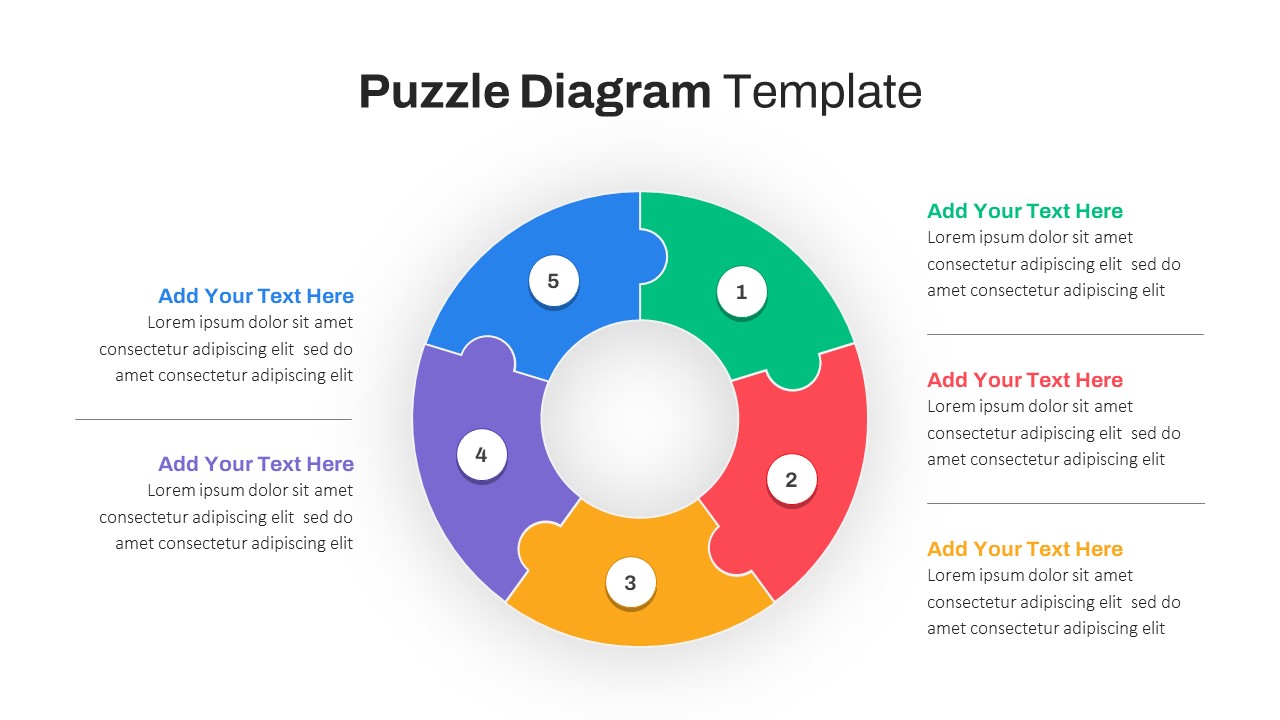
Available for both PowerPoint and Google Slides, the template is fully editable—allowing you to modify colors, text, and layouts to align with your branding or project needs. It also includes helpful legend sections for contextual clarity, making your presentation more comprehensive and engaging.
Use this diagram to elevate your explanations, support data storytelling, and simplify information through structured visual communication.
See more

Aspect Ratio
16:9Item ID
SKT03598
Features of this template
Other User Cases of the Template:
concept mapping, business unit segmentation, organizational structure analysis, educational illustrations, data categorization, taxonomy building, strategic planning, knowledge management, logical set classification, research presentation tools
FAQs
You May Also Like These Presentation Templates


- Free
- Free


- Free
- Free
- Free
- Free
- Free
- Free