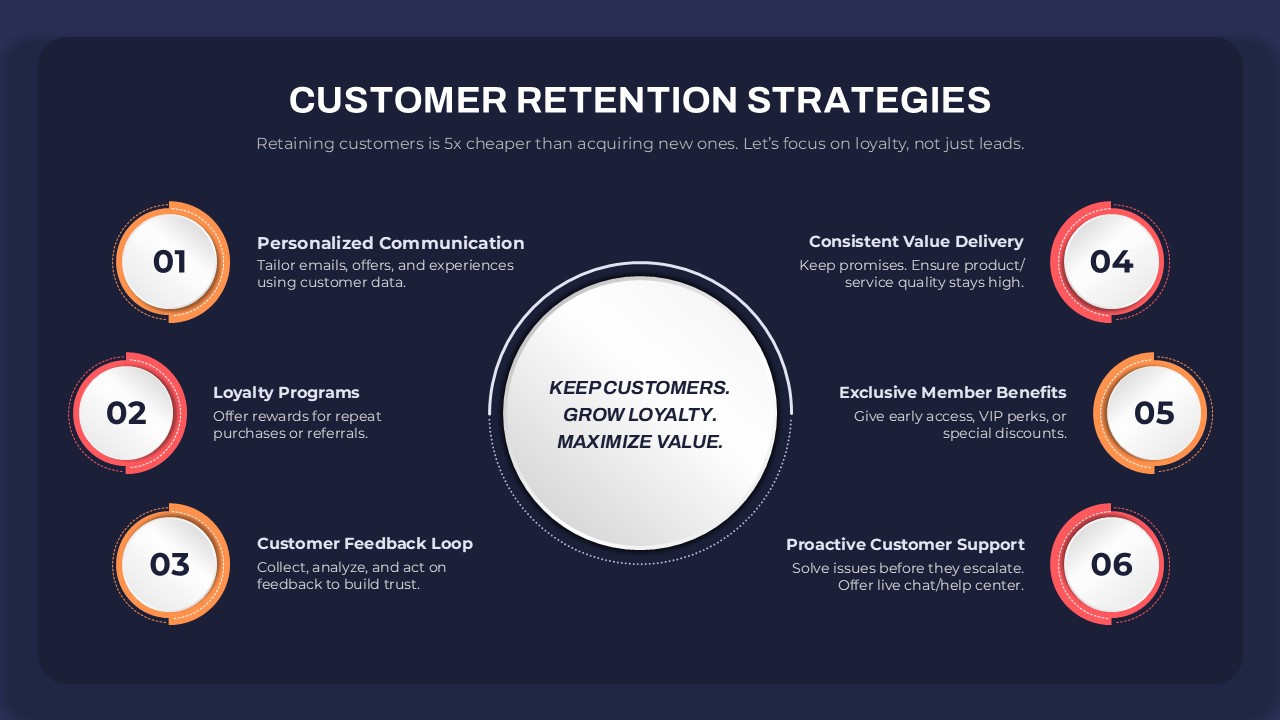
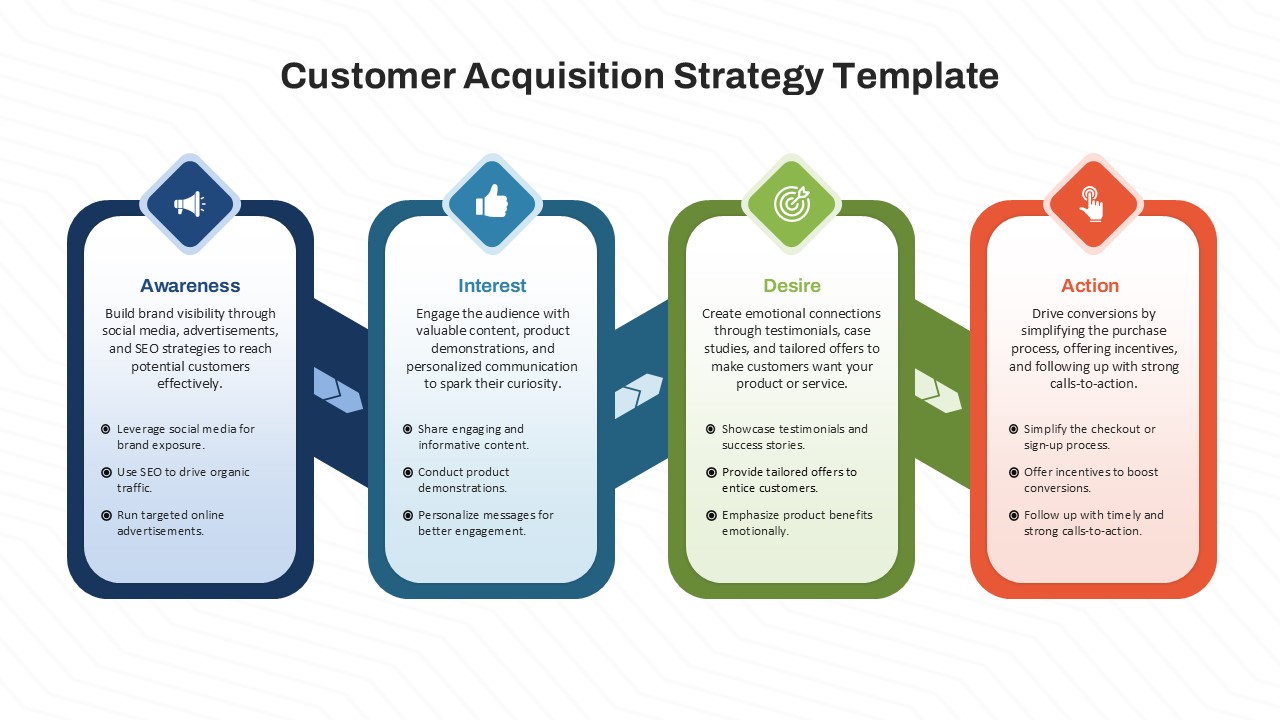
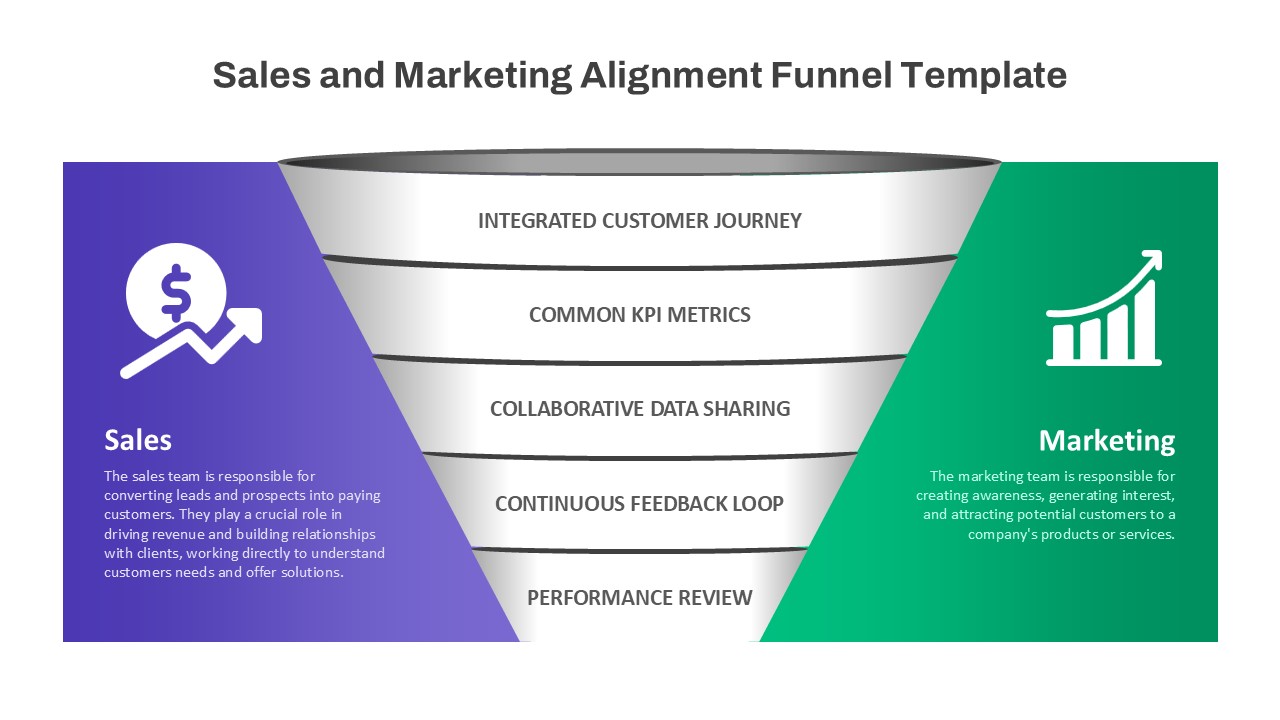
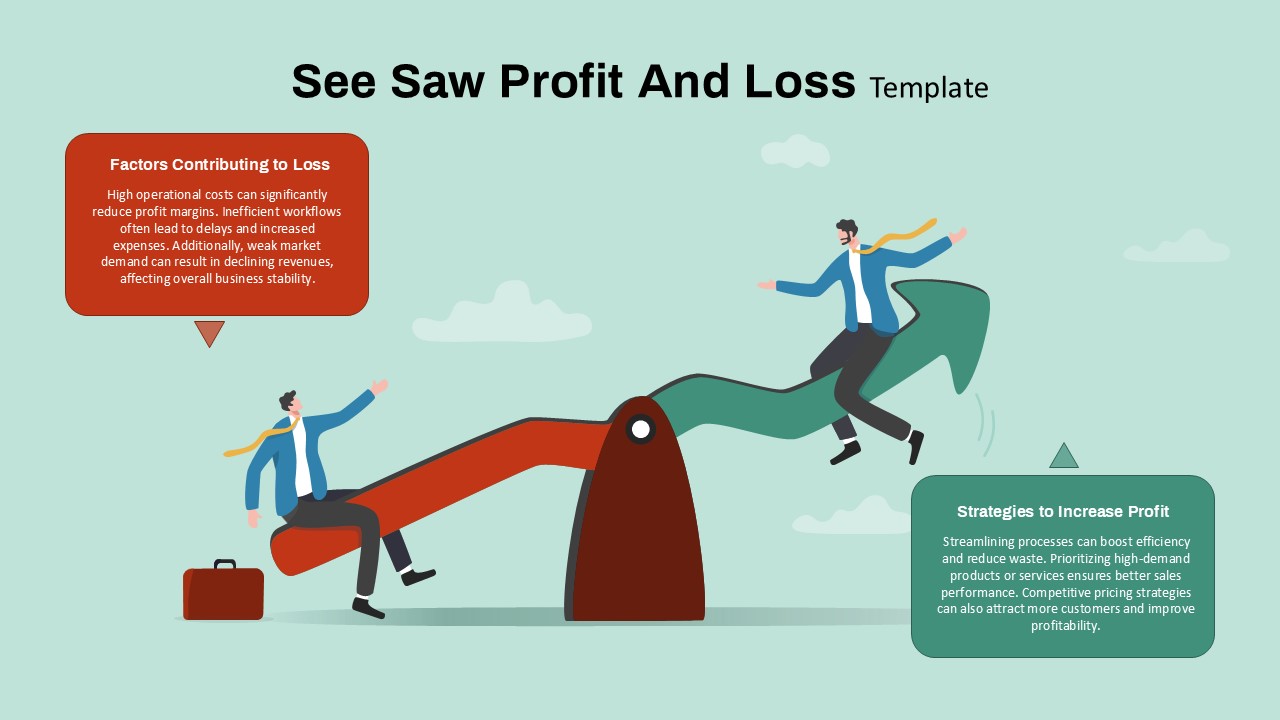
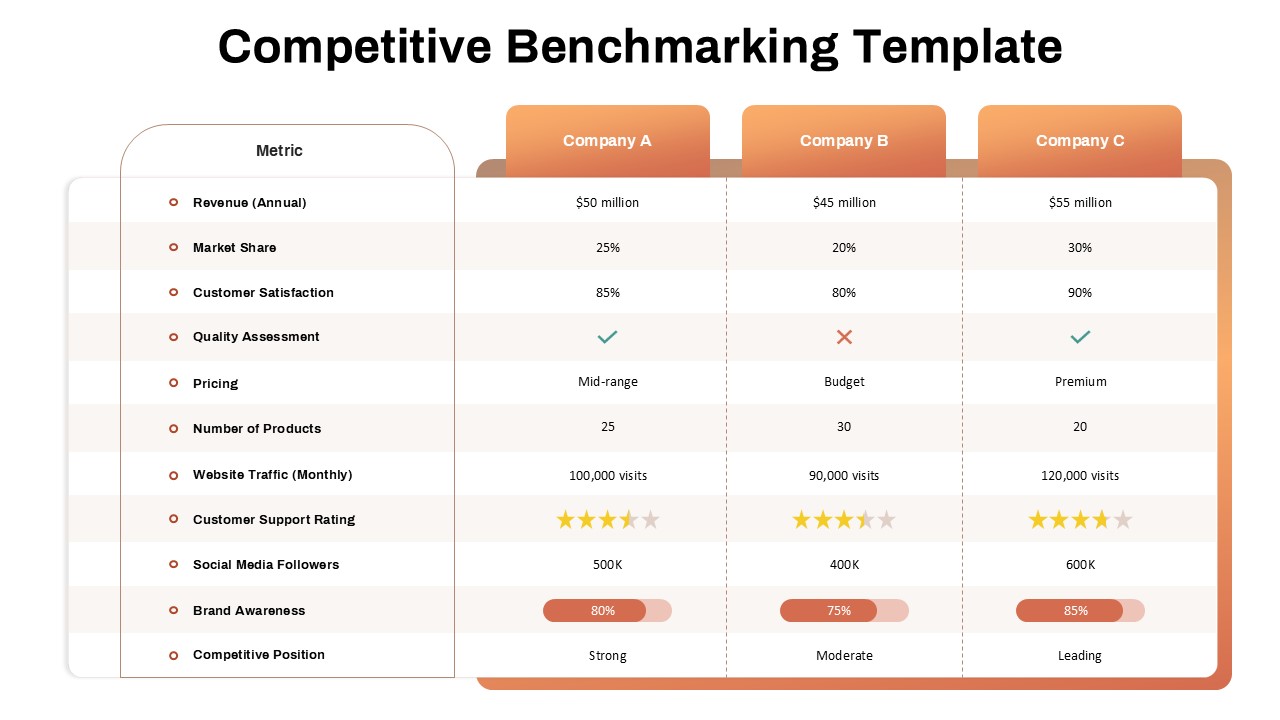
Customer Acquisition vs. Lifetime Value Chart PowerPoint Template
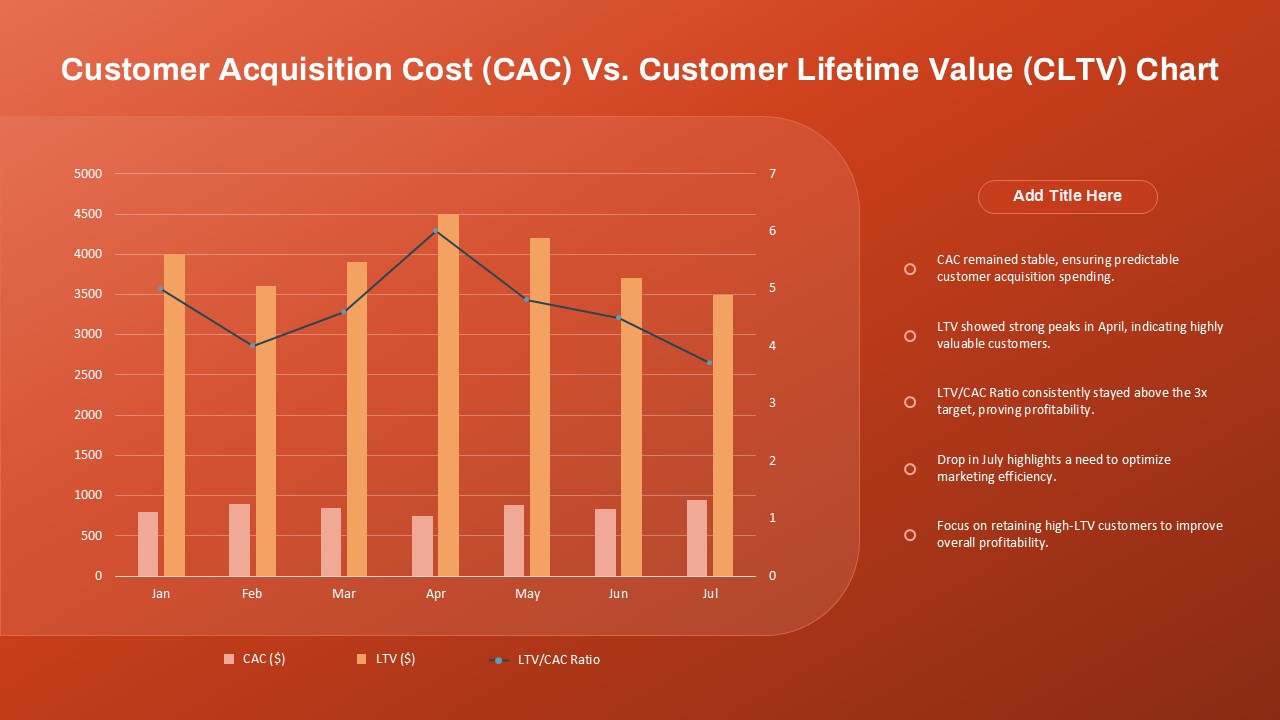
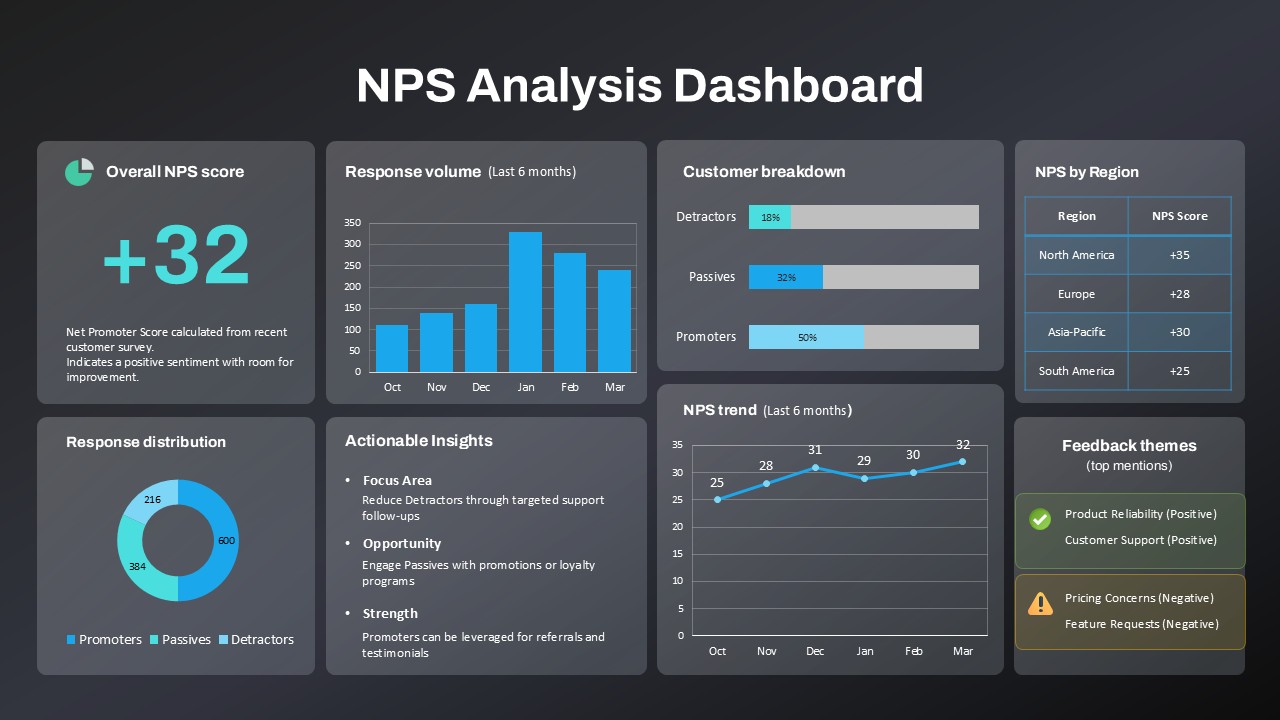
Evaluate marketing efficiency and profitability with this insightful Customer Acquisition Cost (CAC) vs. Customer Lifetime Value (CLTV) Chart PowerPoint Template. Perfect for marketing teams, business analysts, and growth strategists, this dual-axis chart provides a visual breakdown of acquisition costs, customer value, and the crucial LTV/CAC ratio across monthly periods.
The chart uses bar visuals to compare CAC and CLTV values, while overlaying a line graph to represent the LTV/CAC ratio. This design helps teams instantly assess whether acquisition investments are generating profitable returns. A high LTV/CAC ratio signifies strong ROI, whereas dips may indicate inefficiencies that need immediate attention.
Complementing the visual data are annotated insights on the right-hand side, summarizing key observations such as stable CAC, seasonal customer value spikes, and profitability thresholds. These insights guide decision-making and strategy refinement—whether you’re allocating ad budgets, planning retention strategies, or presenting performance to stakeholders.
Optimized for both PowerPoint and Google Slides, this template is fully editable, allowing teams to input their own data, adjust metrics, and customize the design to reflect brand aesthetics or reporting standards. It’s an essential tool for quarterly reviews, growth marketing presentations, and investor updates.
See more

Aspect Ratio
16:9Item ID
SKT03851
Features of this template
Other User Cases of the Template
Marketing performance reviews, Investor pitch decks, Growth strategy presentations, SaaS financial modeling, Customer segmentation analysis, Retention strategy briefings, ROI tracking reports, Monthly or quarterly KPI reviews, Revenue optimization planning, Executive dashboard updates
FAQs
You May Also Like These Presentation Templates


- Free

- Free

- Free