World Maps Data Analysis Templates for PowerPoint and Google Slides


PowerPoint World Map Slide Deck for Business and Academic Use
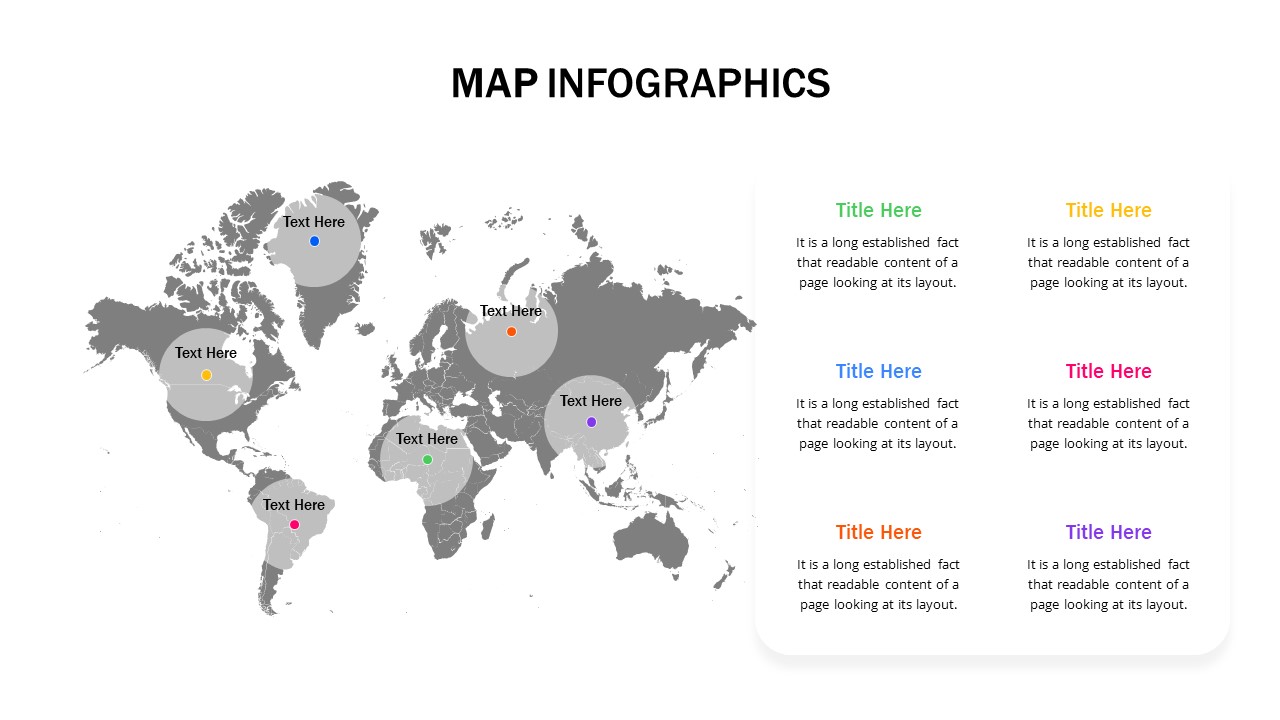
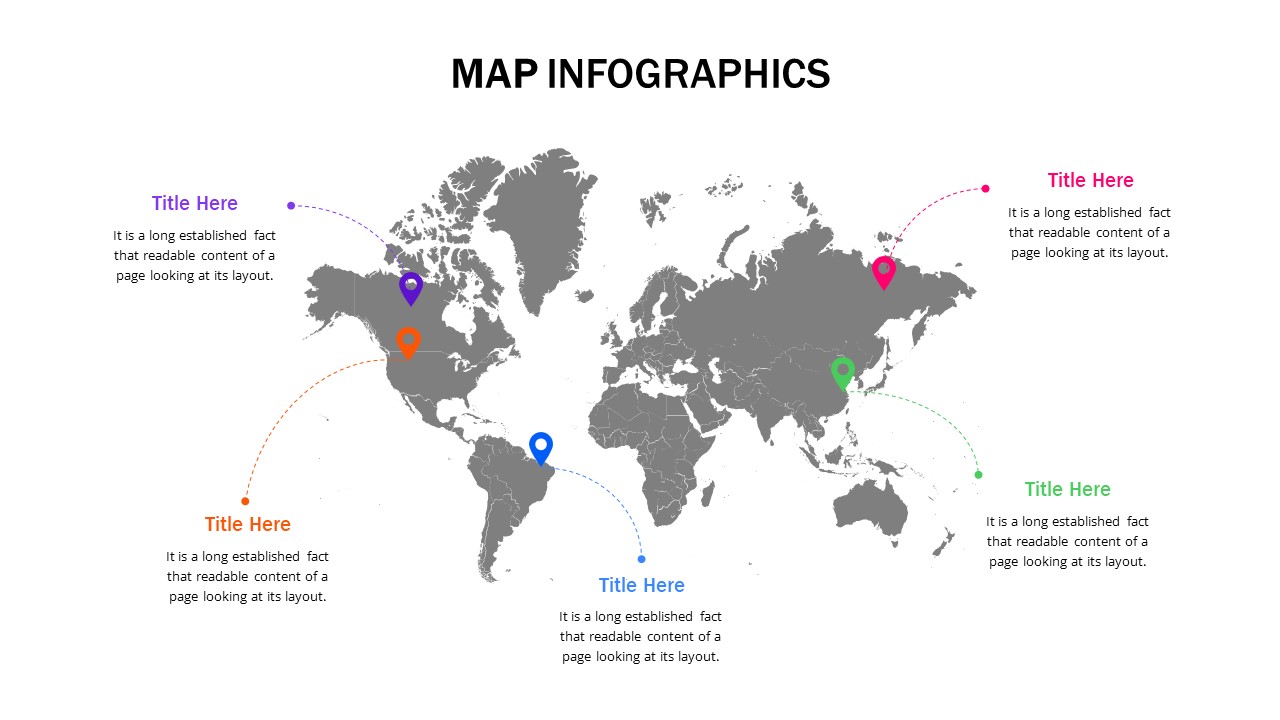
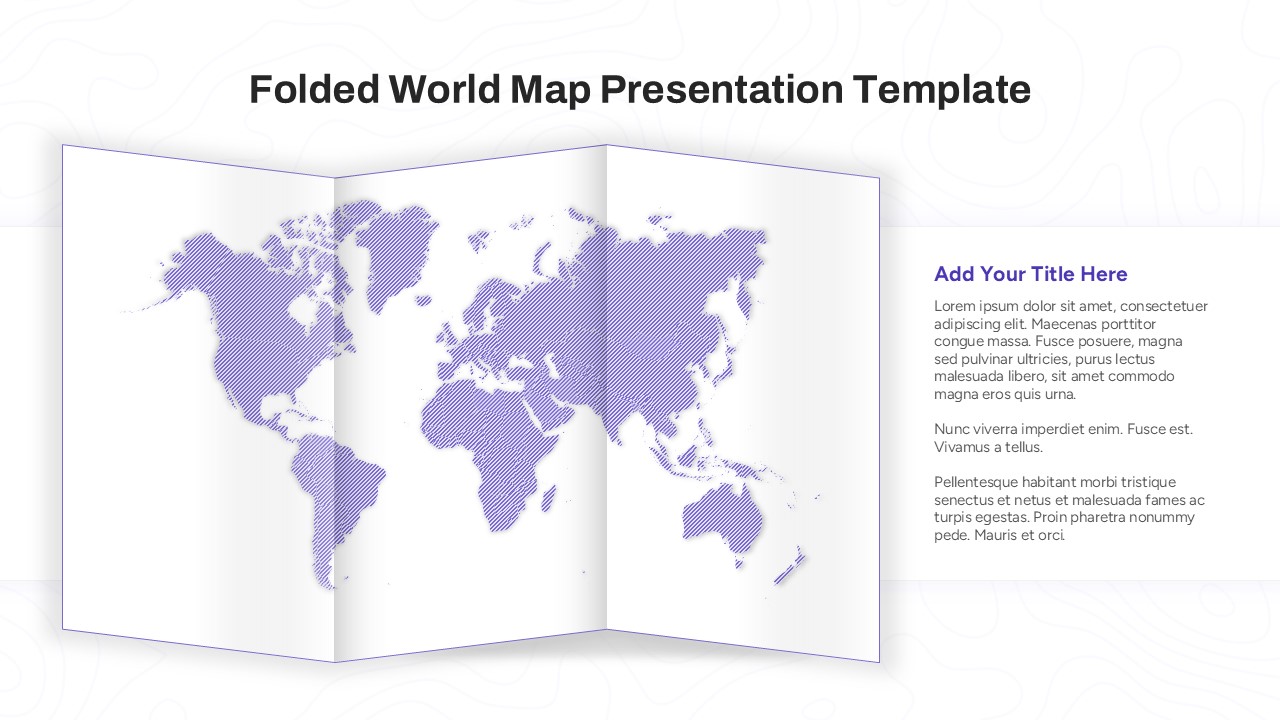
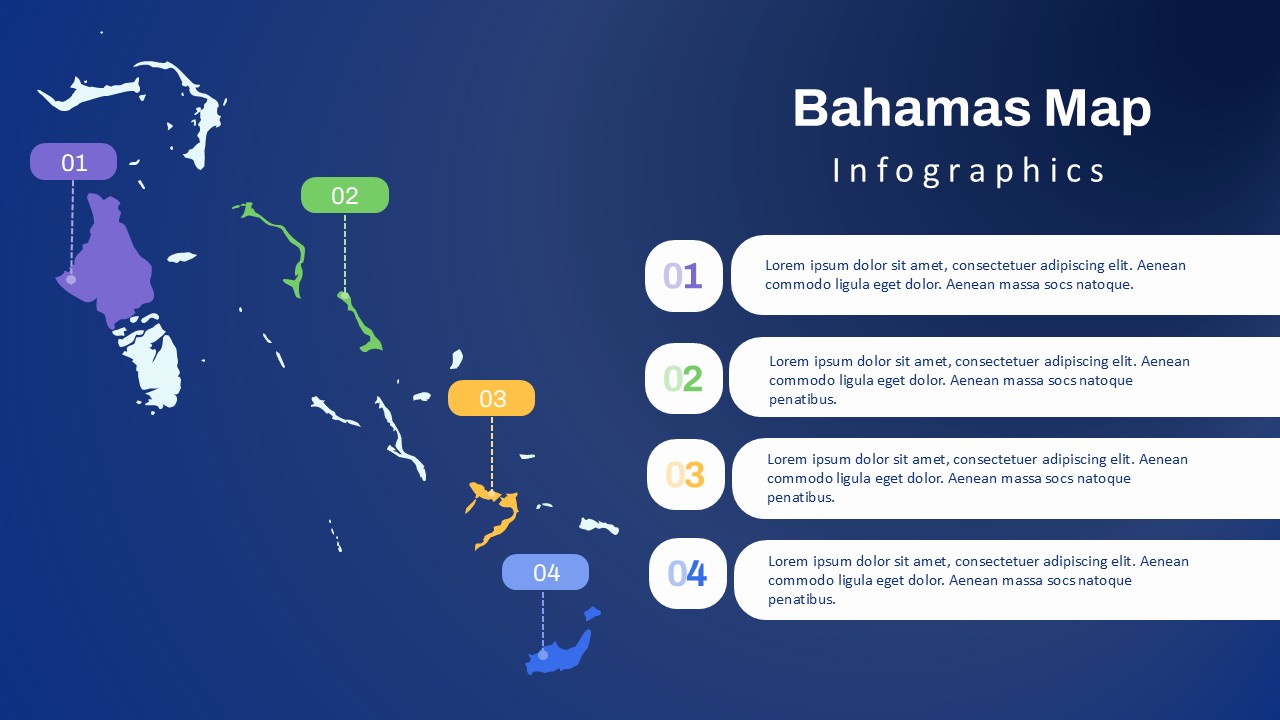
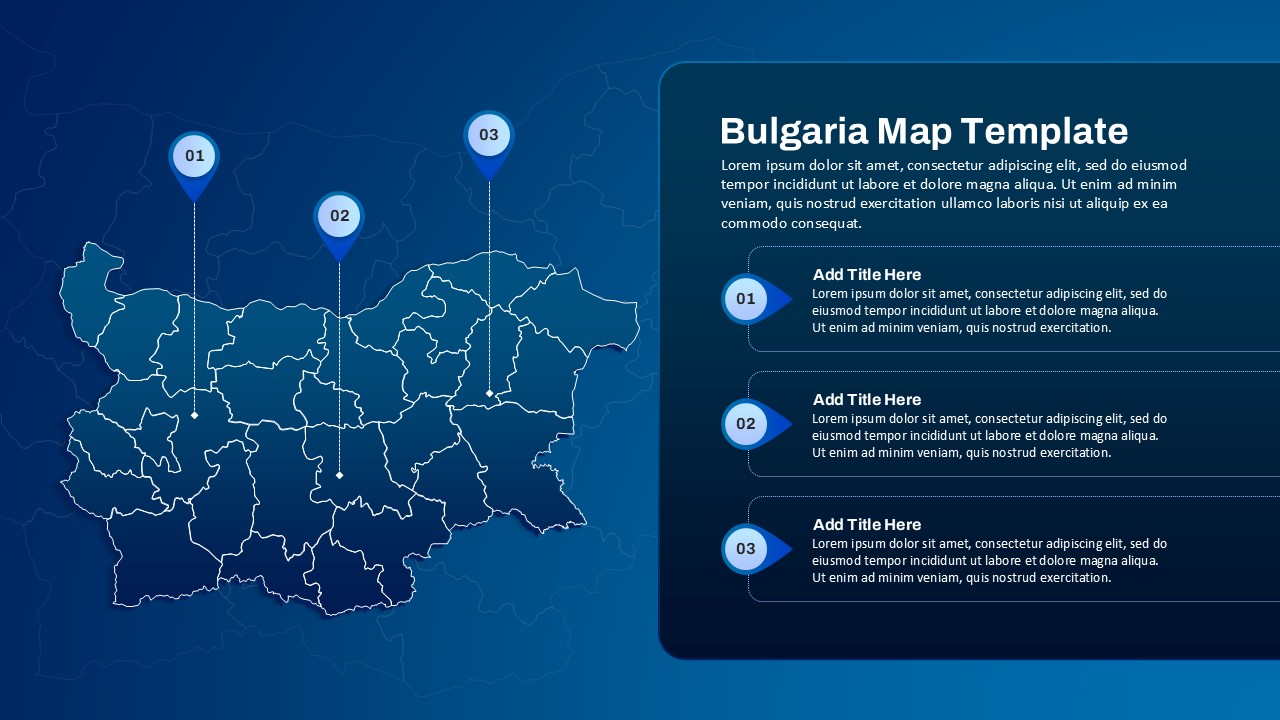
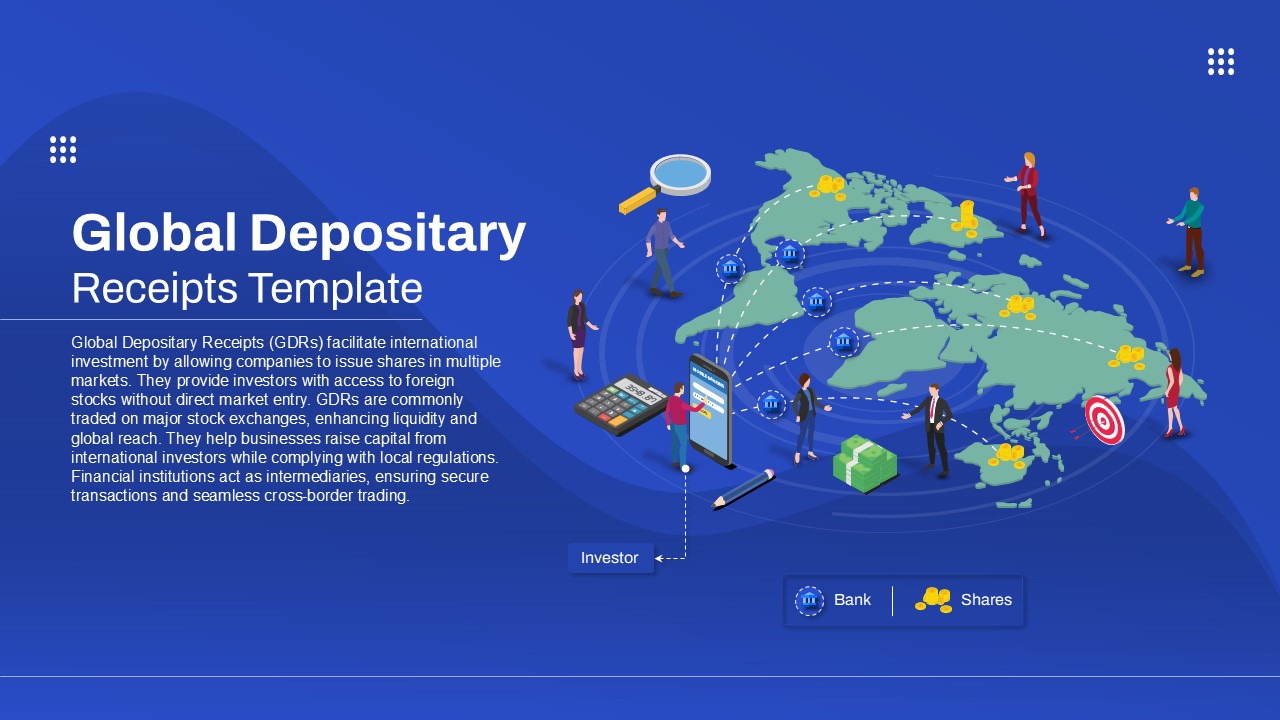
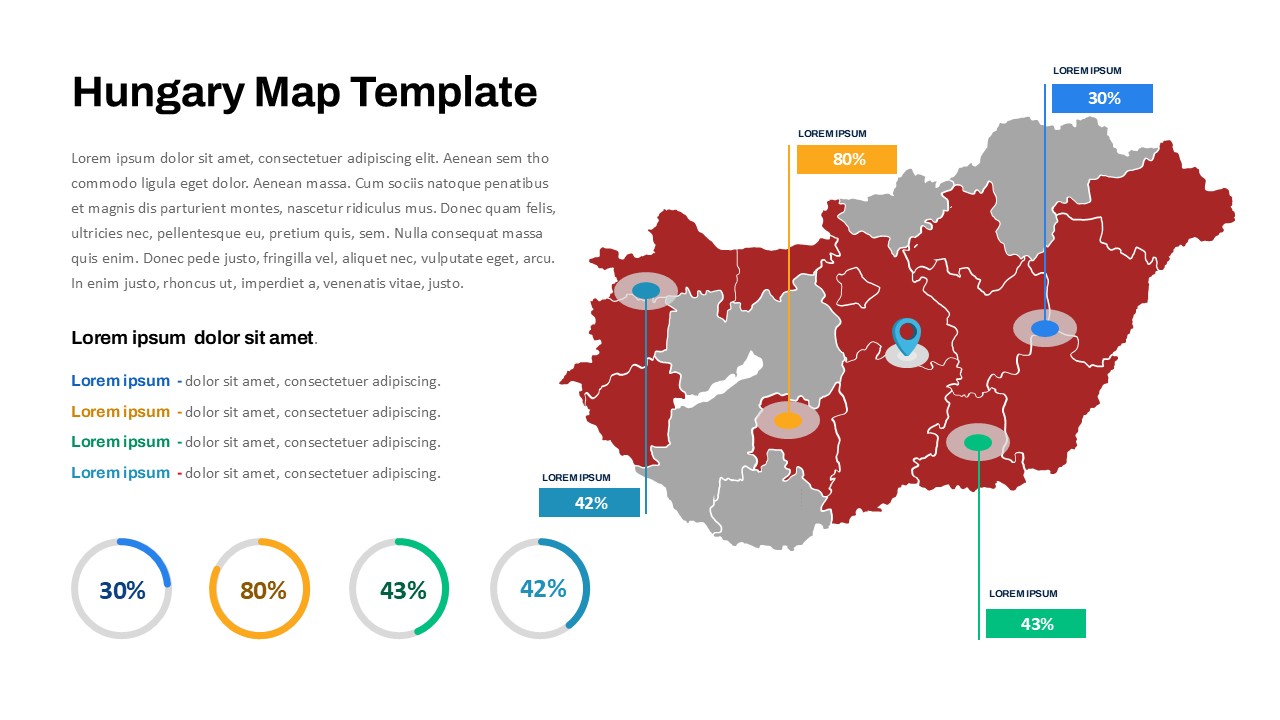
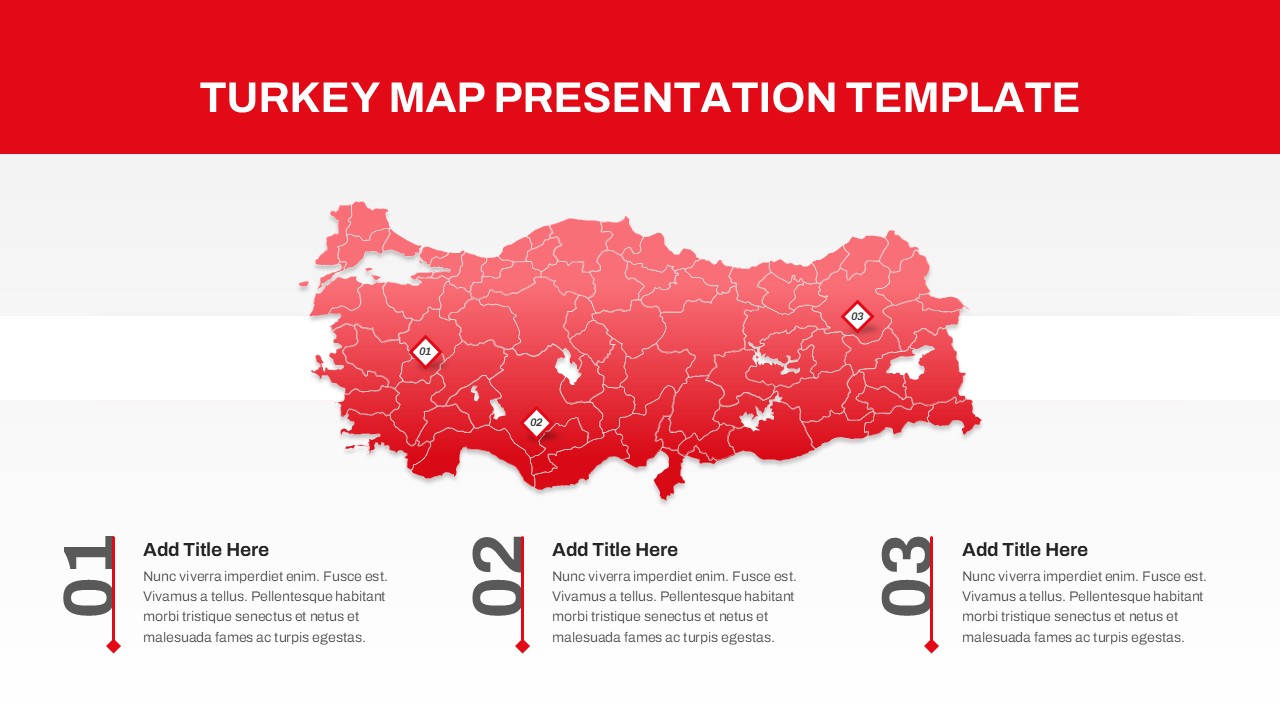
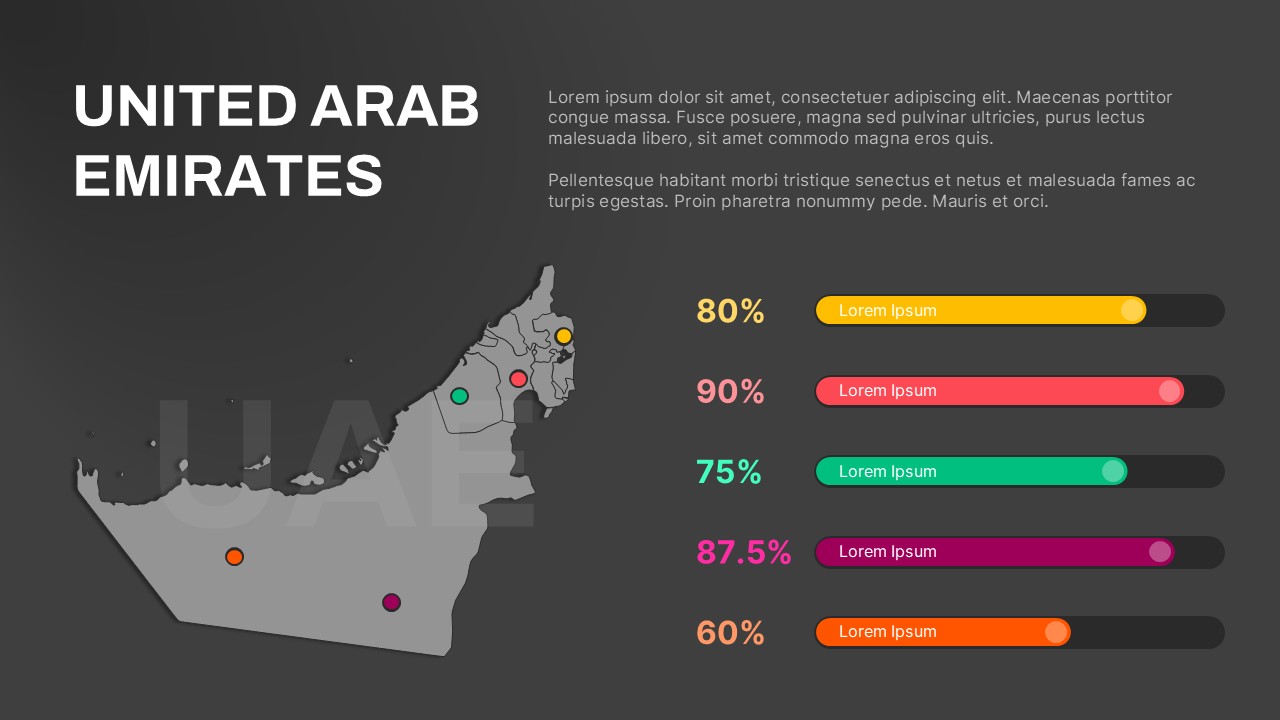
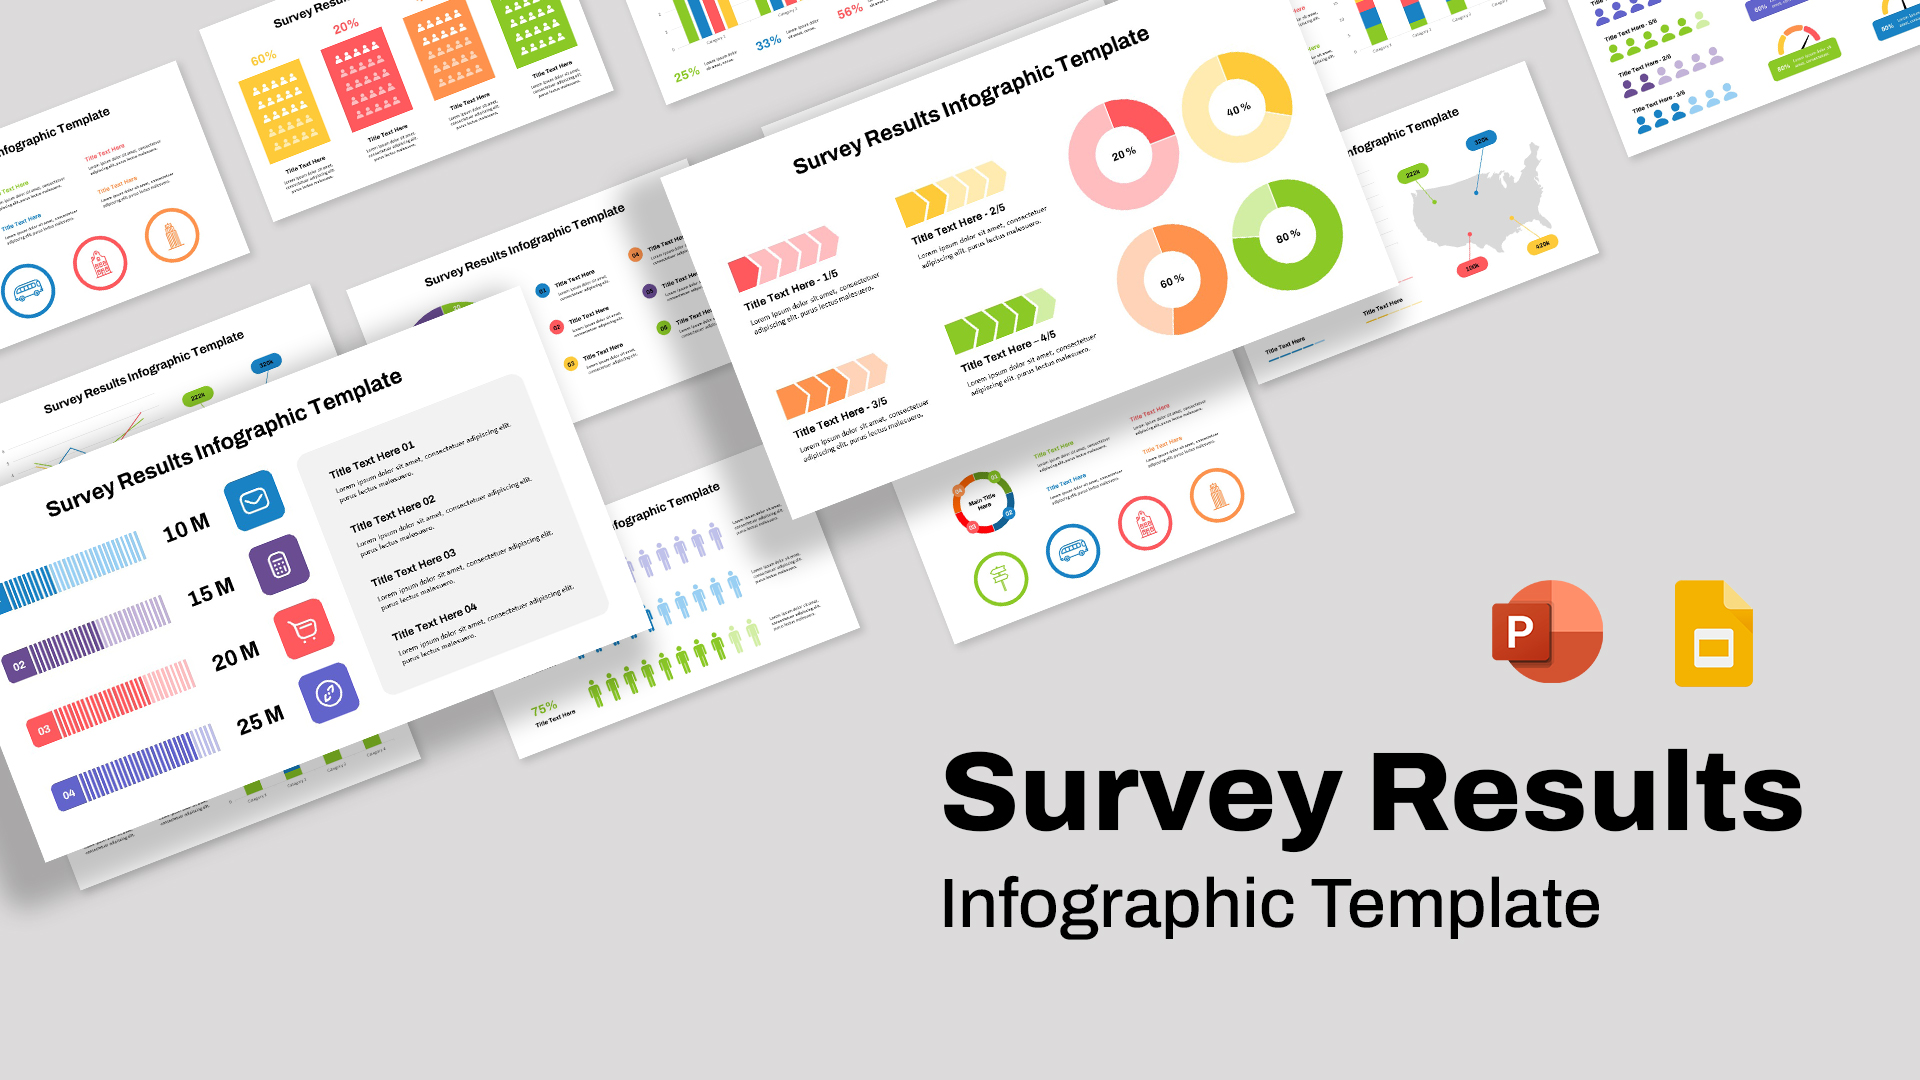
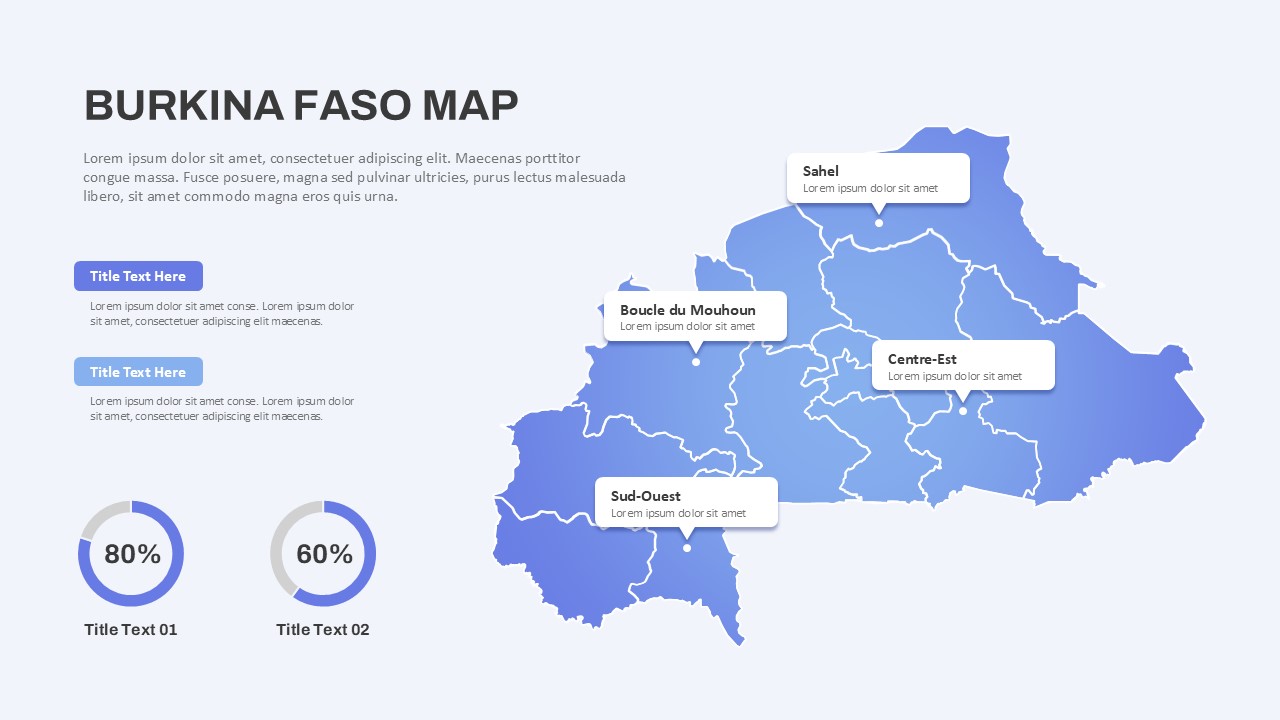
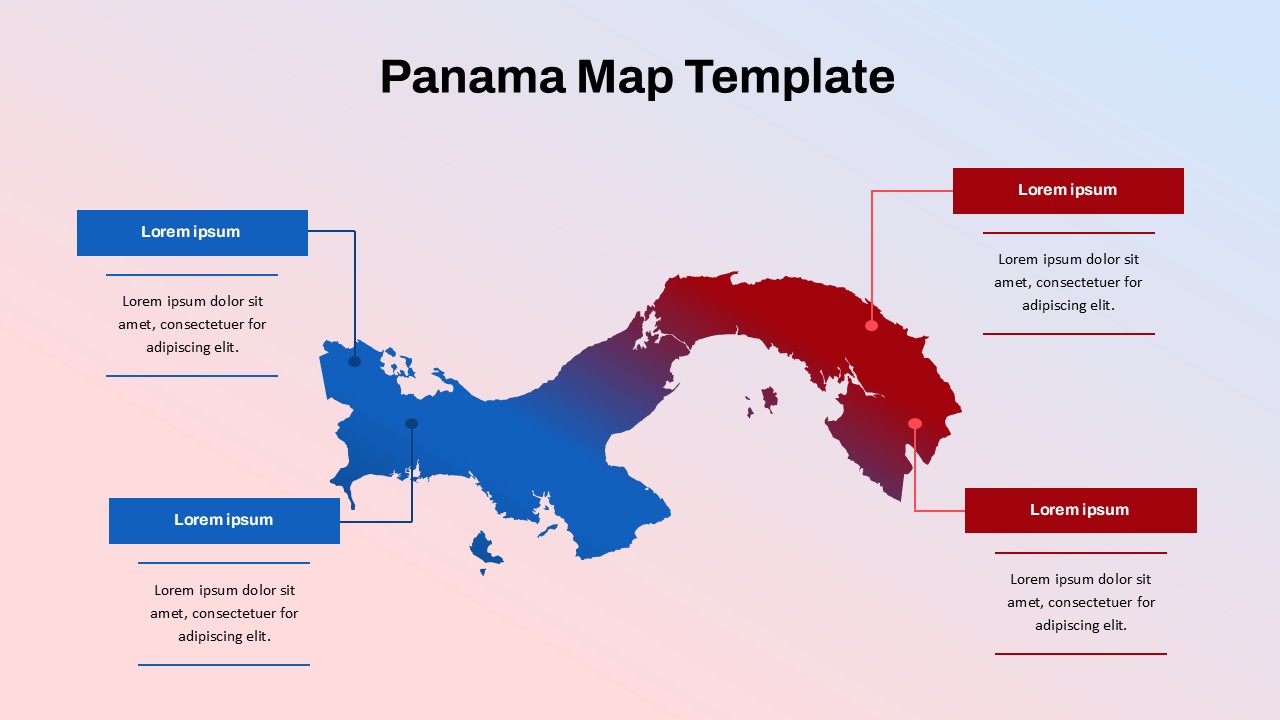
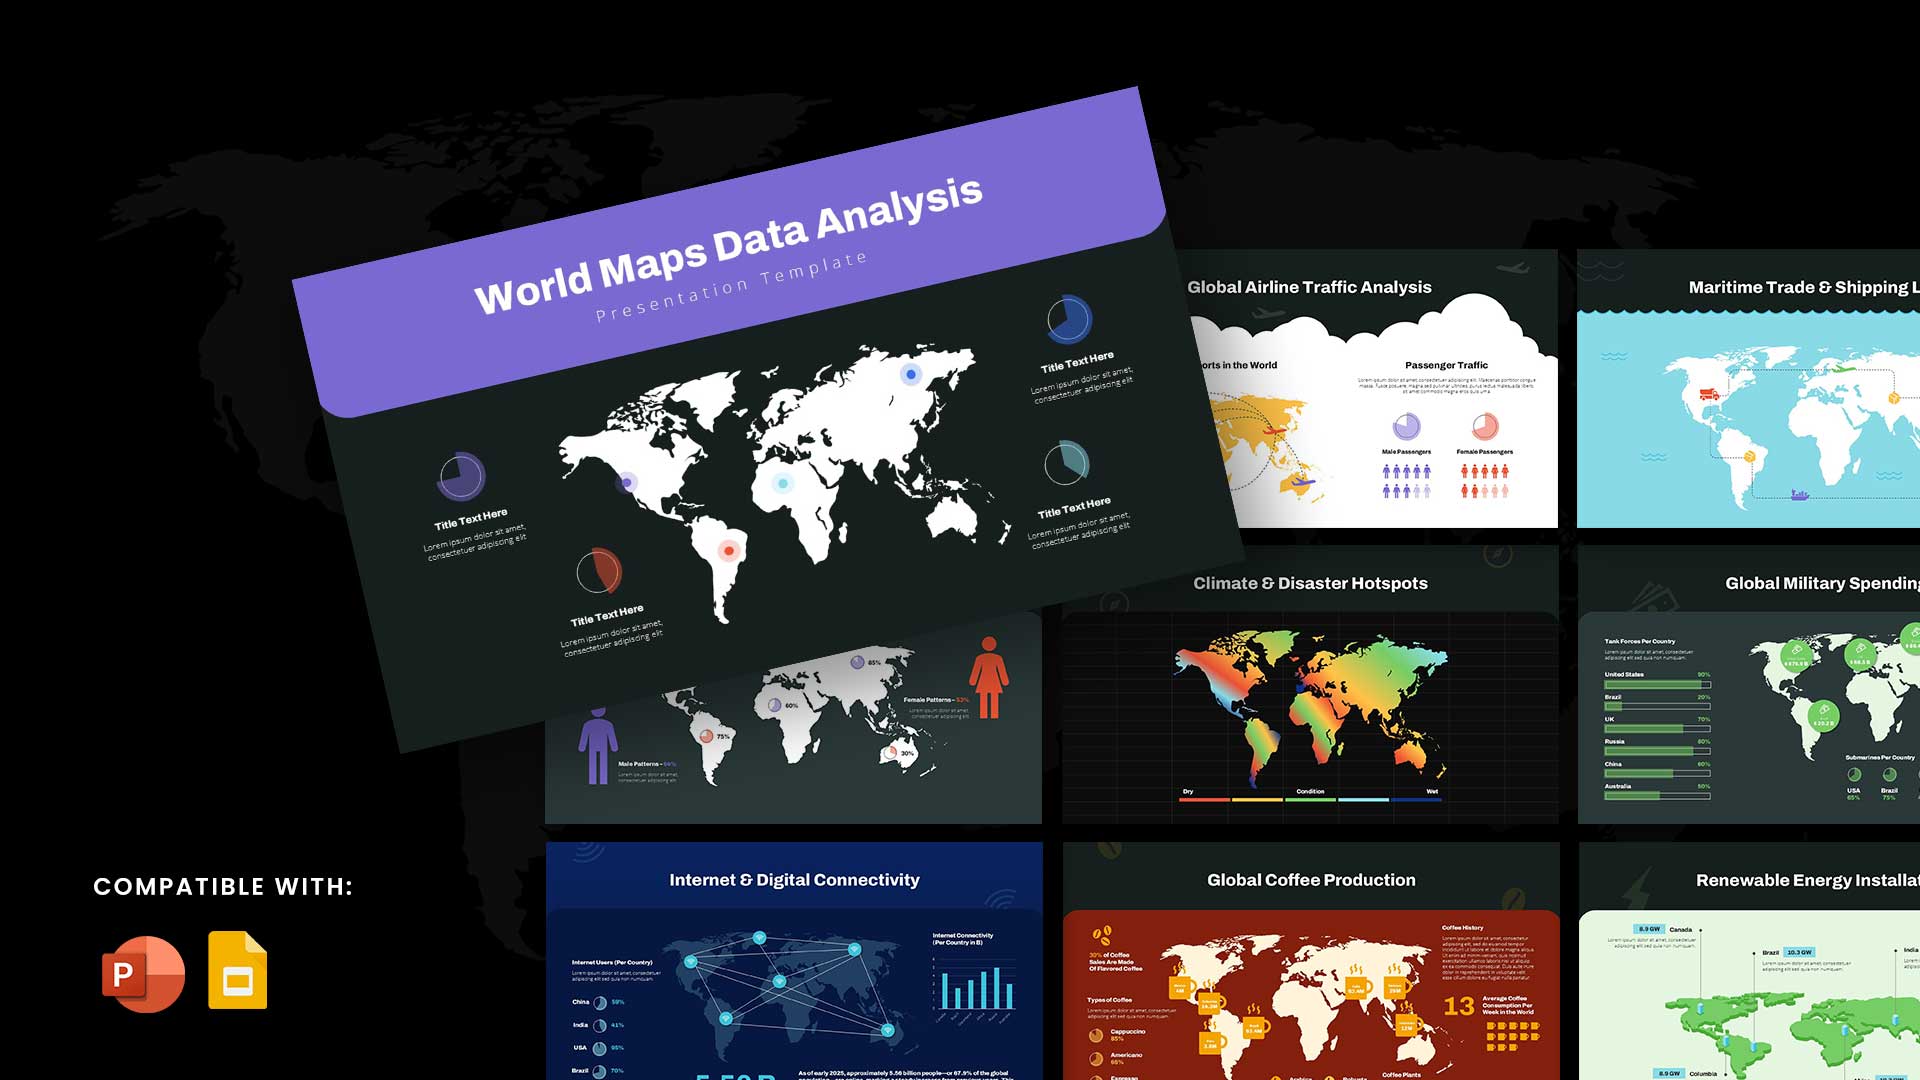
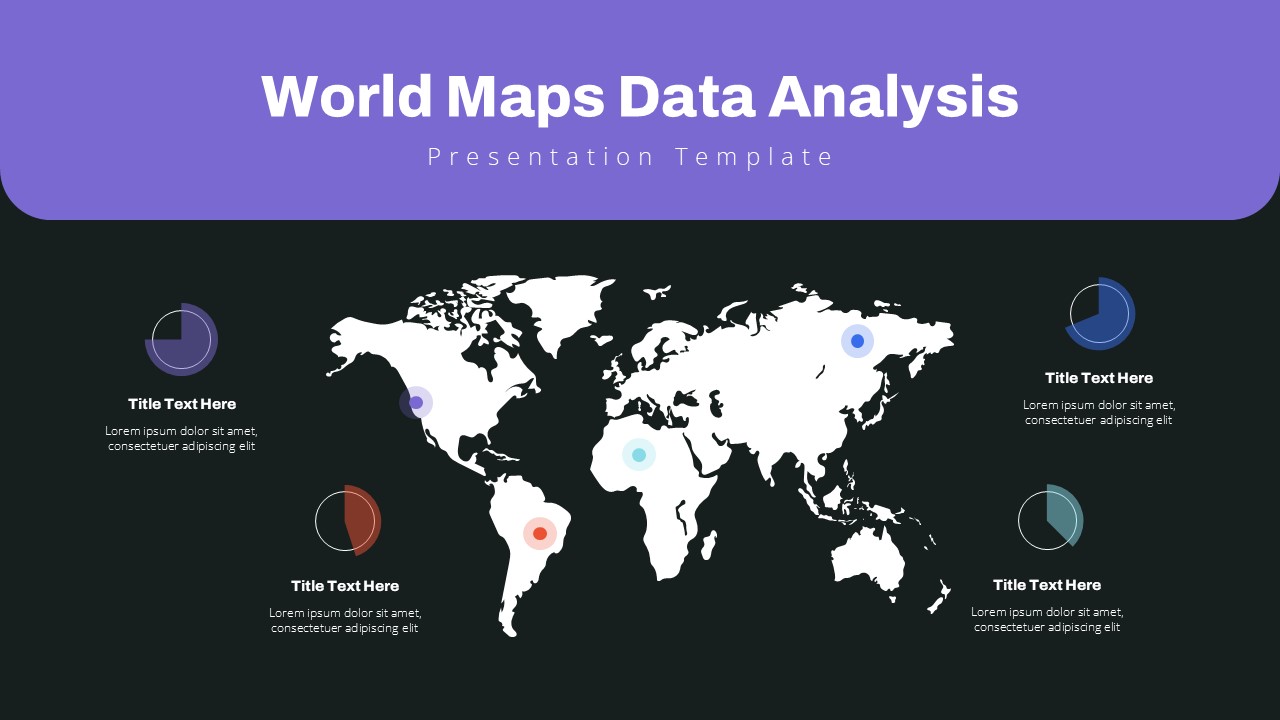
This World Map PowerPoint presentation is a visually engaging slide deck designed for professionals and educators who need to communicate global data. Featuring world maps for PPT in a variety of color combinations, the slides are crafted to capture audience attention and present information with clarity and style.
What does world map slide look like?
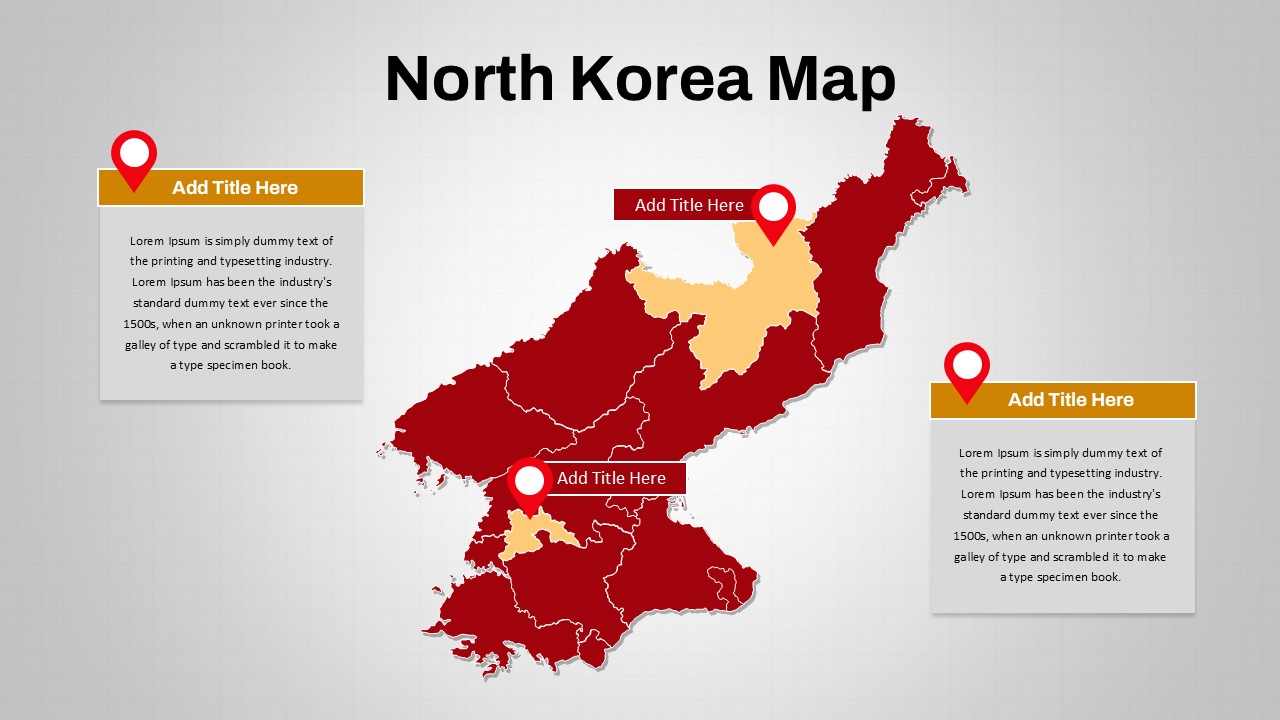
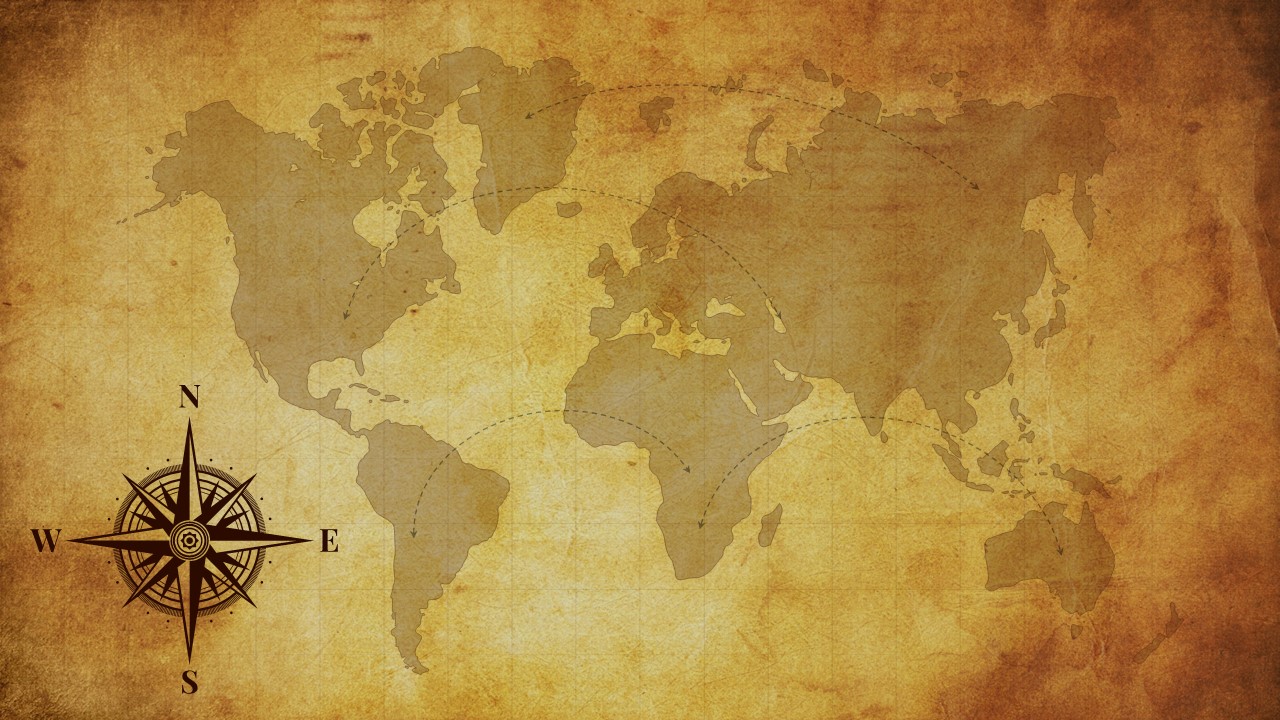
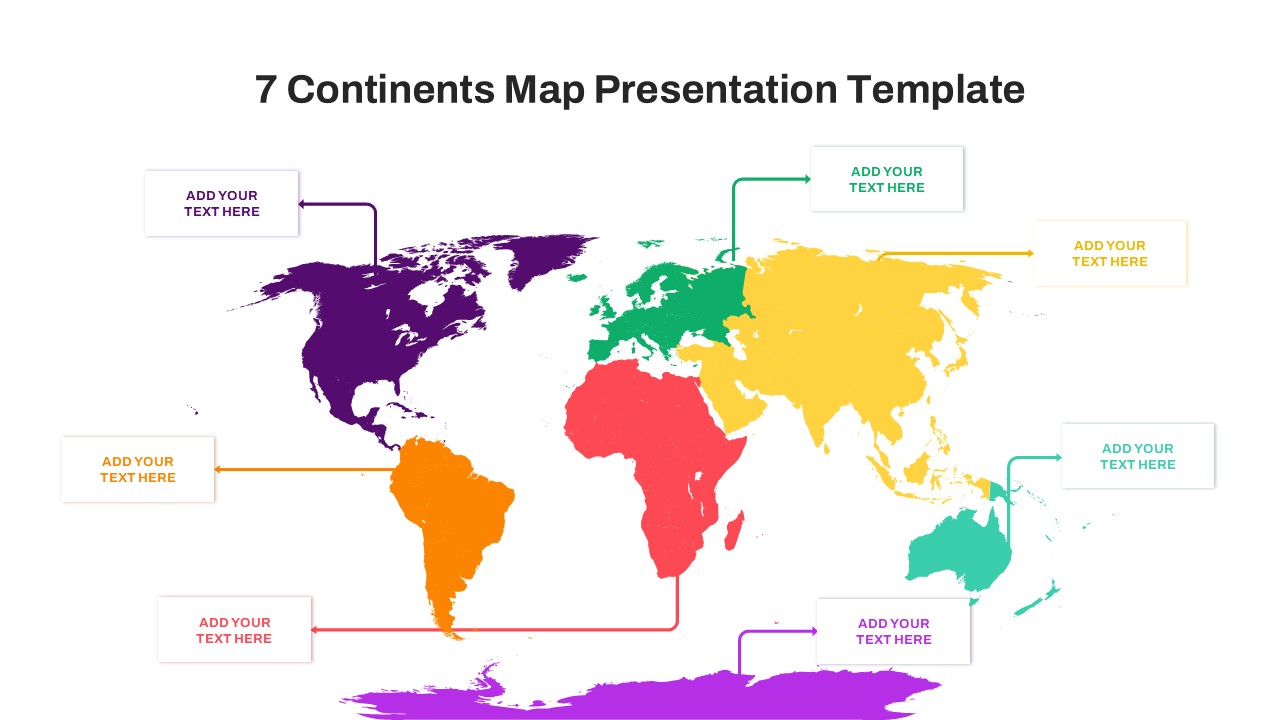
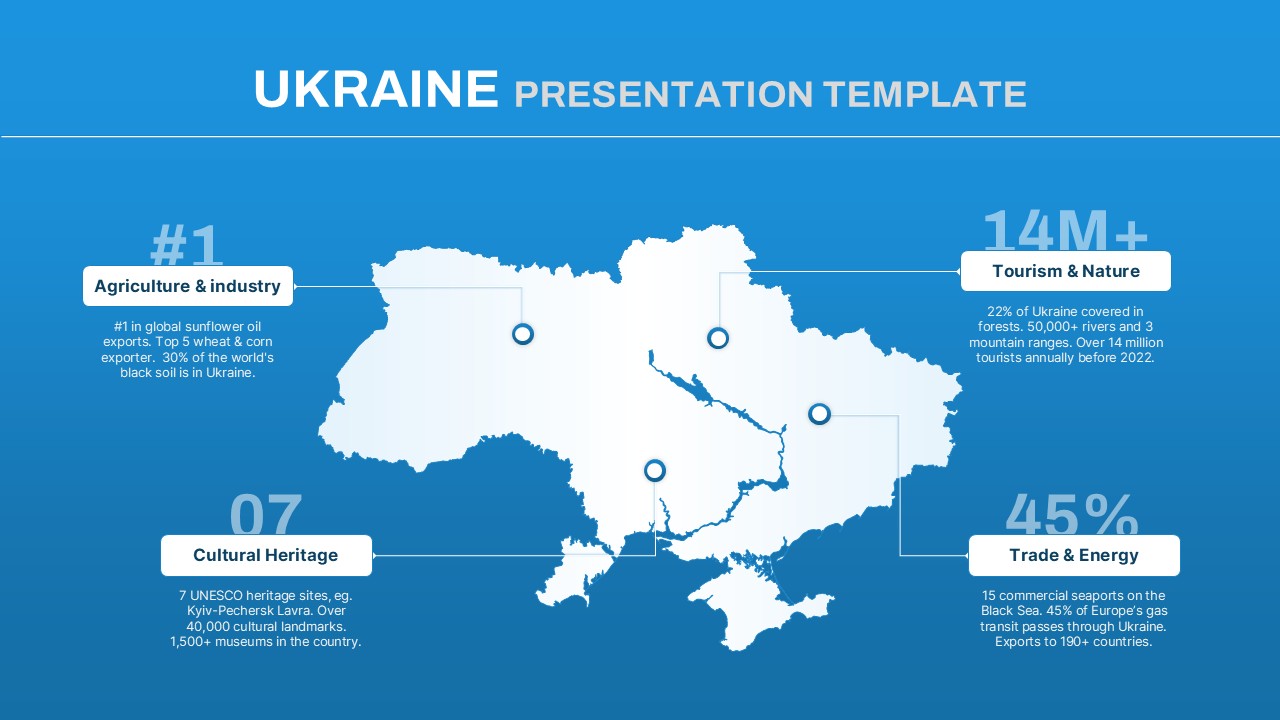
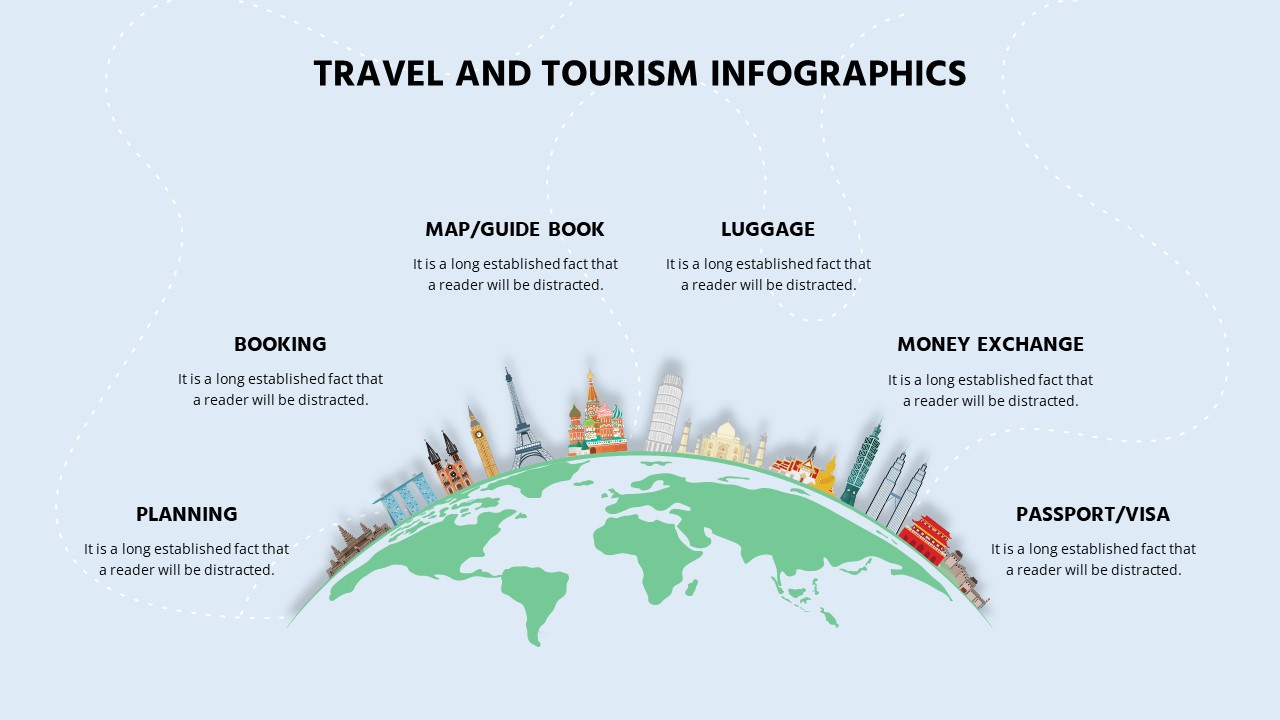
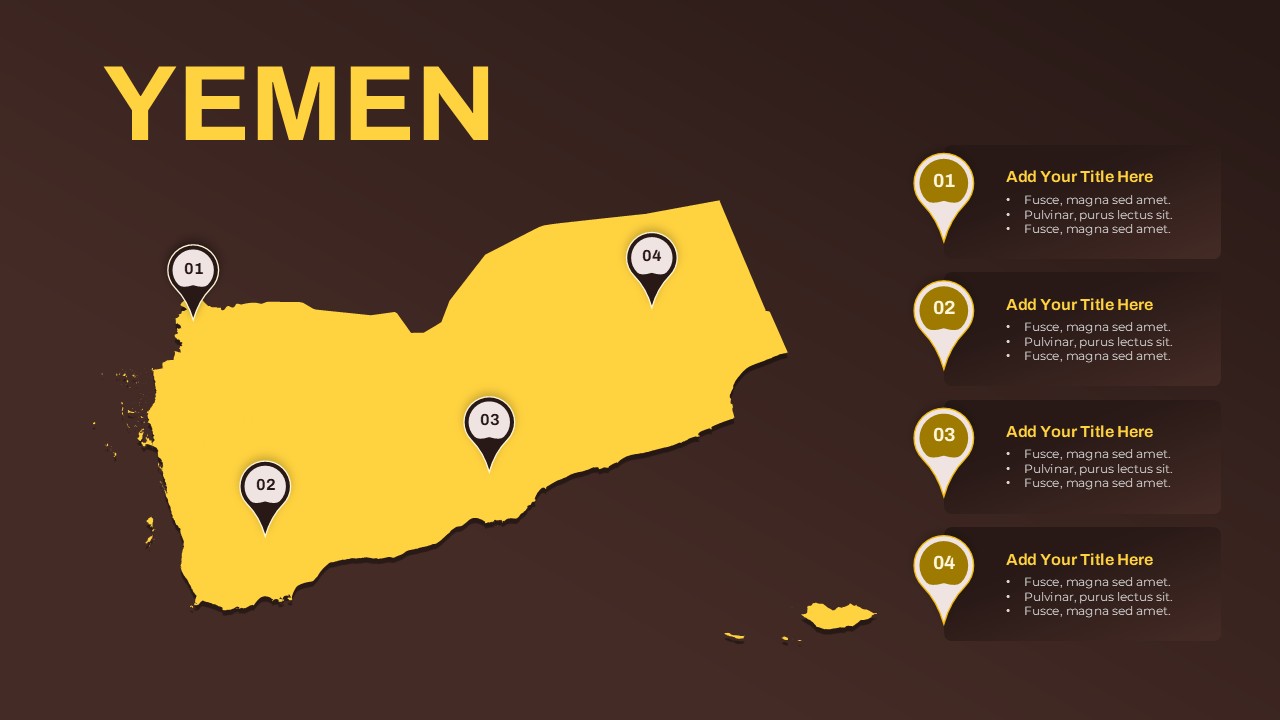
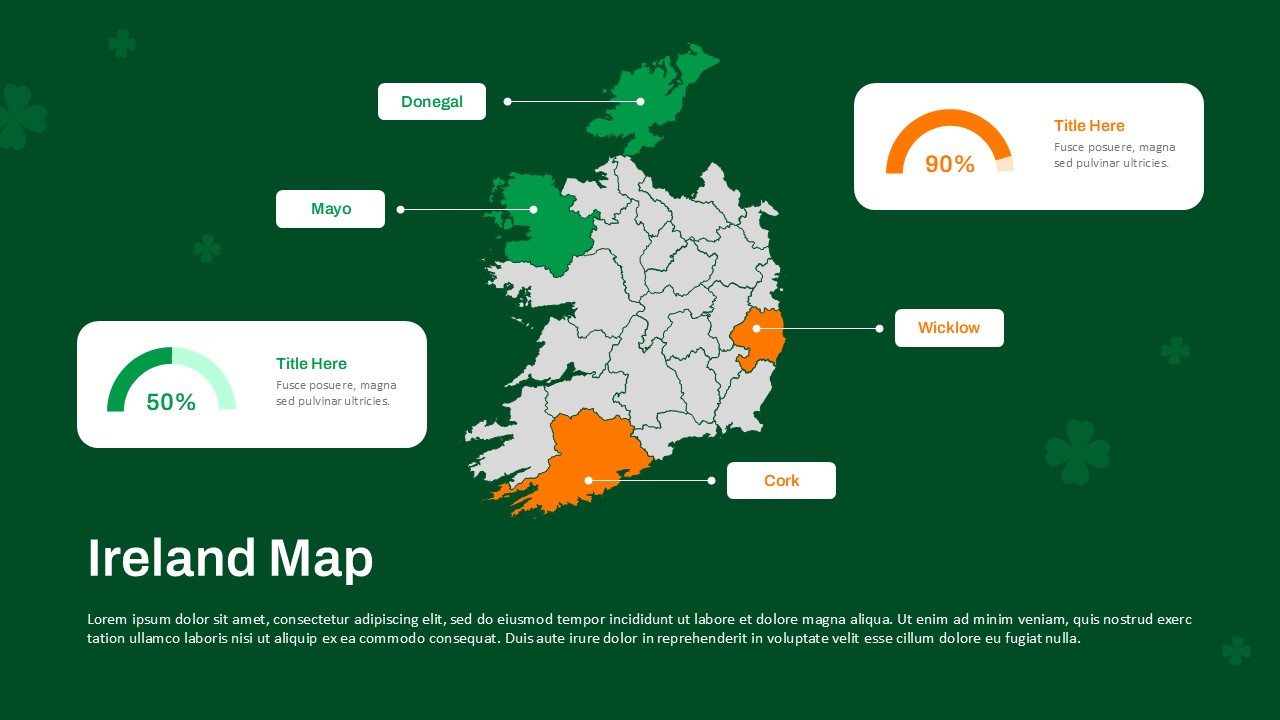
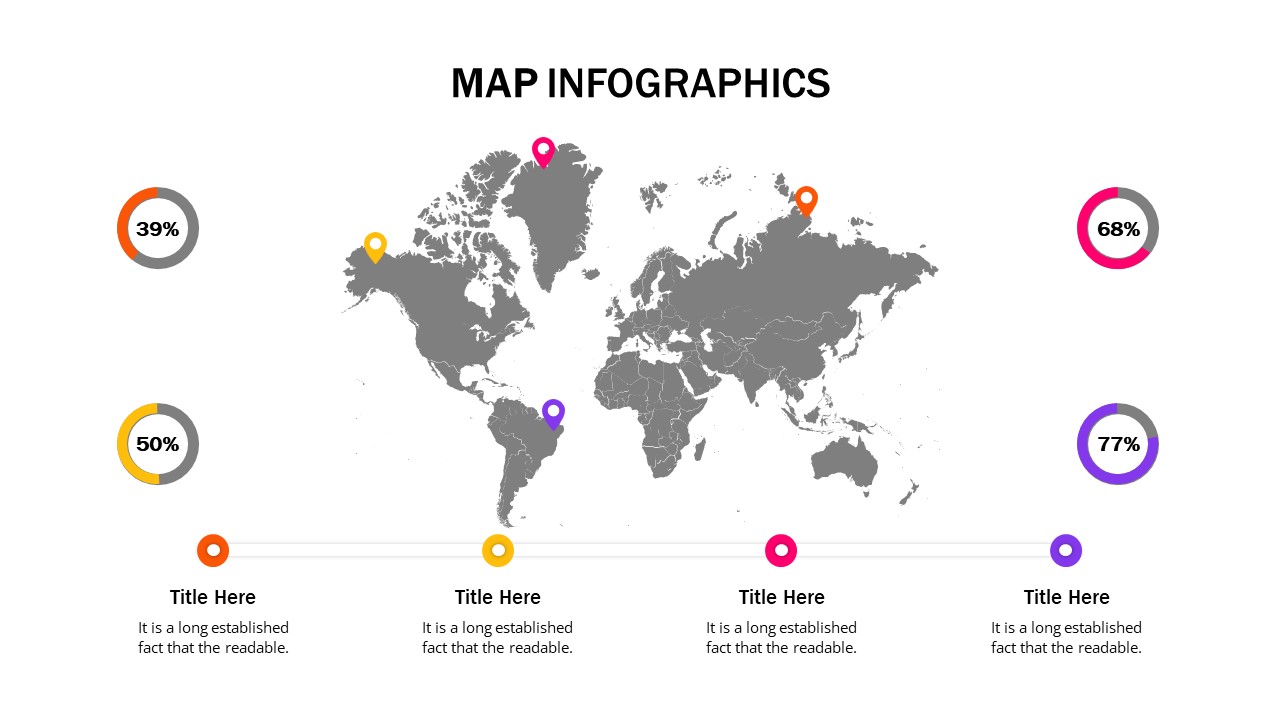
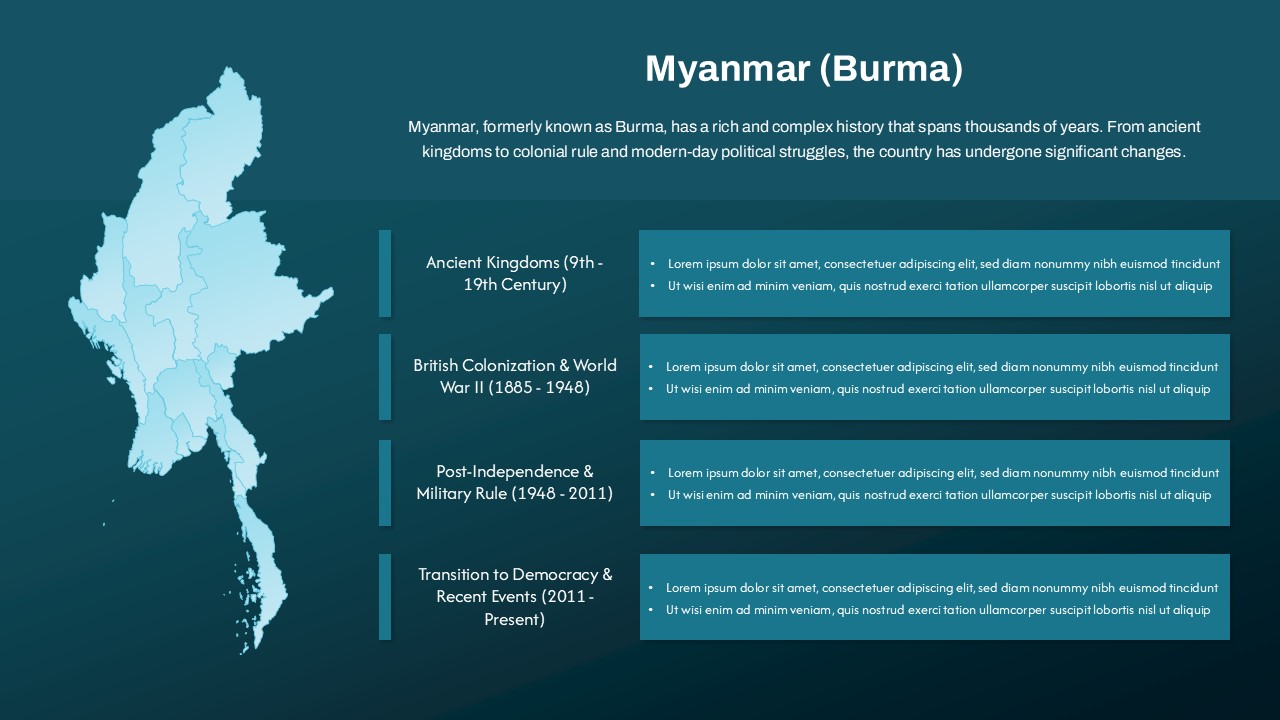
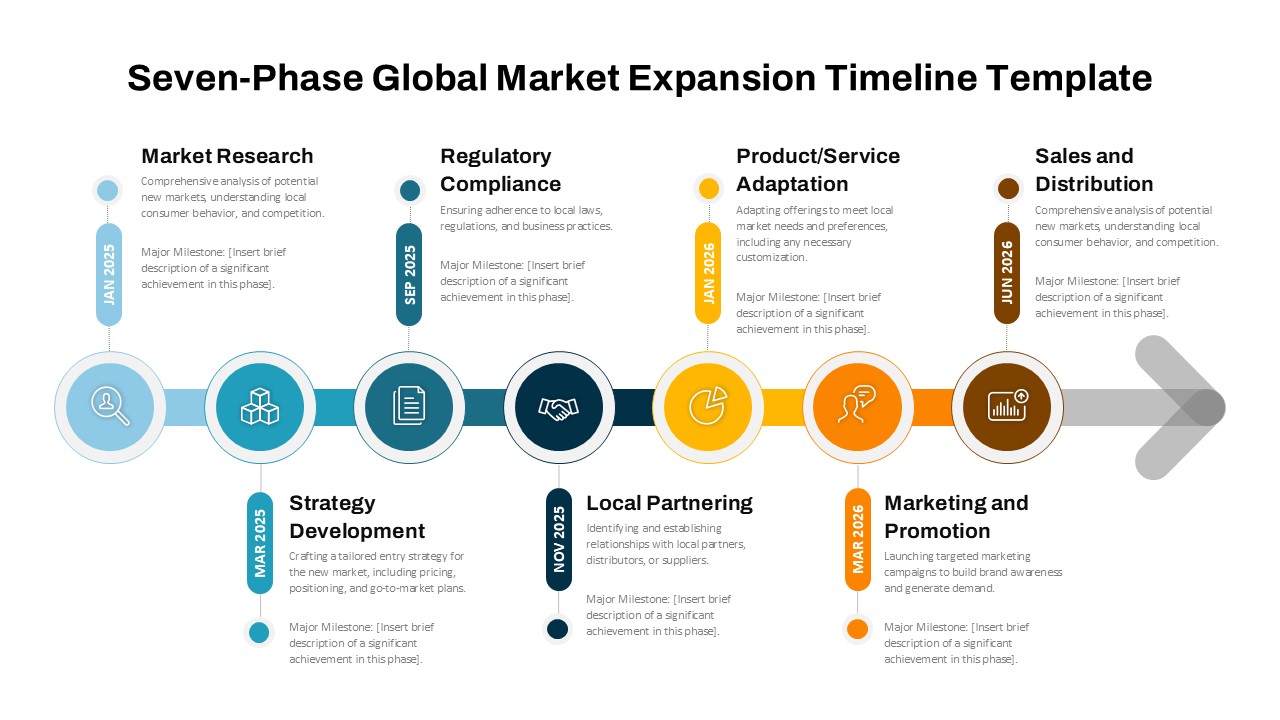
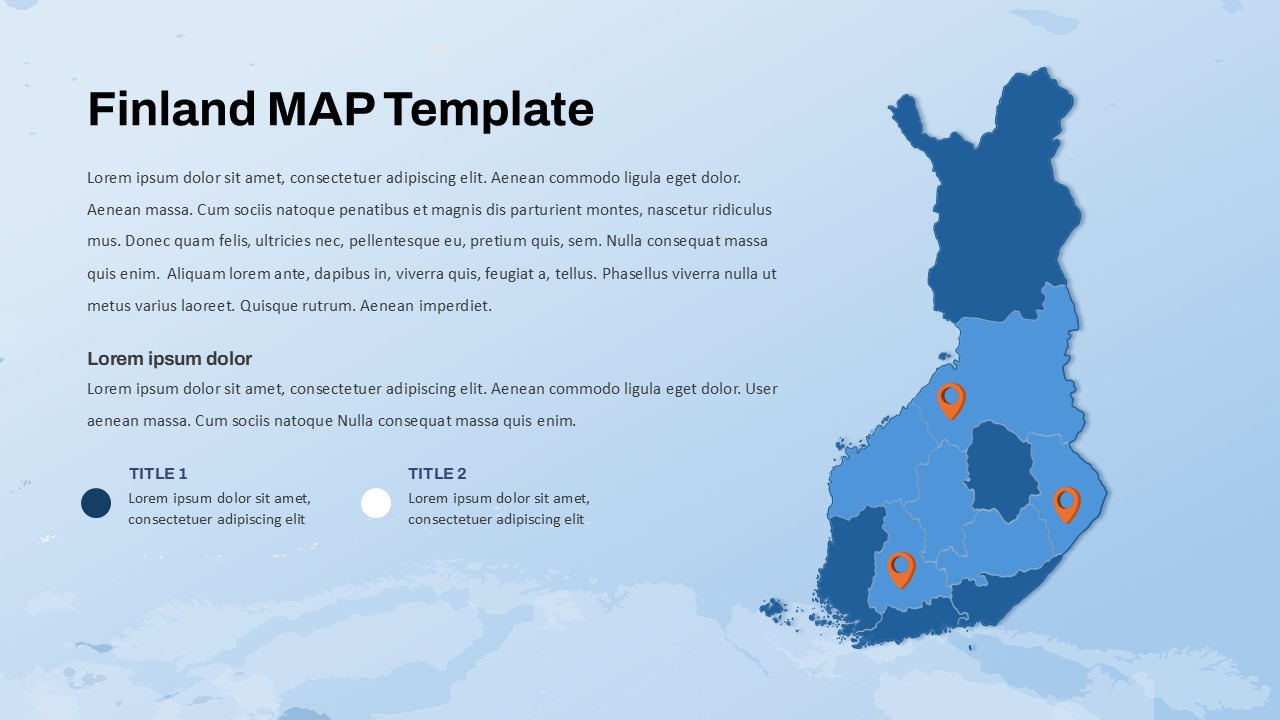
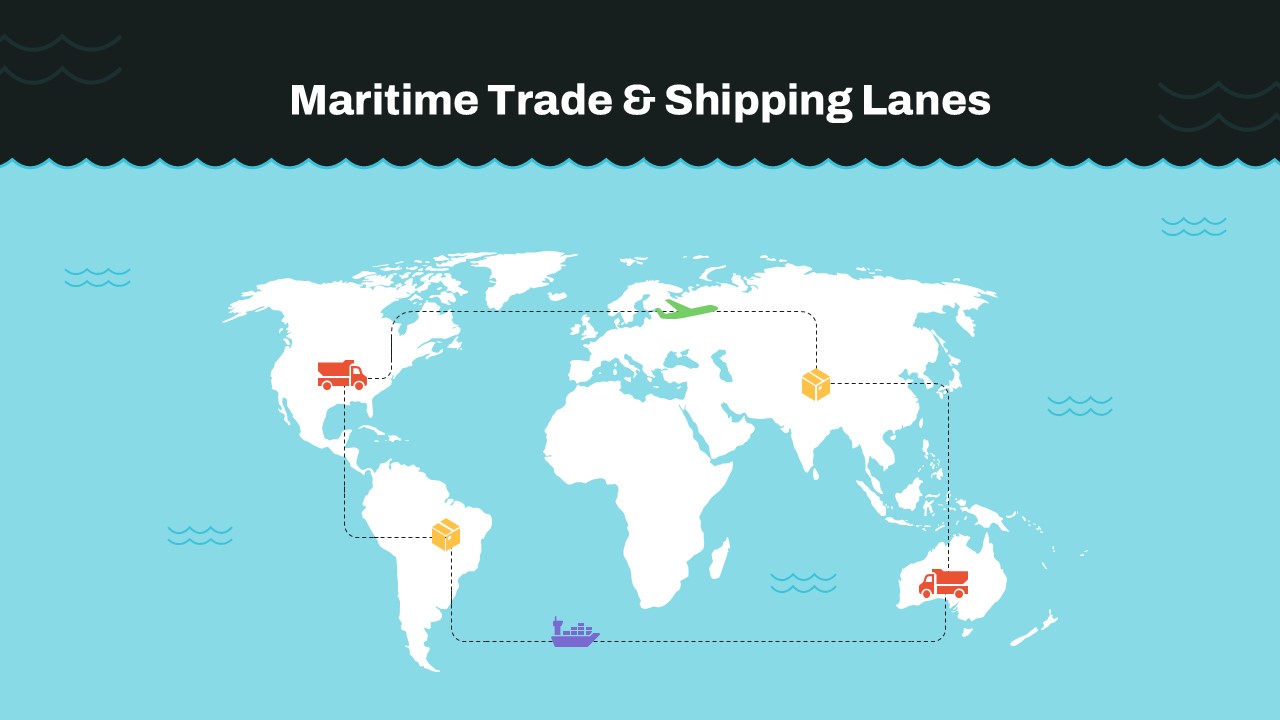
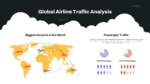
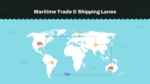
Whether you’re conducting a market expansion meeting or an academic lecture on global trends, this deck helps you pinpoint “what is where” with precision. The slide set begins with a title slide that includes a world map backdrop to set a global tone. The Global Airline Traffic Analysis slide offers a thematic overview of the busiest airports and passenger movements worldwide. Maritime Trade and Shipping Lanes uses illustrative maps to highlight logistic hubs and routes.
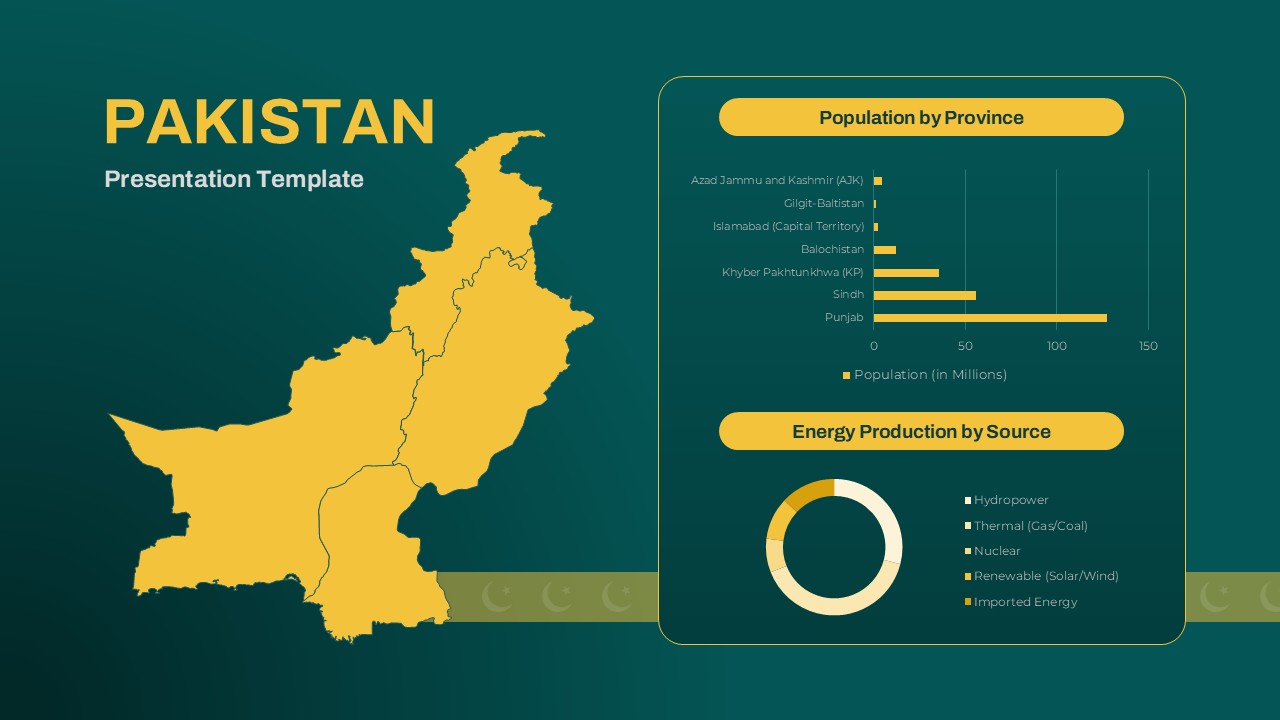
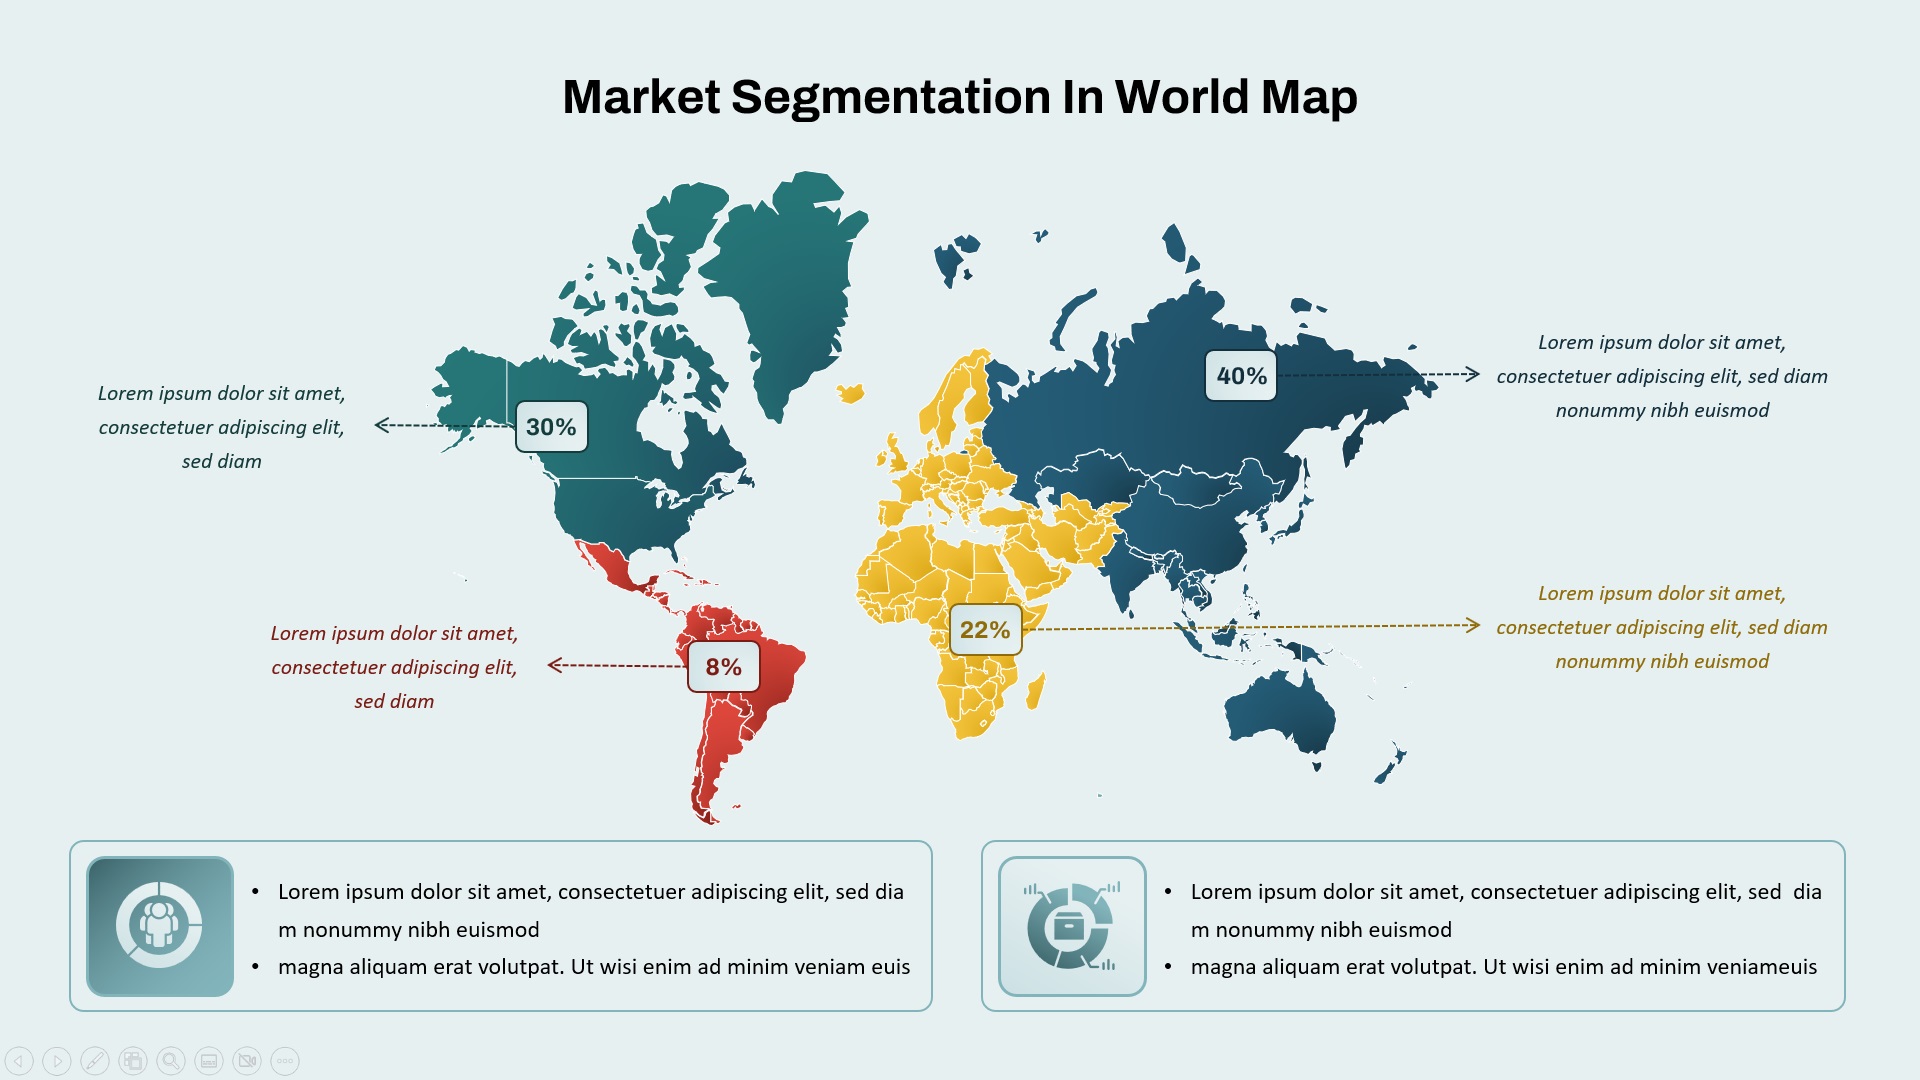
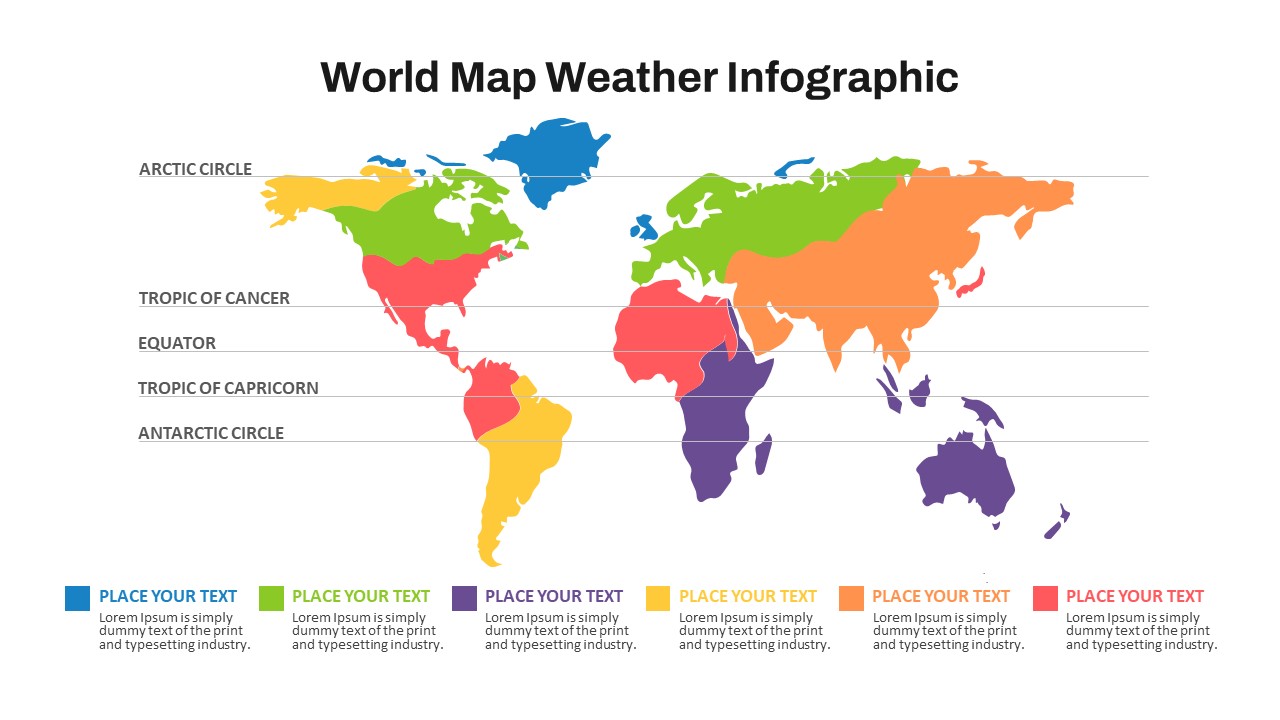
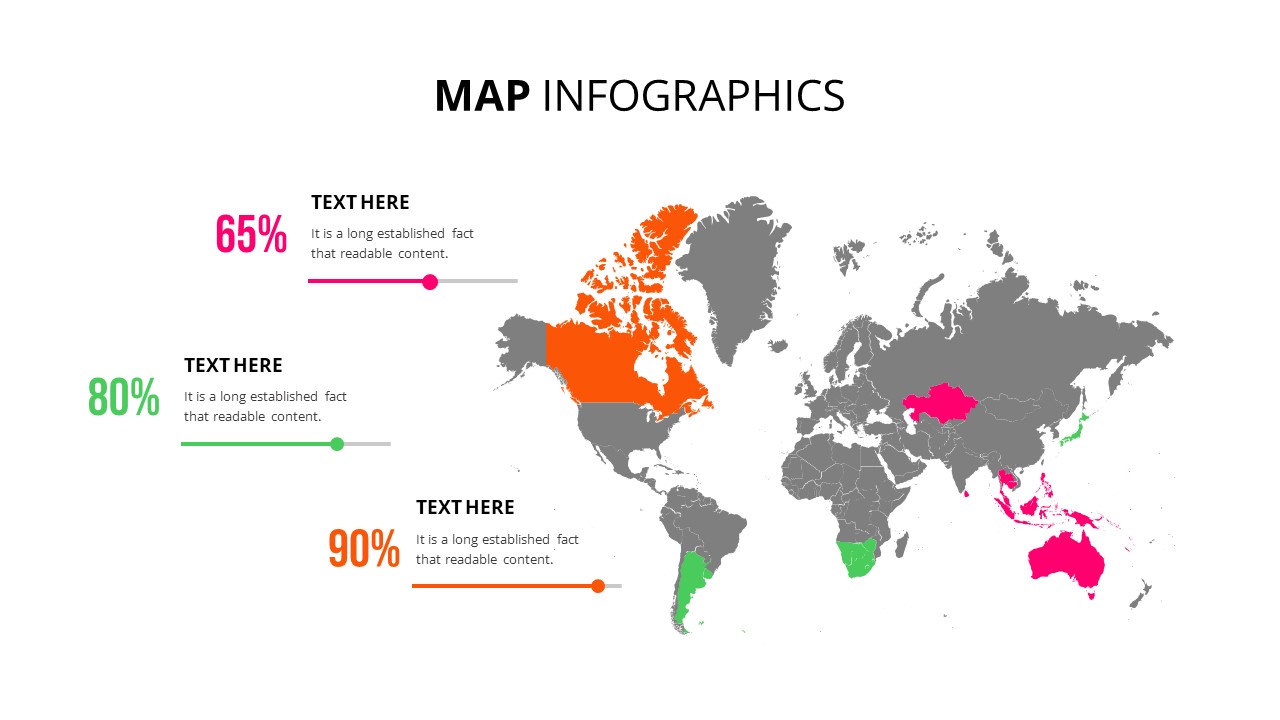
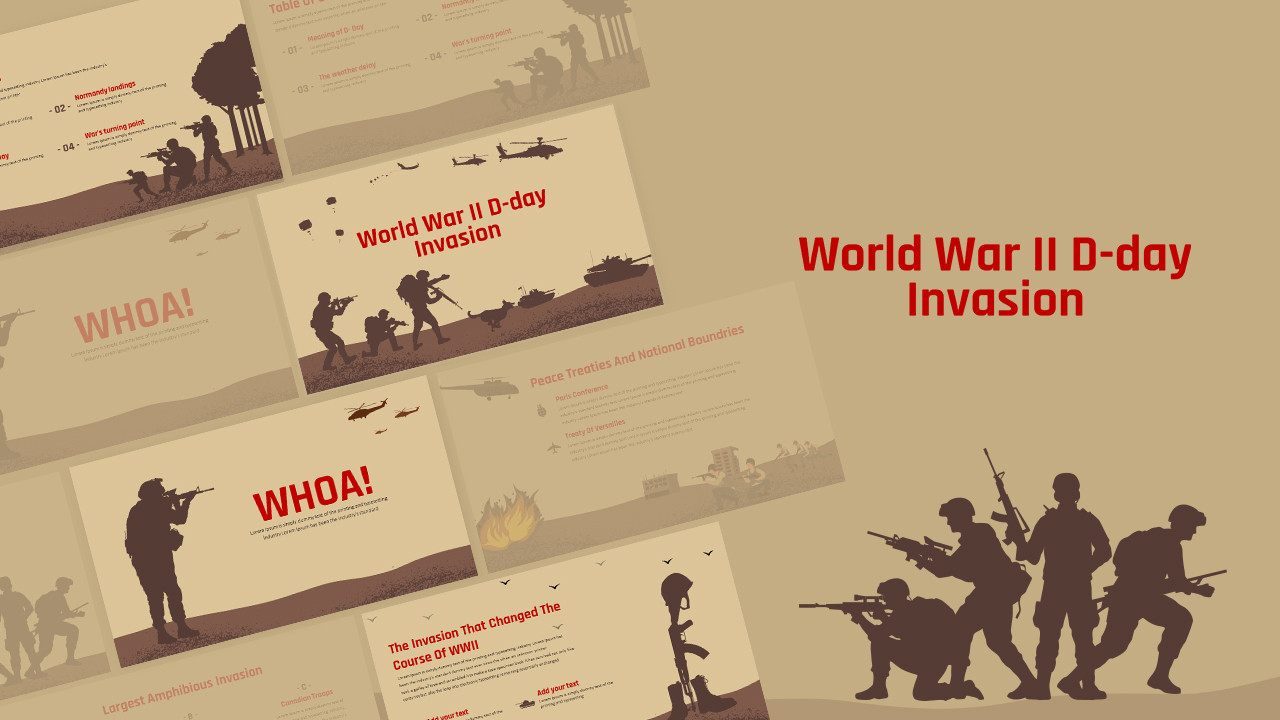
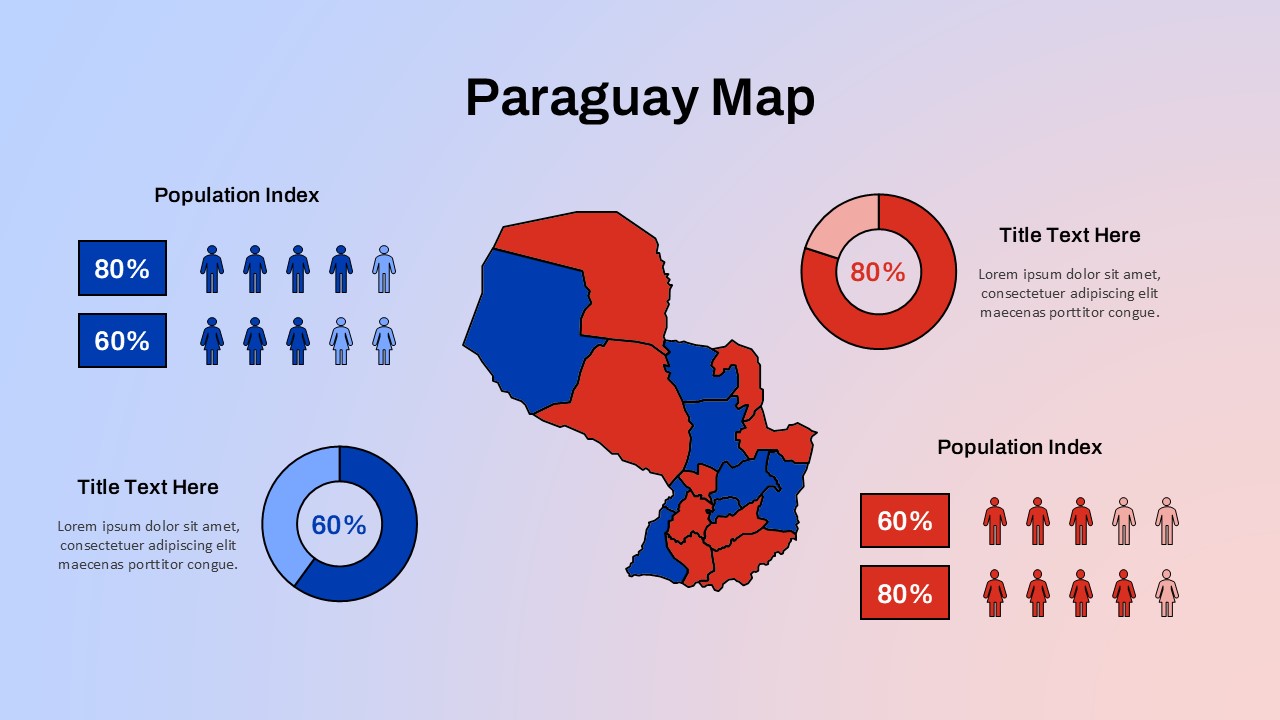
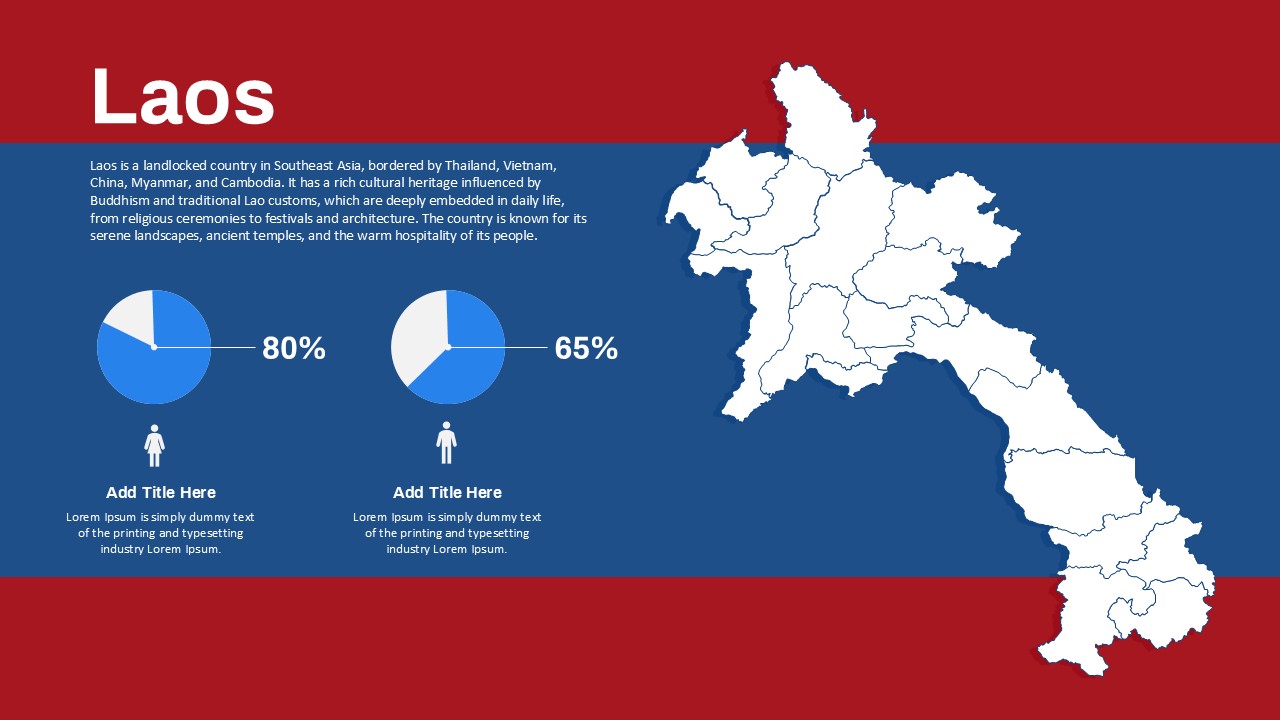
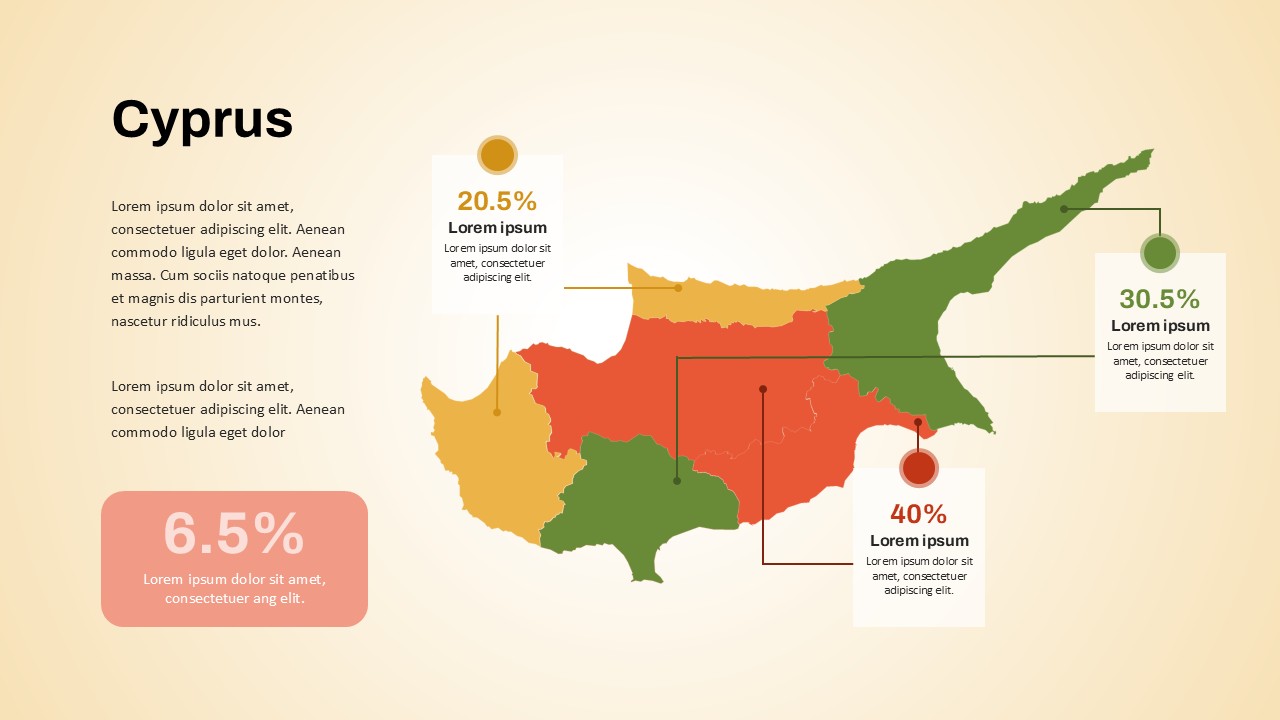
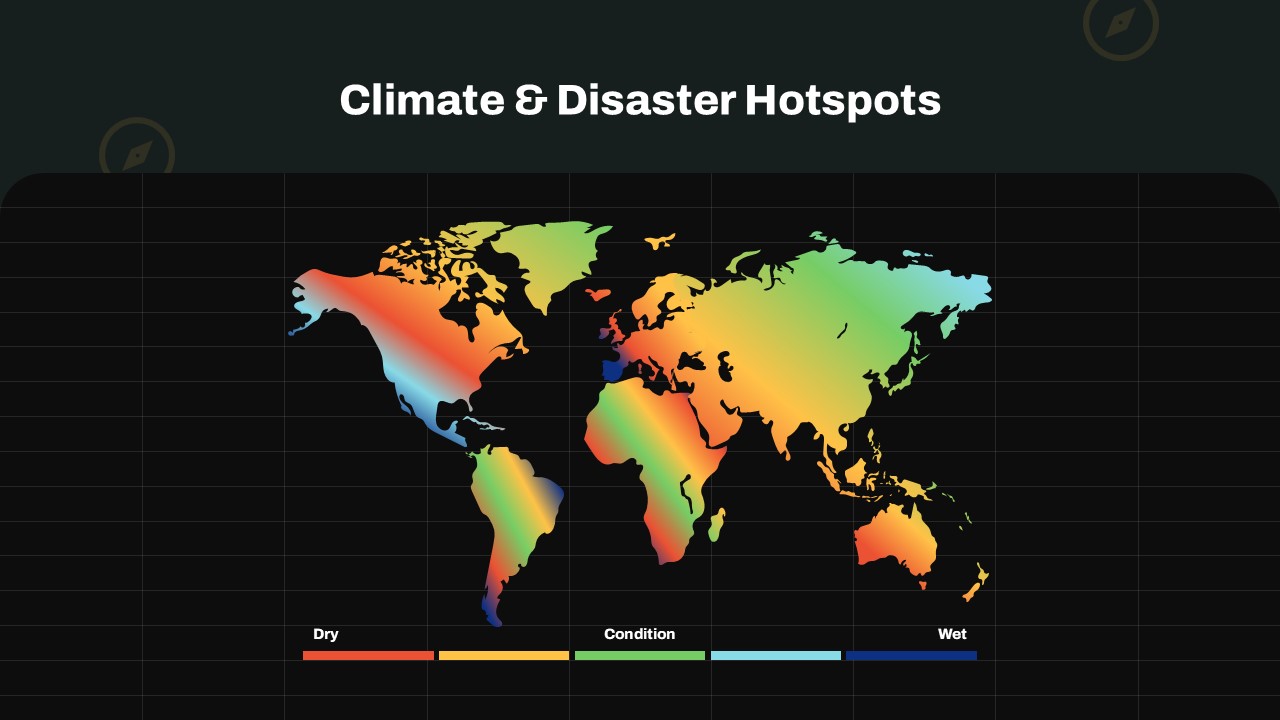
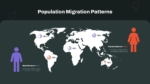
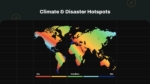
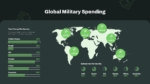
For researchers and analysts, the Population Migration Patterns slide shows intercontinental migration percentages, while the Climate and Disaster Hotspots slide uses gradient colors—yellow, red, green, and violet—to depict vulnerable regions. The Global Military Spending map, shaded in olive green, includes placeholders for strategic data input.
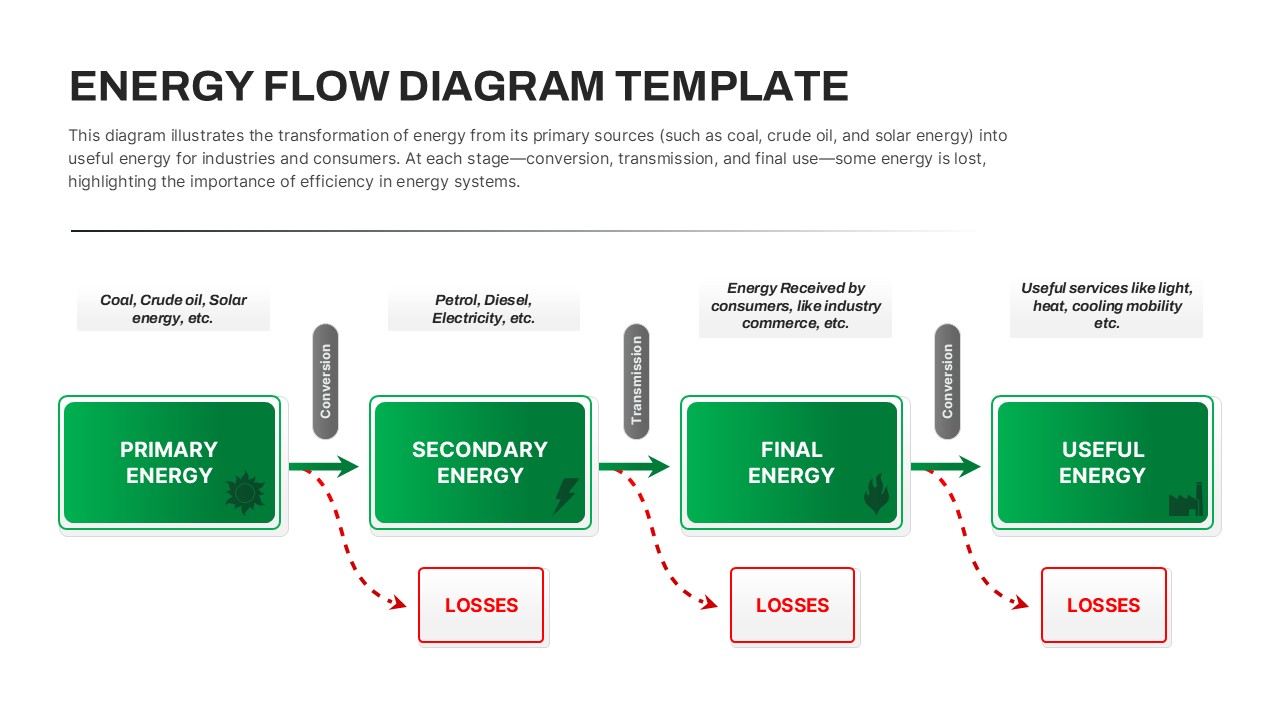
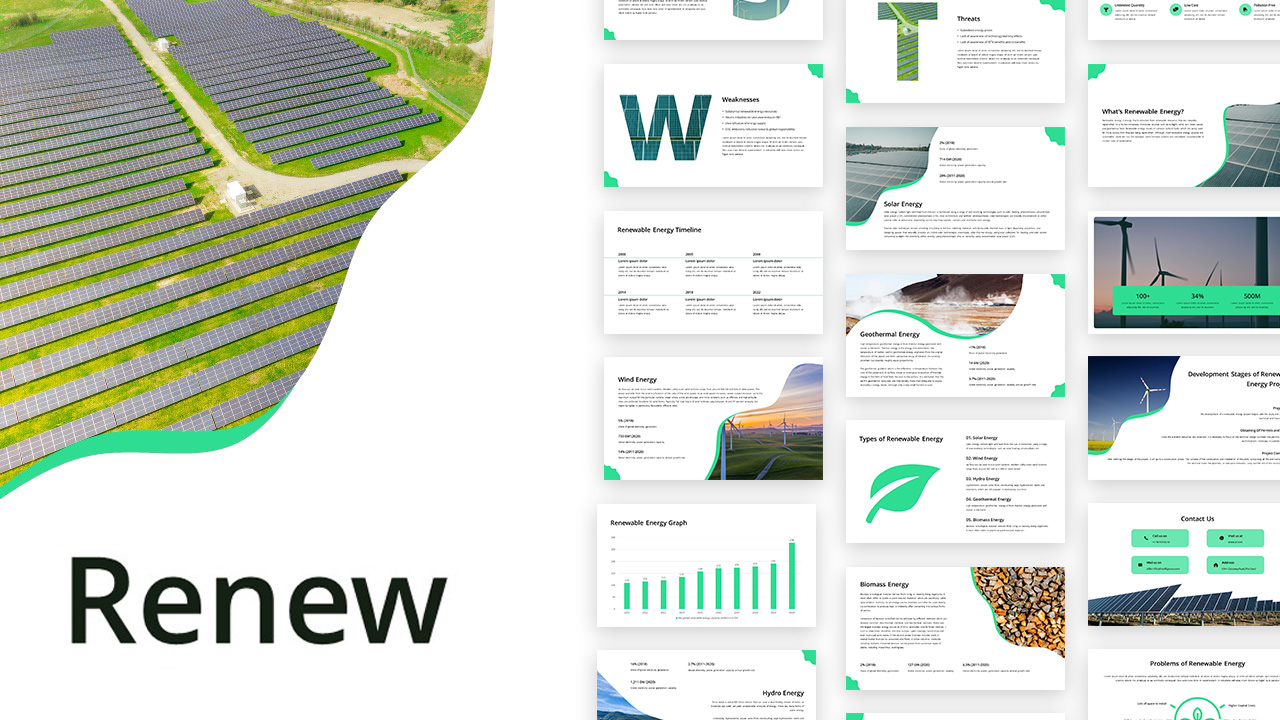
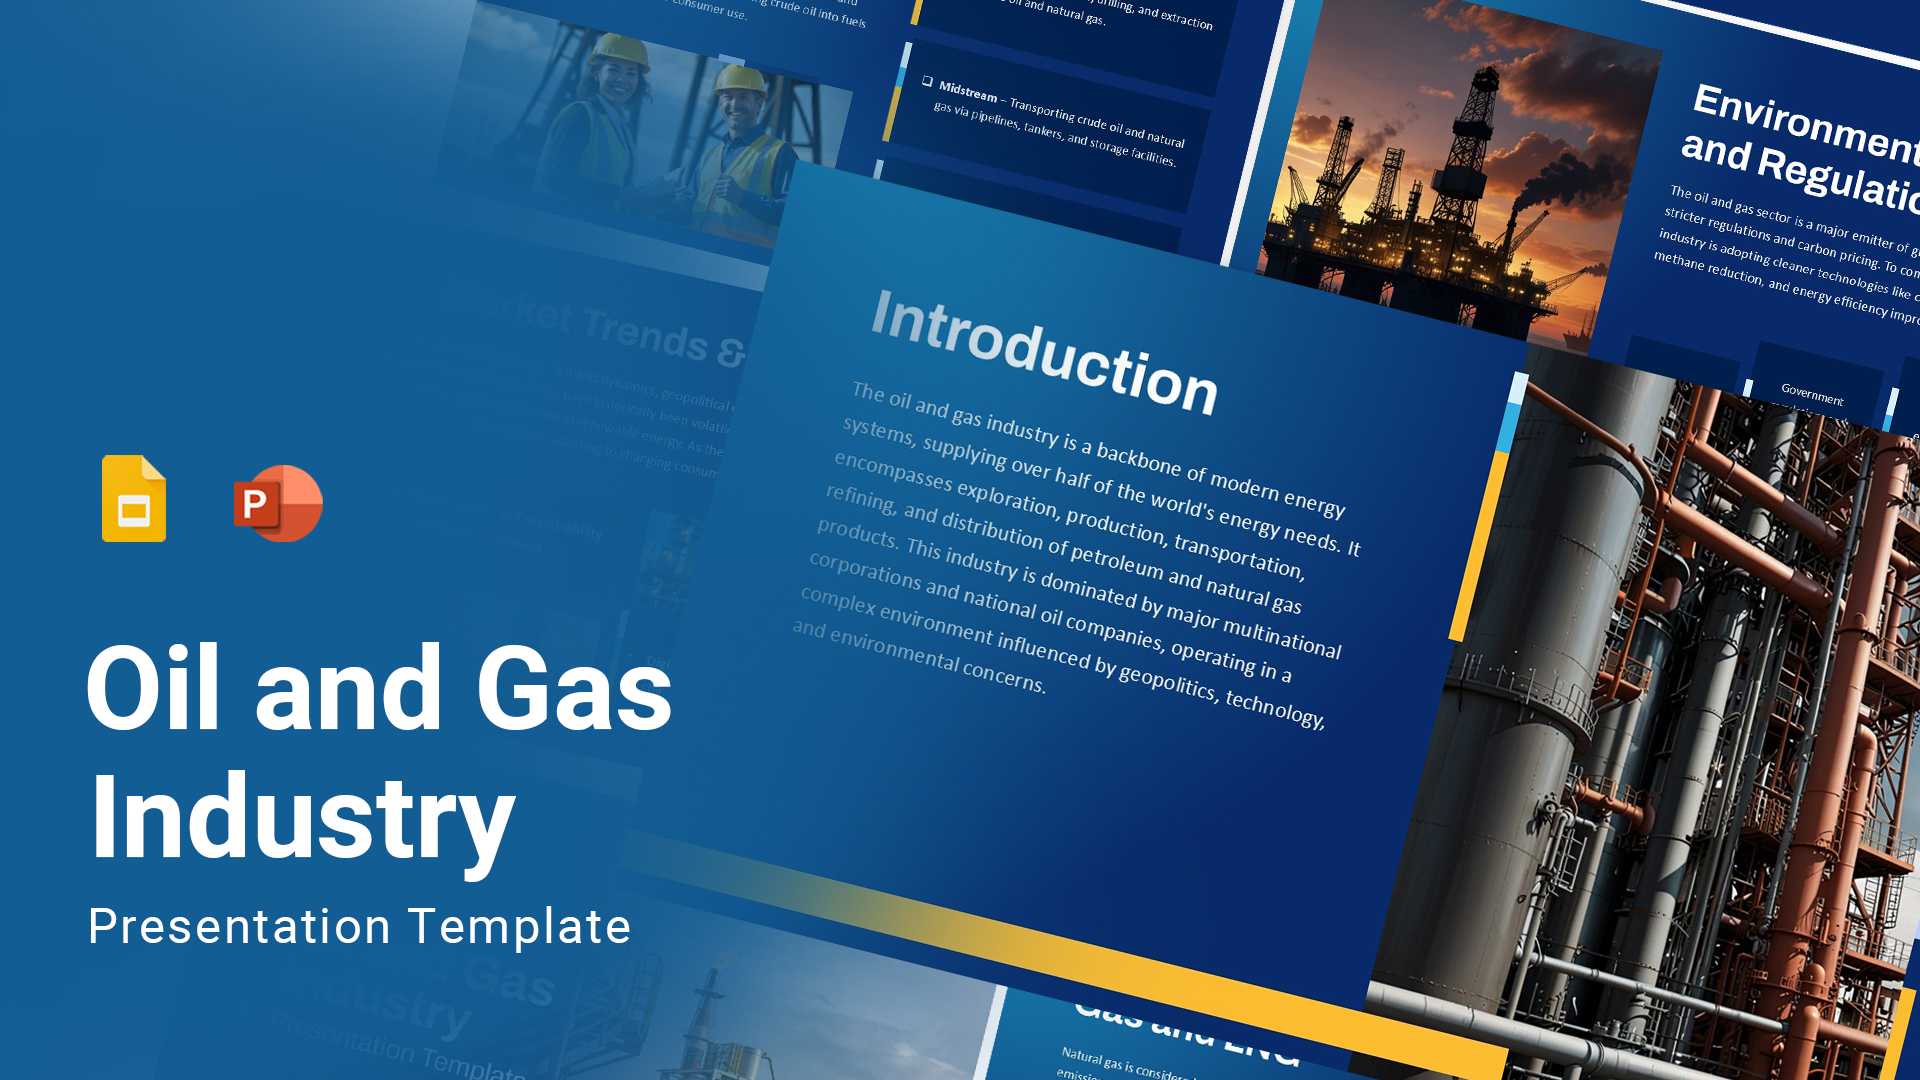
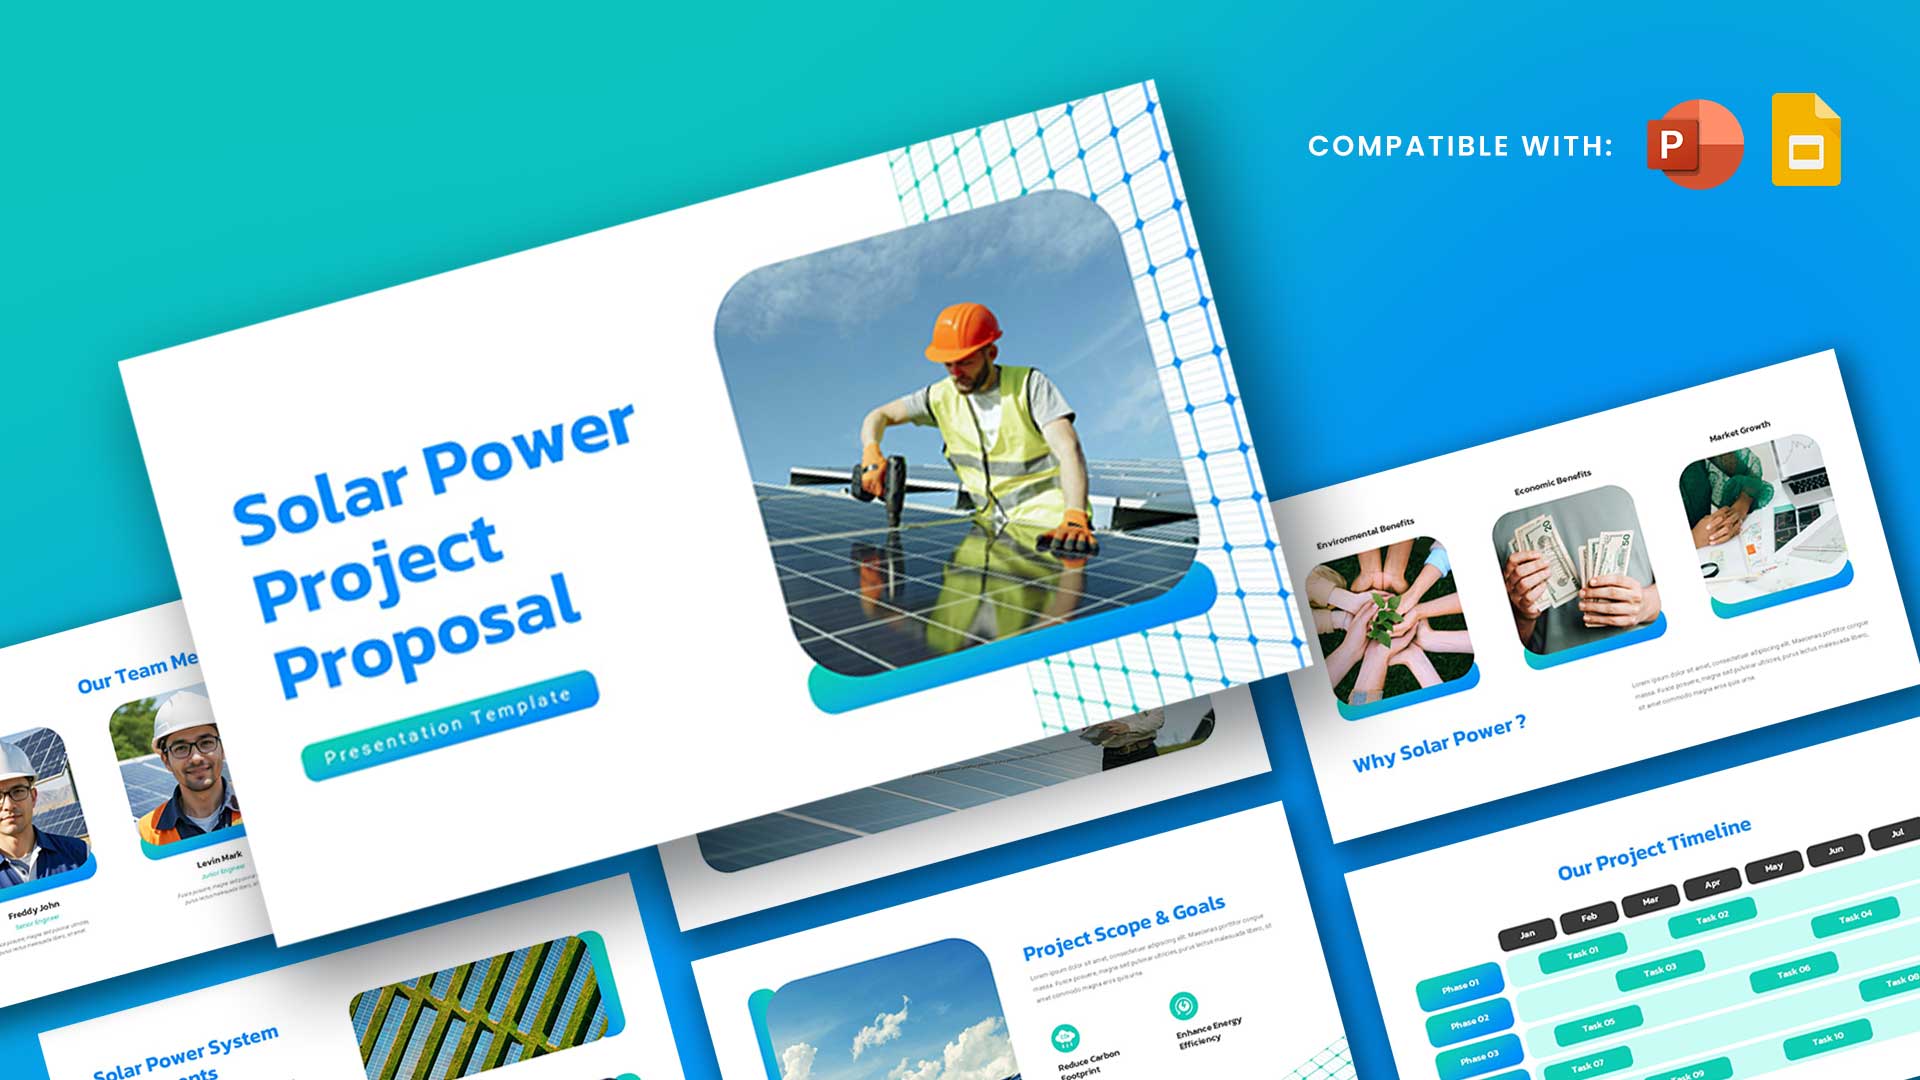
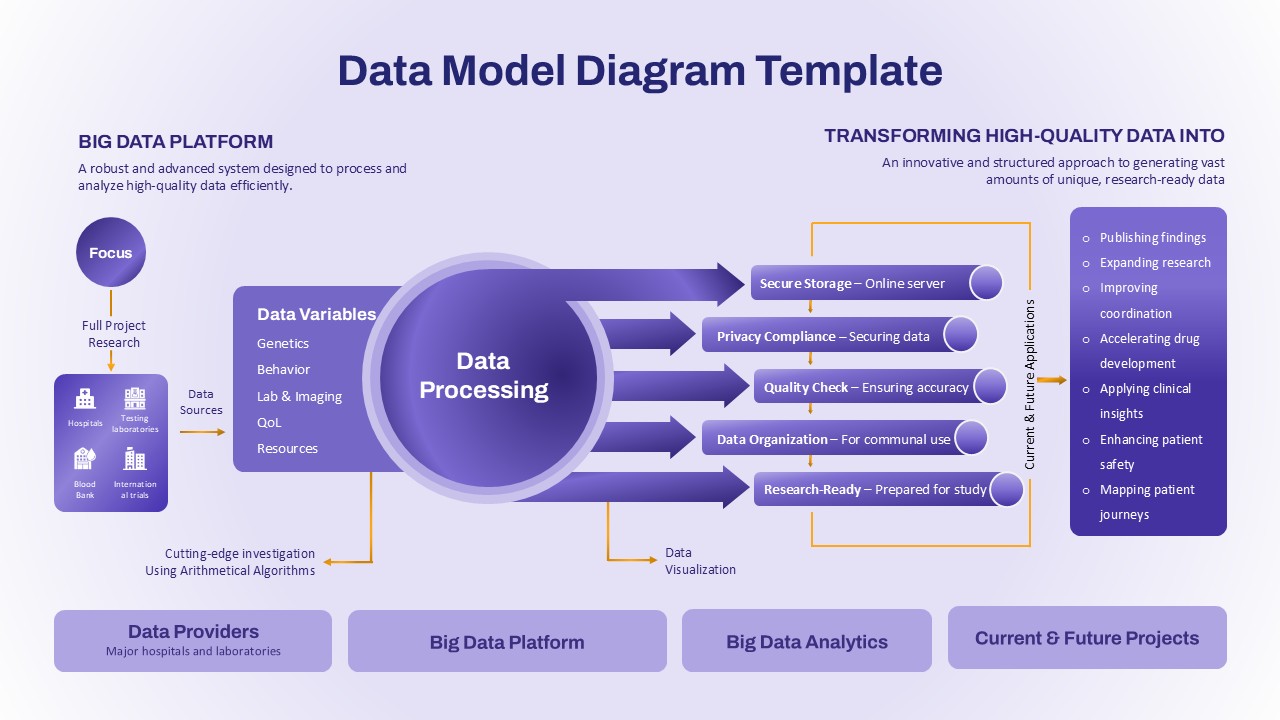
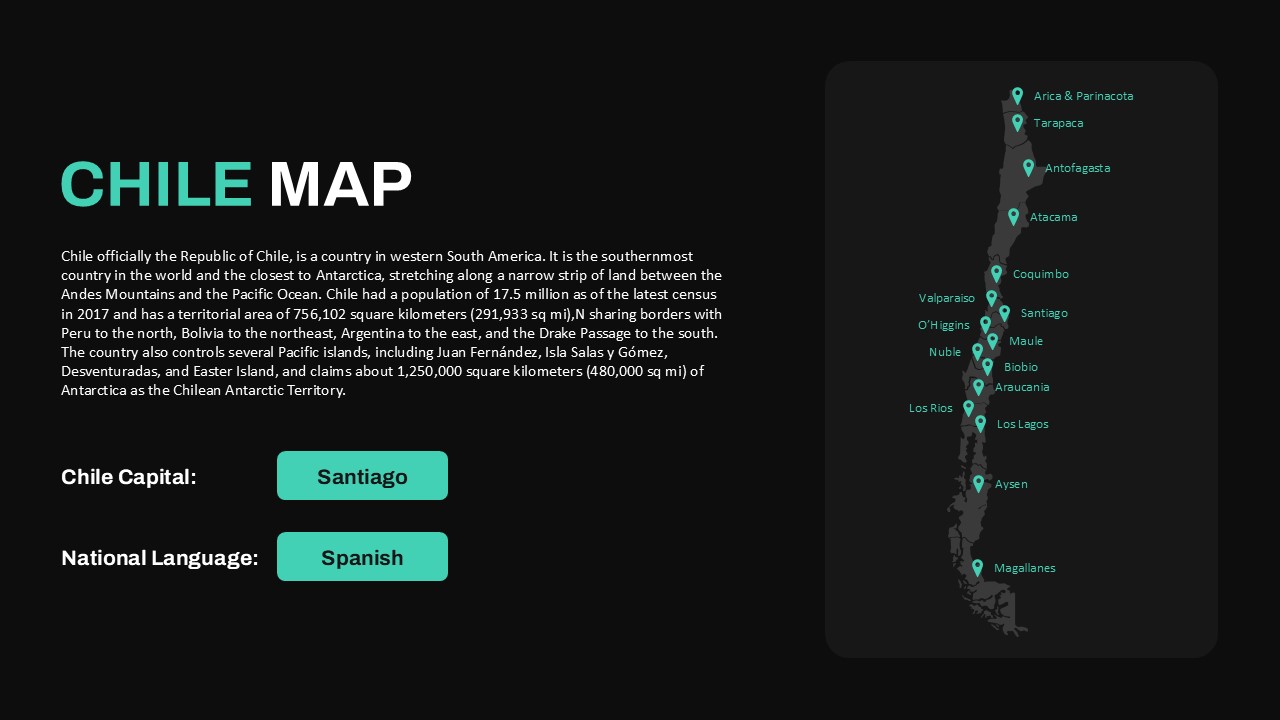
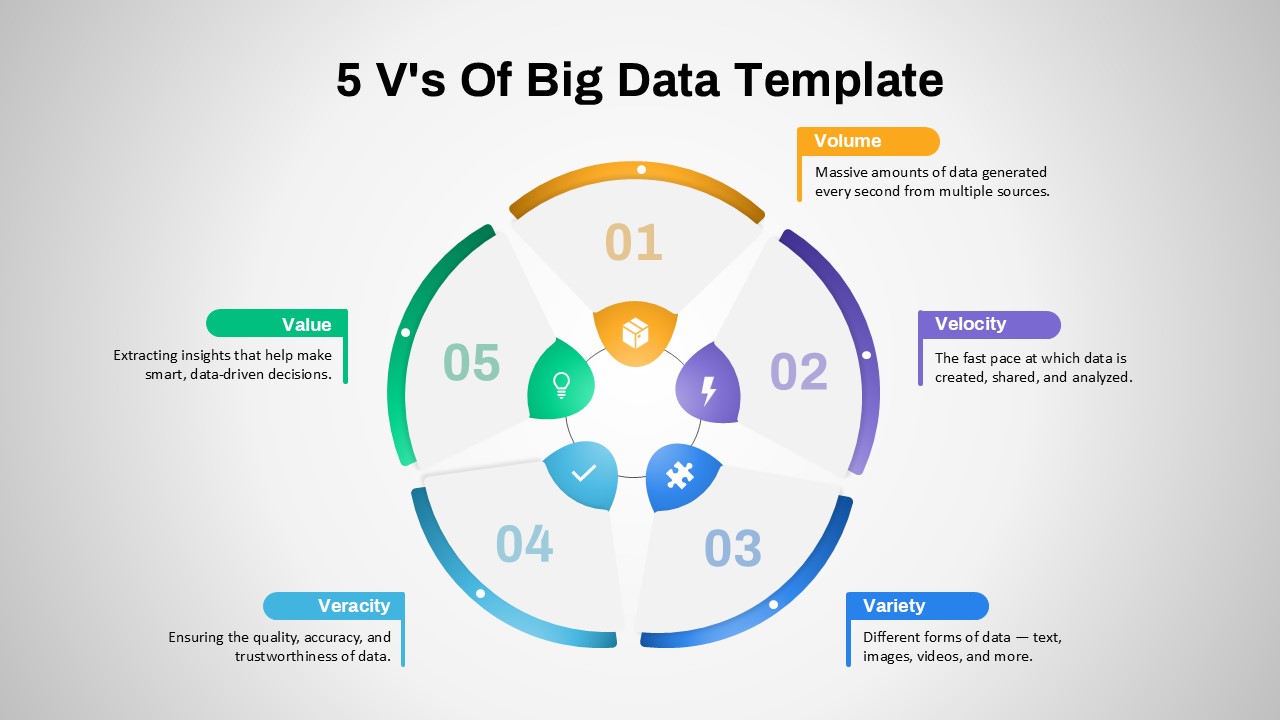
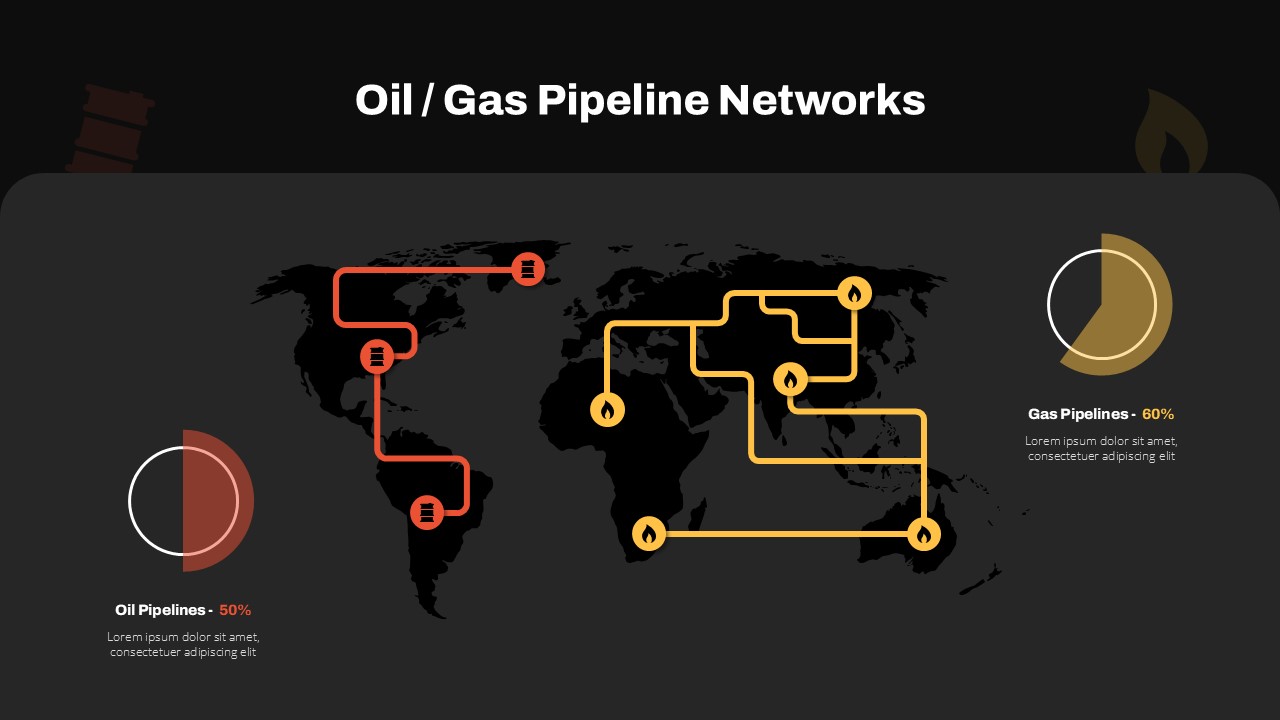
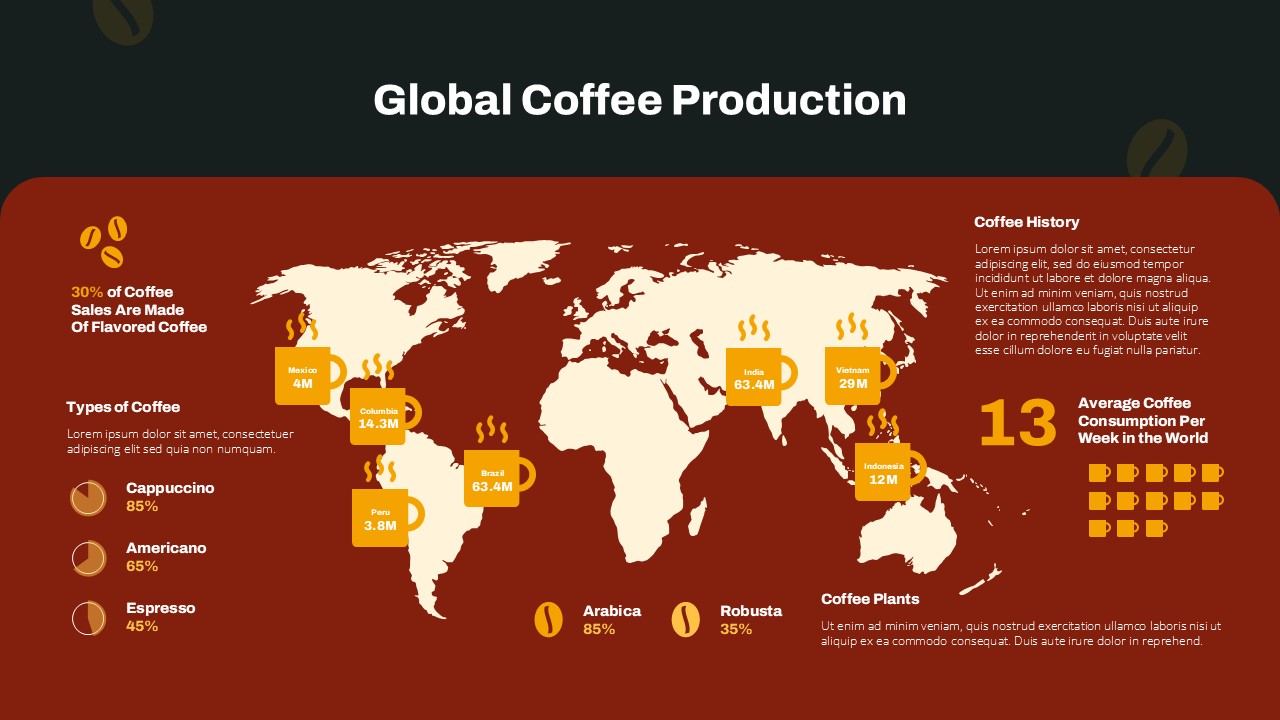
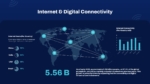
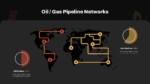
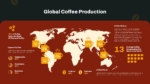
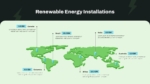
The deck also explores digital and industrial themes: Internet & Digital Connectivity presents charts and graphs on global access, Oil and Gas Pipeline Networks visualize energy transport, and Global Coffee Production features a coffee-brown map showing producing regions. The Renewable Energy Installations slide includes location icons to identify green energy hubs.
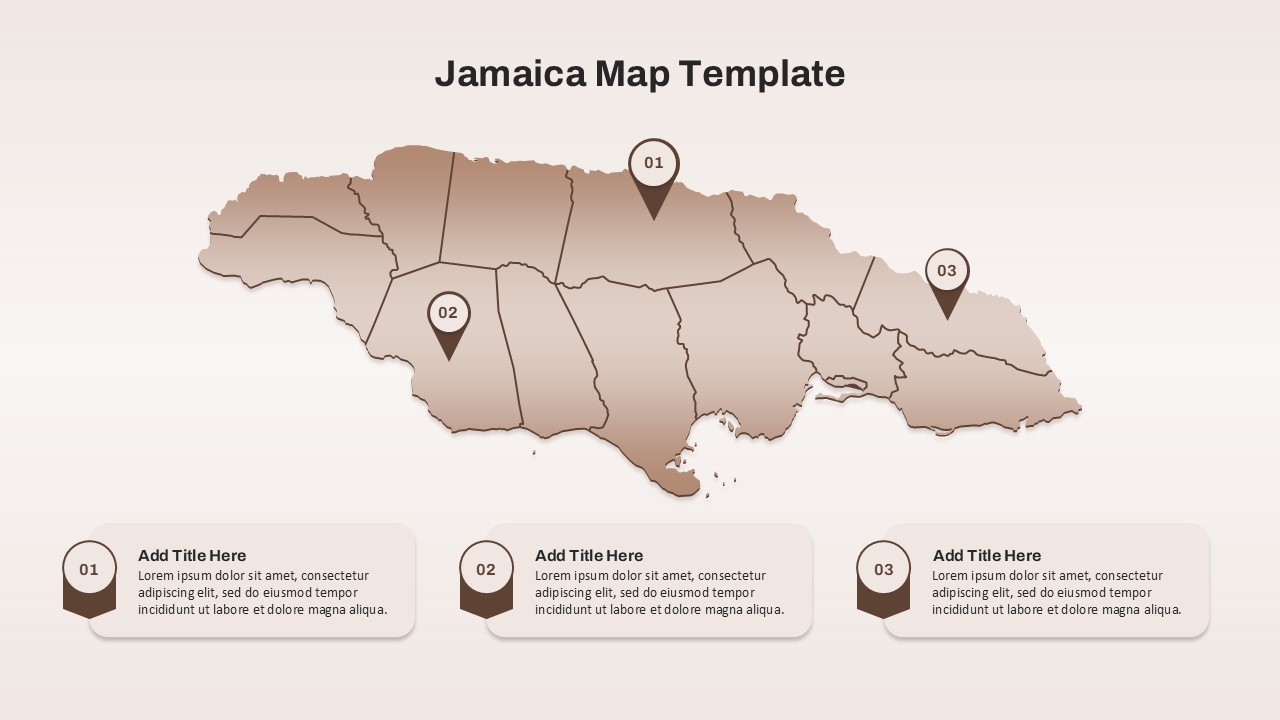
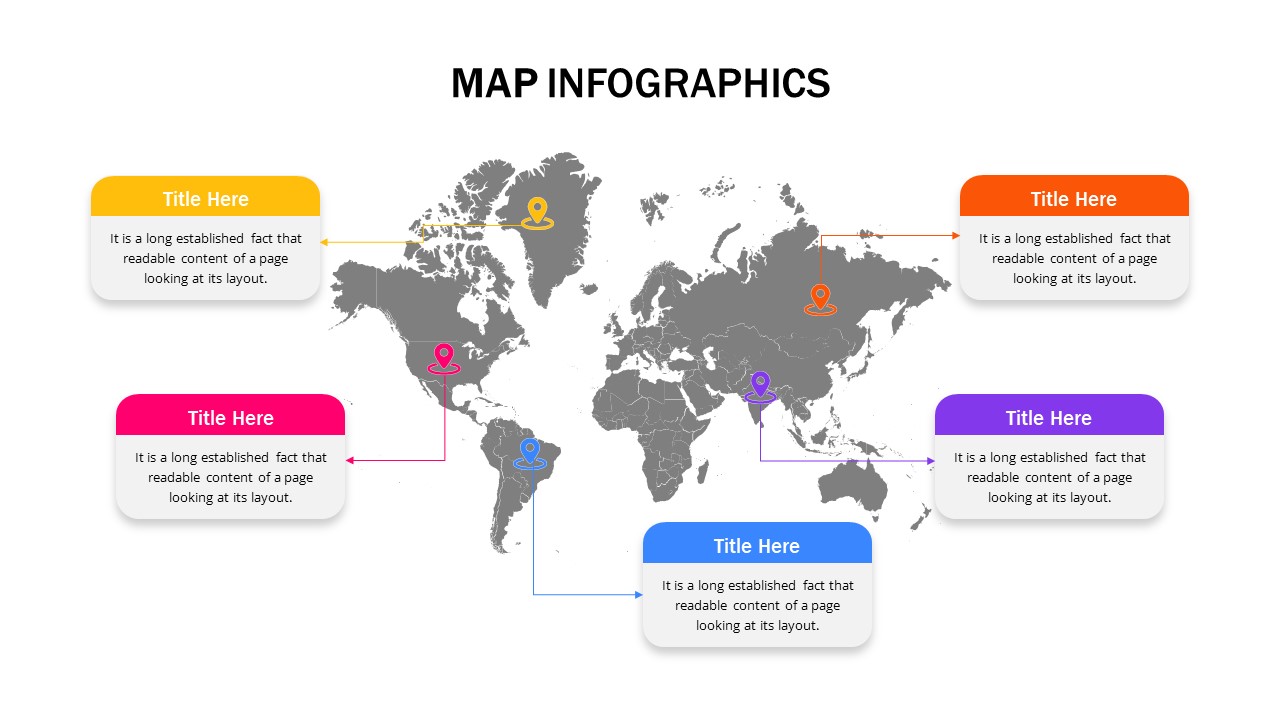
This global map for PowerPoint set is highly useful for business executives, educators, researchers, policy analysts, and students who deal with international data or comparative studies. The deck includes location indicators, Harvey balls, graphs, and other statistical tools for accurate and engaging presentations.
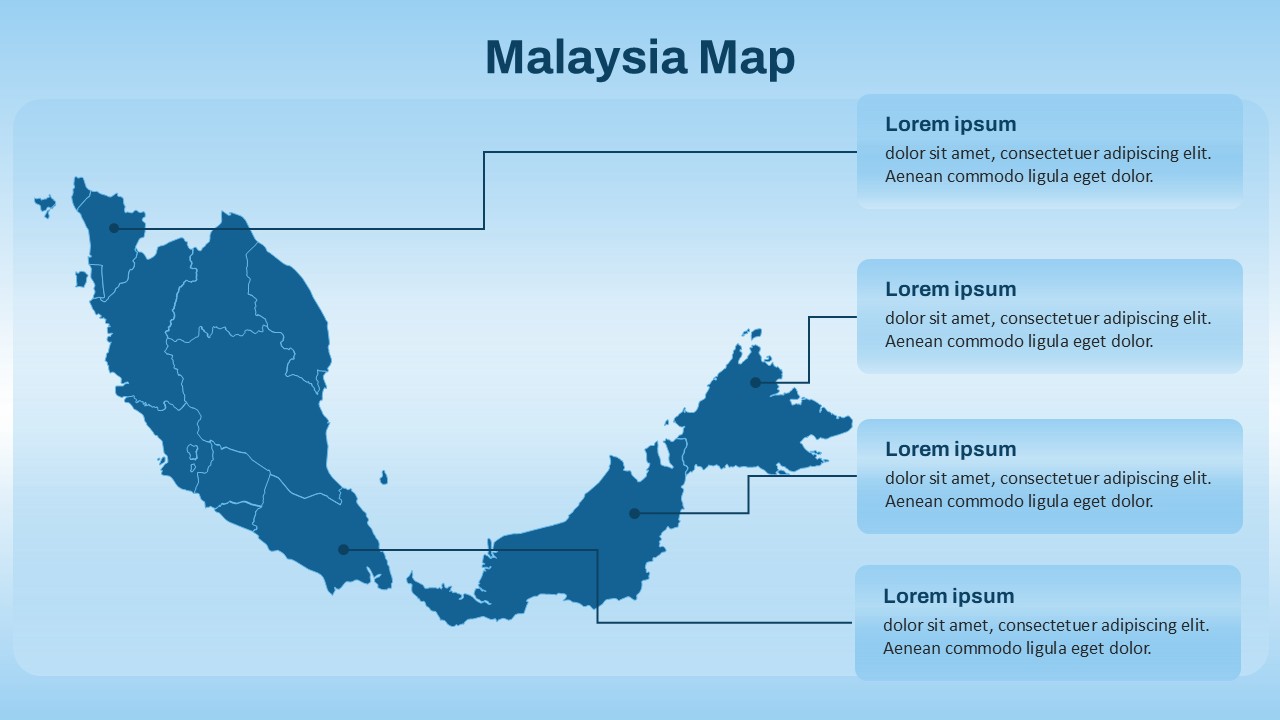
Fully customizable, each slide allows users to modify colors, add text, resize icons, and update charts to suit their presentation needs. This world map for PPT presentation is a ready-to-use toolkit for anyone looking to deliver data-driven global insights with visual impact.
See more

Aspect Ratio
16:9Item ID
SKT03809
Features of this template
Other User Cases of the Template:
Geopolitical analysis, Market expansion strategy, Environmental risk assessments, International business reports, Trade and logistics planning, Educational geography presentations, Global economic overviews, NGO impact reports, Research findings visualization, Policy briefings
FAQs
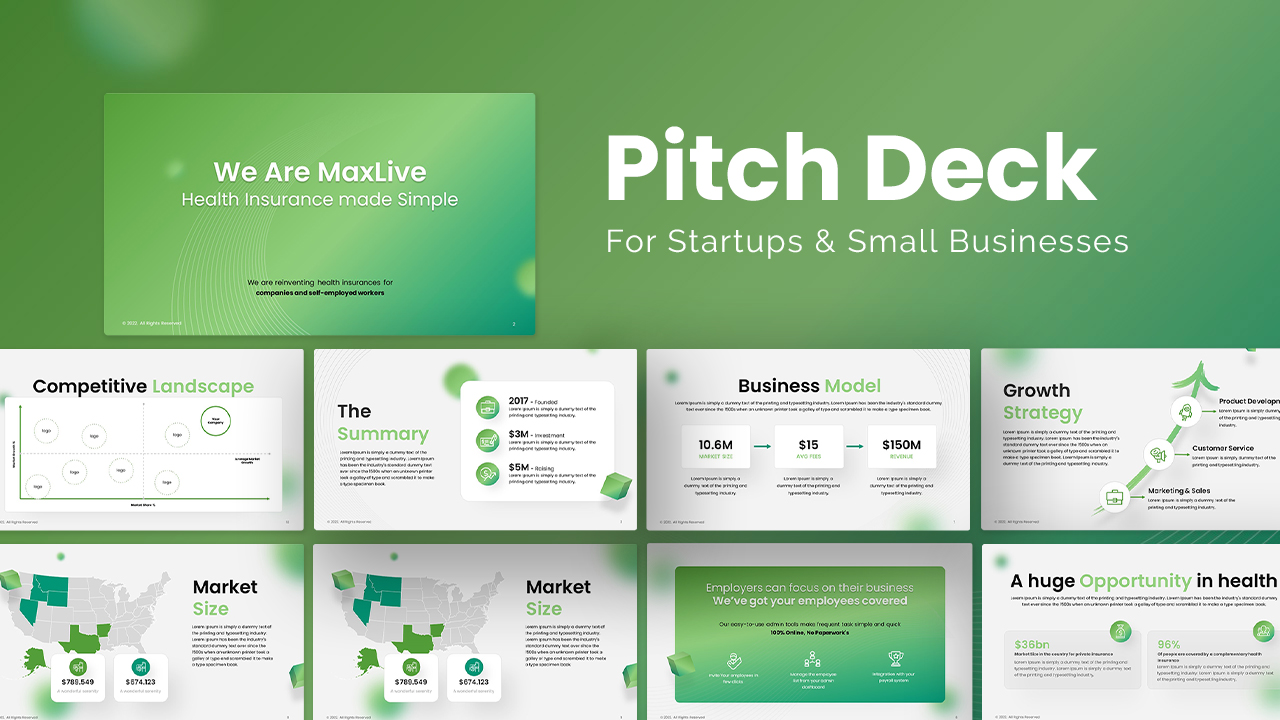
You May Also Like These Presentation Templates


- Free

- Free

- Free
- Free
- Free
- Free
- Free
- Free
- Free
- Free

- Free

- Free
- Free
- Free
- Free
- Free
- Free
- Free
- Free
- Free
- Free
- Free
- Free
- Free
- Free
- Free
- Free
- Free