Statistics PowerPoint Presentation Template
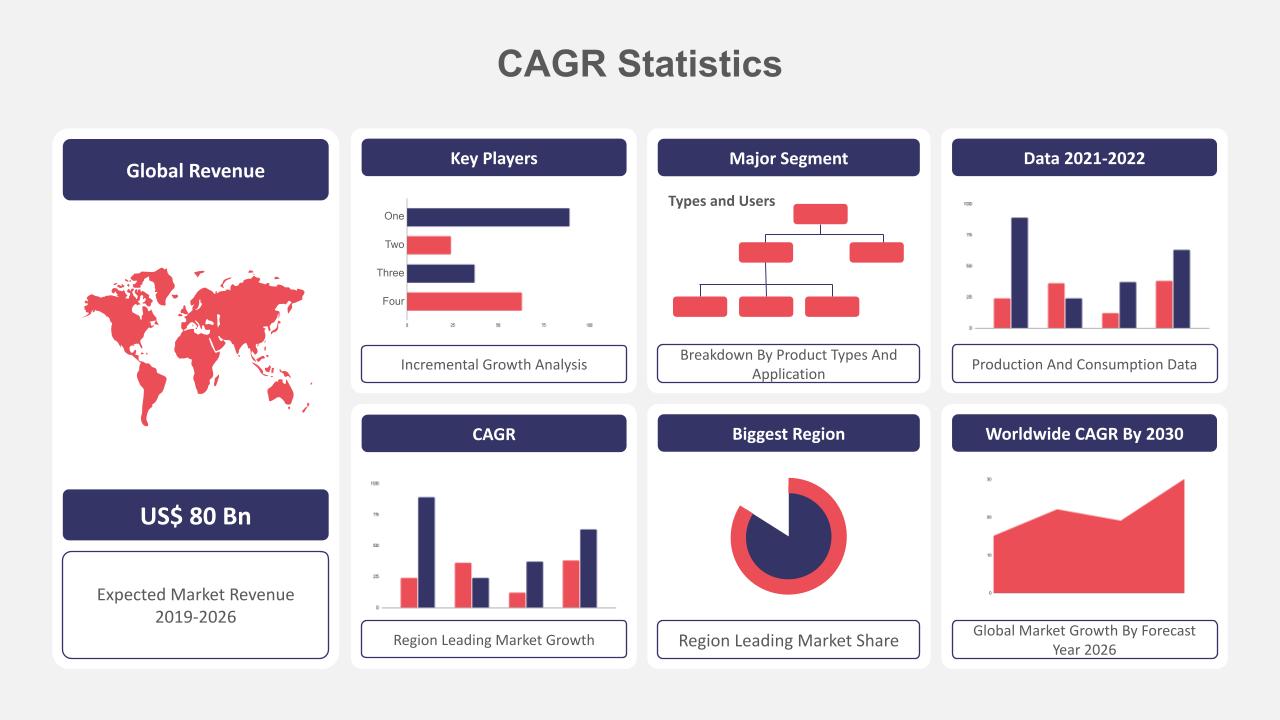
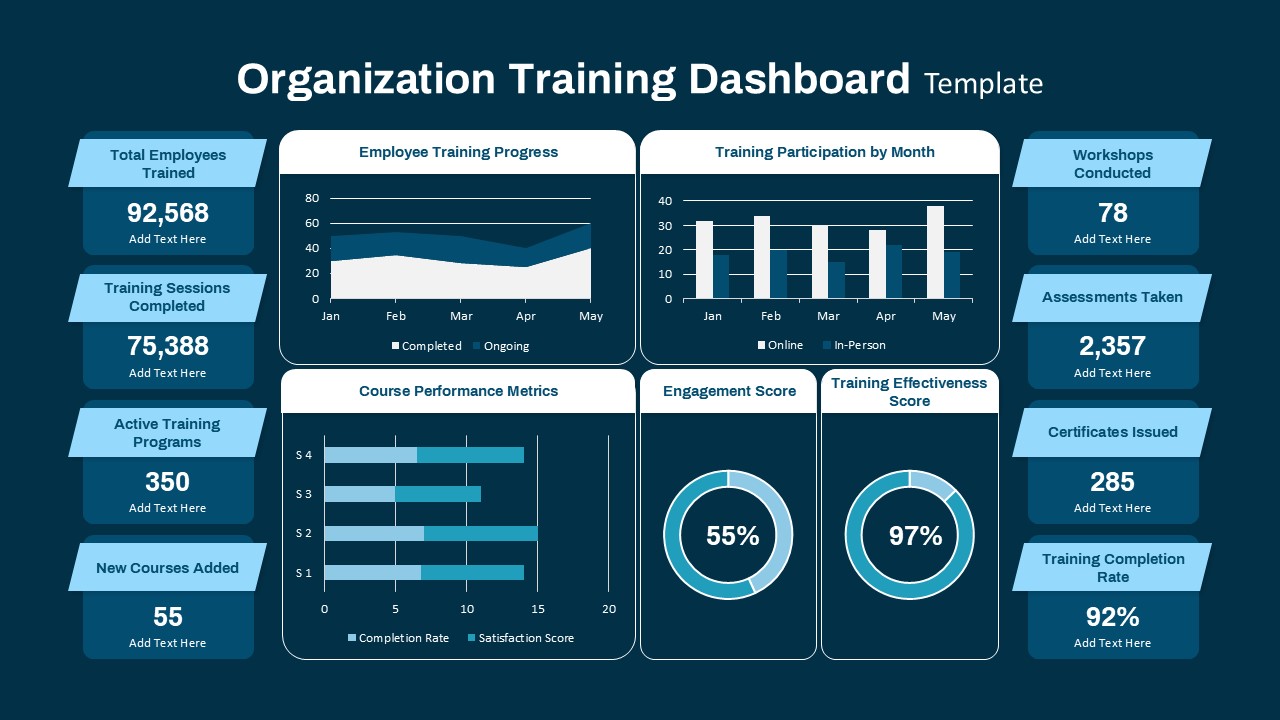
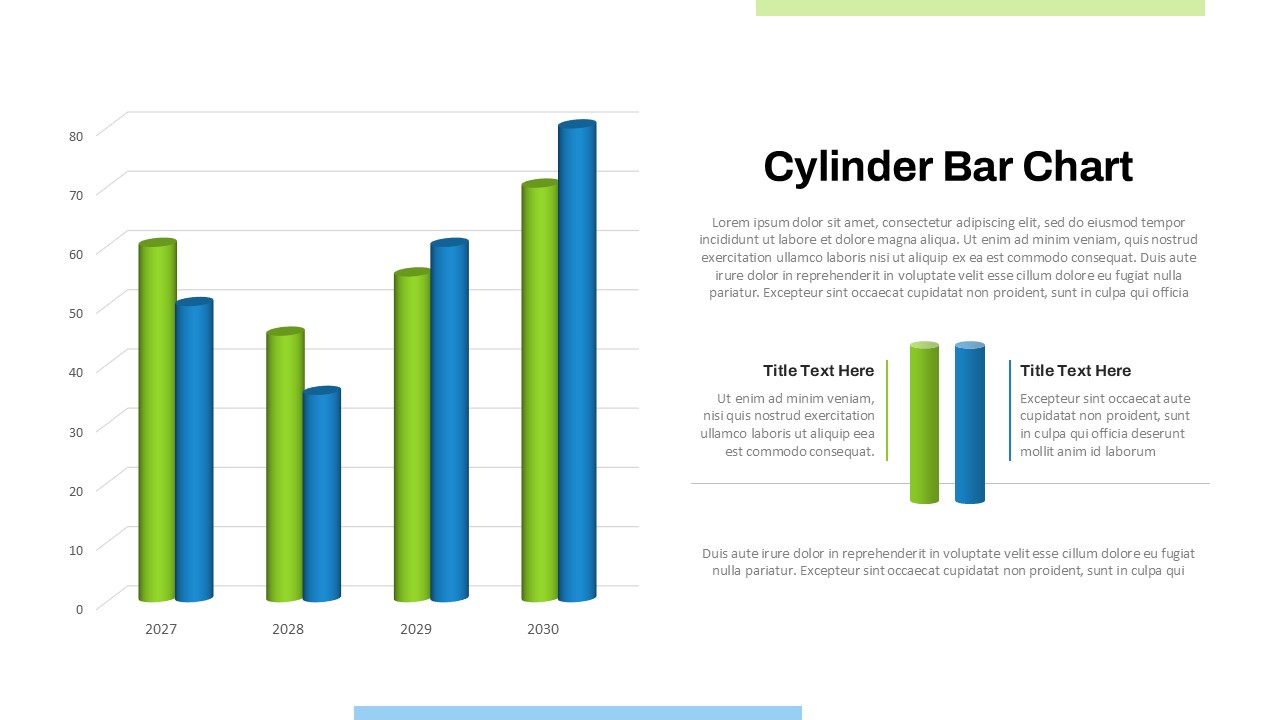
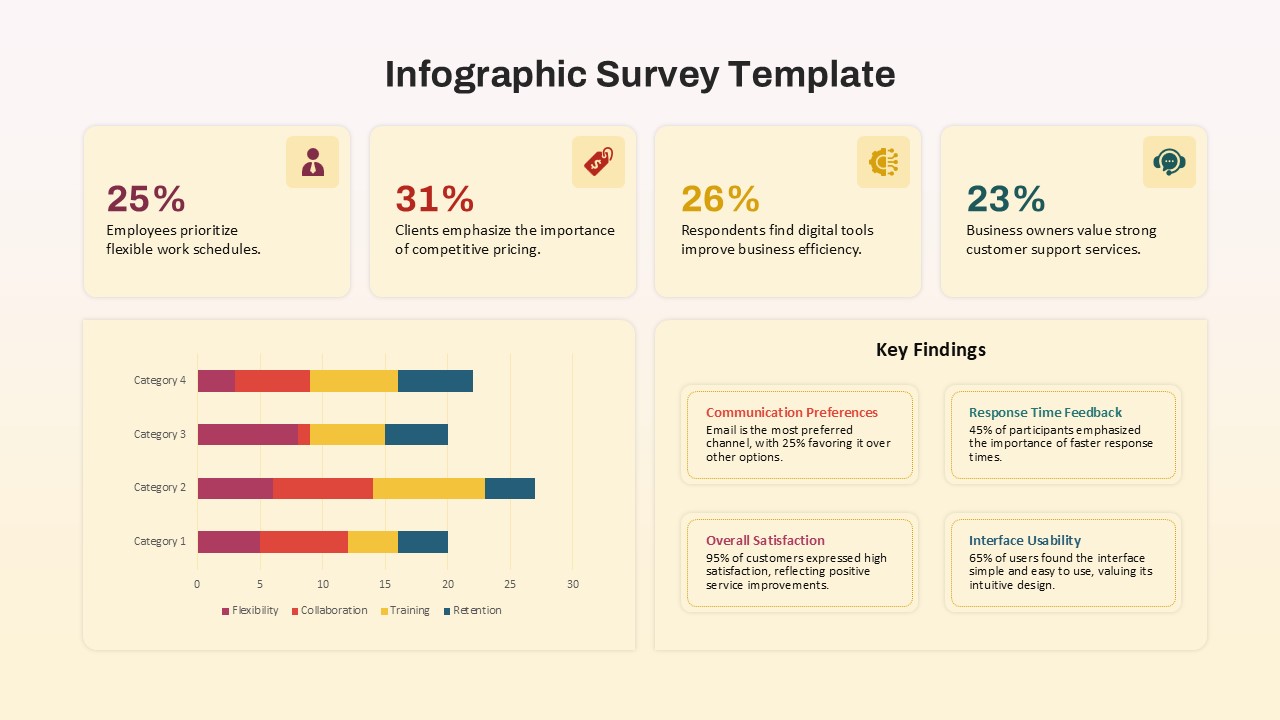
The Statistics & Data Visualization PowerPoint Presentation Template is a powerful, data-centric slide deck designed to help professionals present quantitative insights with clarity and impact. Ideal for analysts, researchers, marketers, and business strategists, this statistics presentation template offers a versatile set of visual tools including bar charts, line graphs, pie-style progress visuals, and key figure highlights.
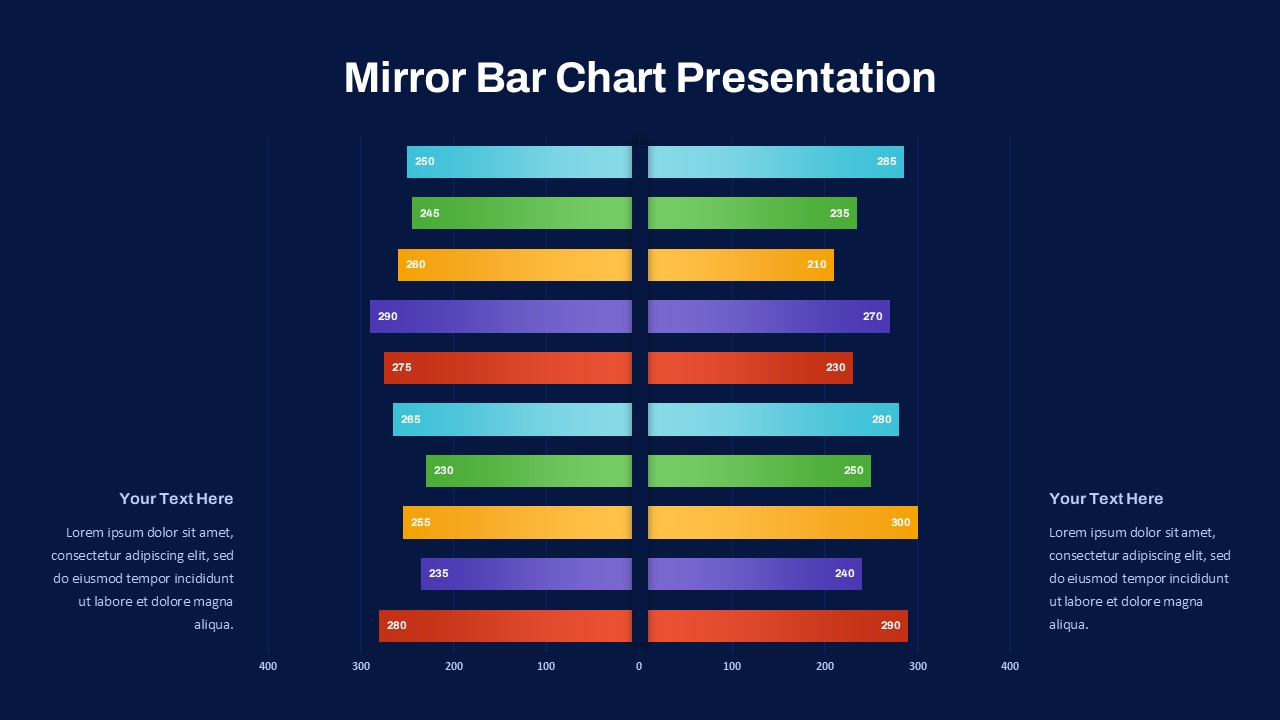
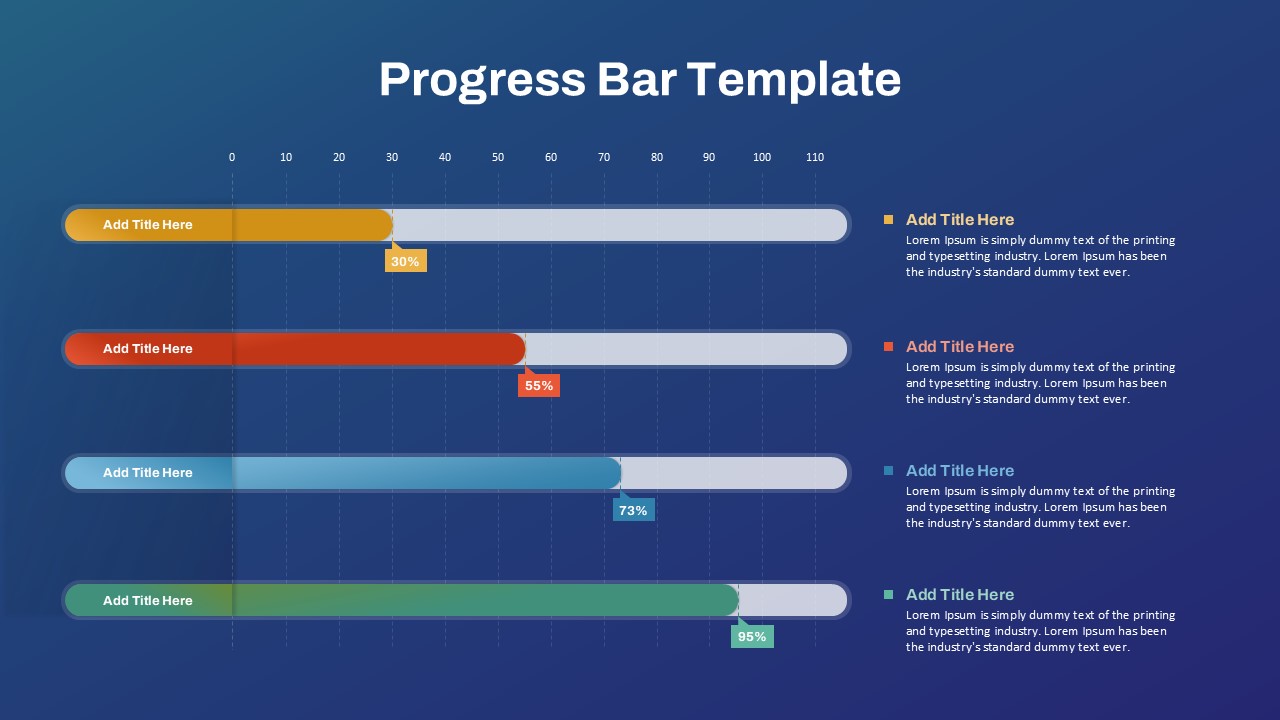
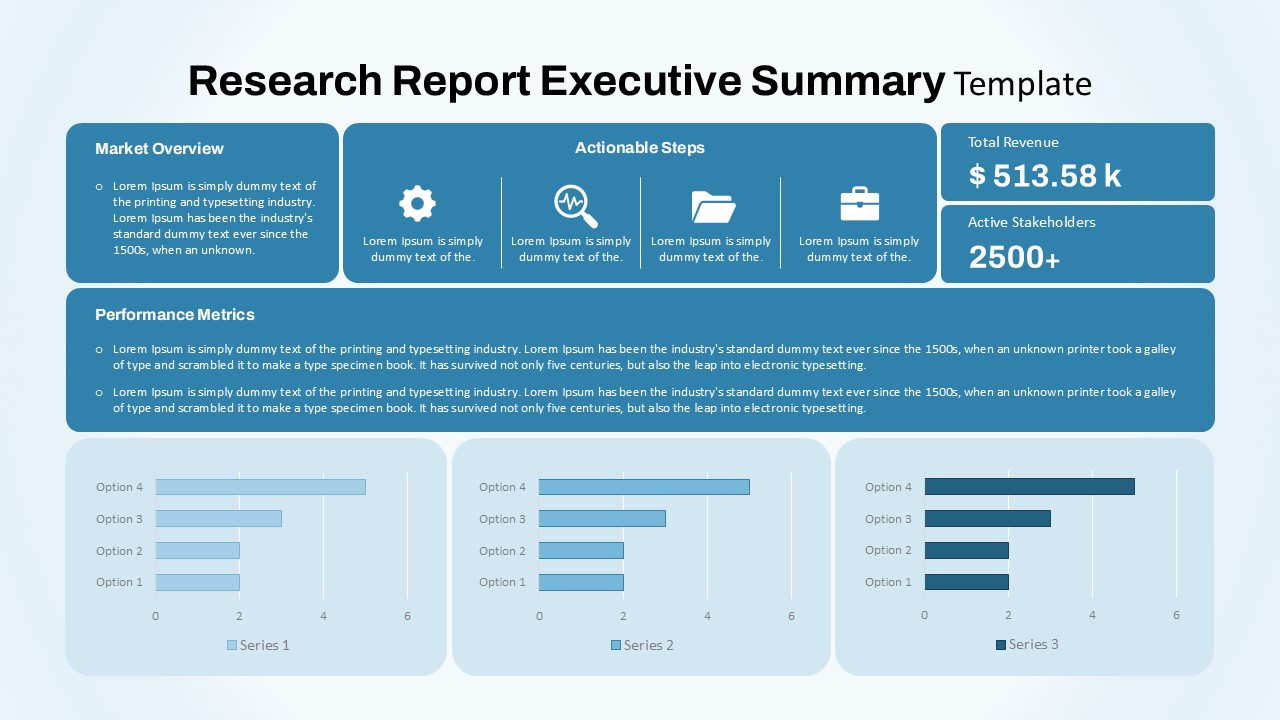
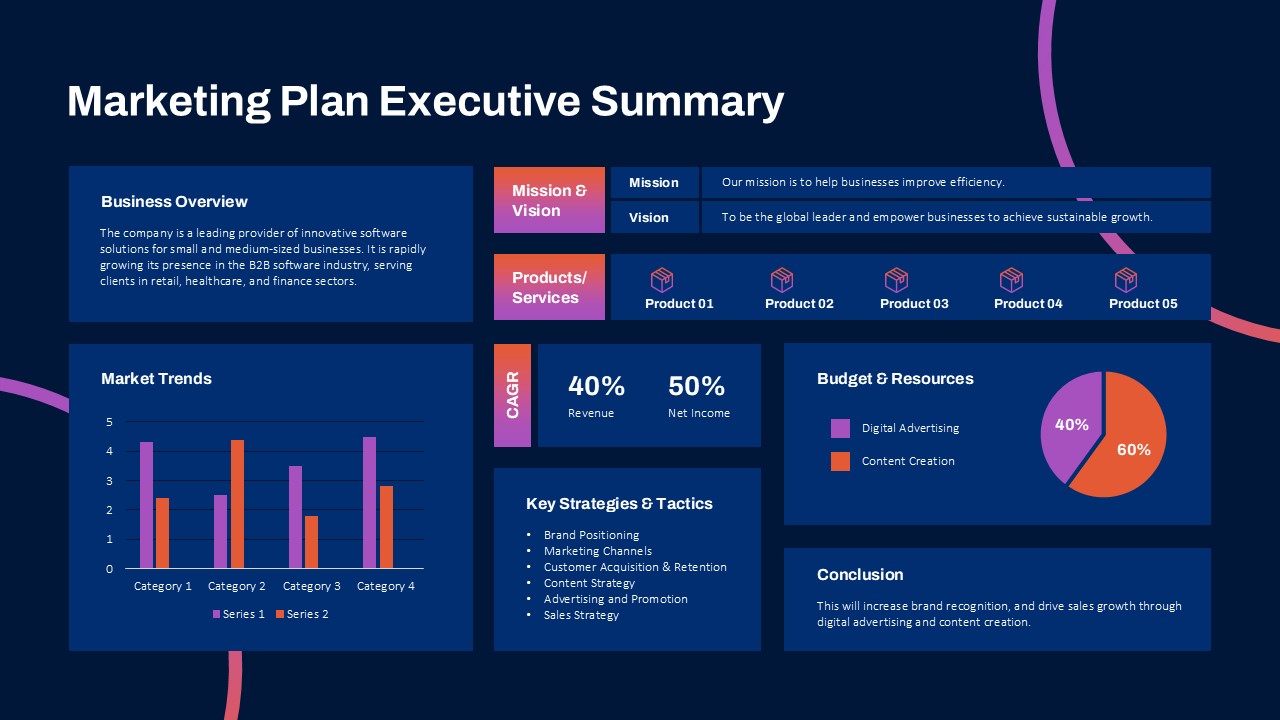
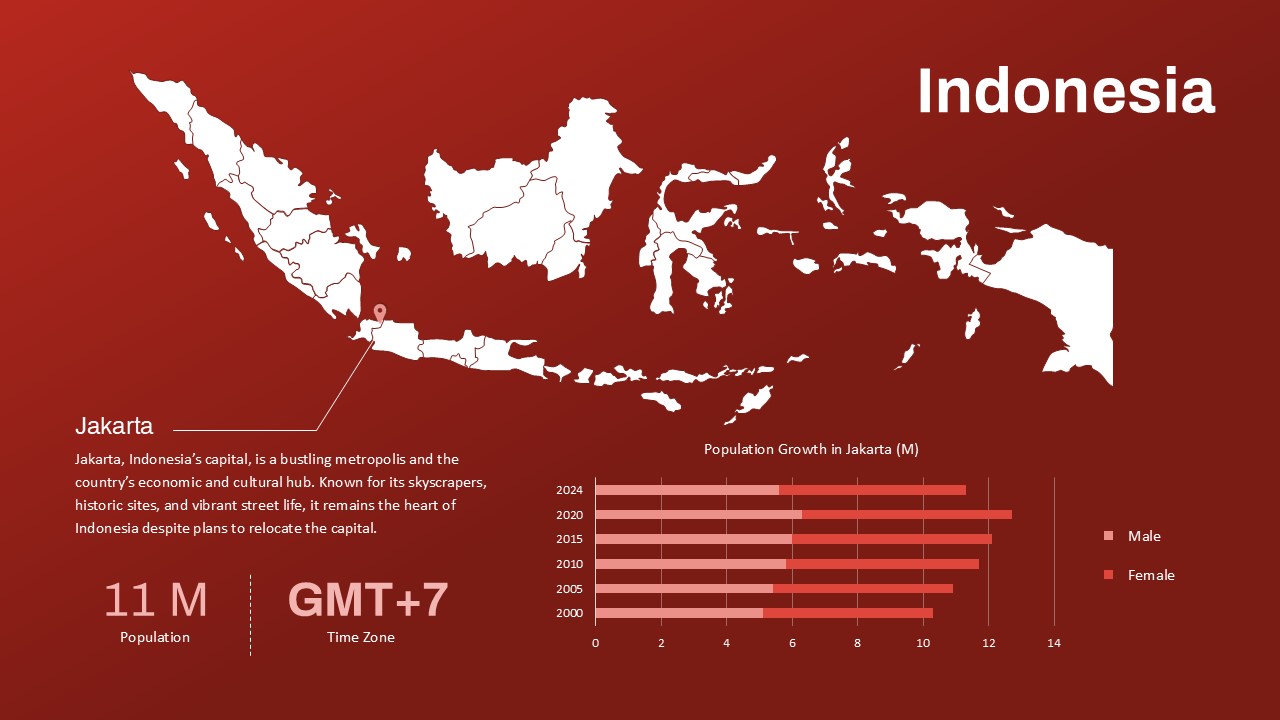
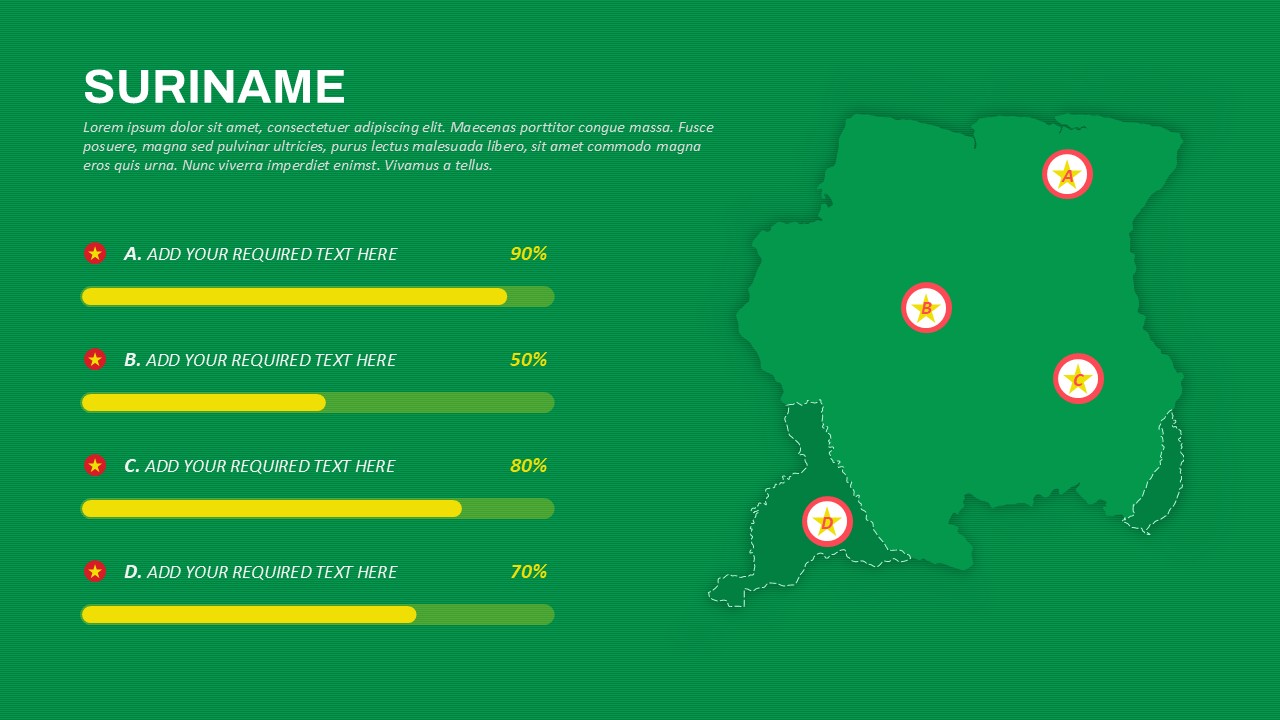
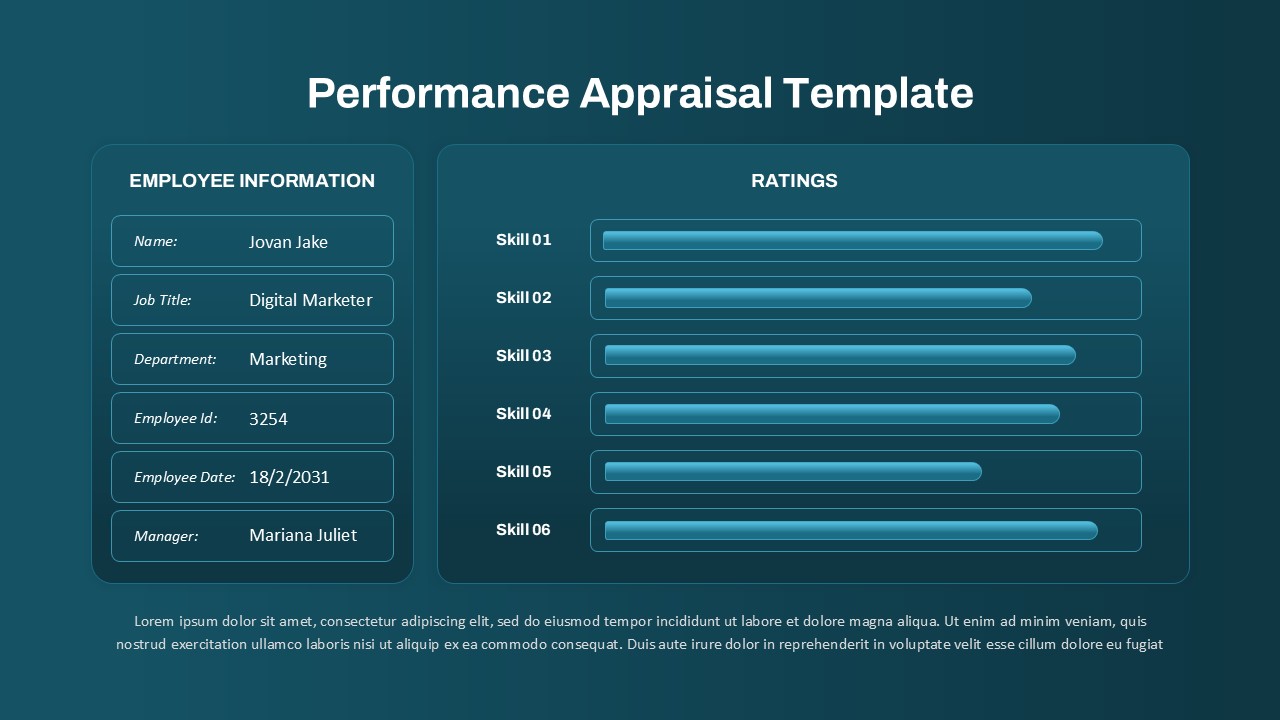
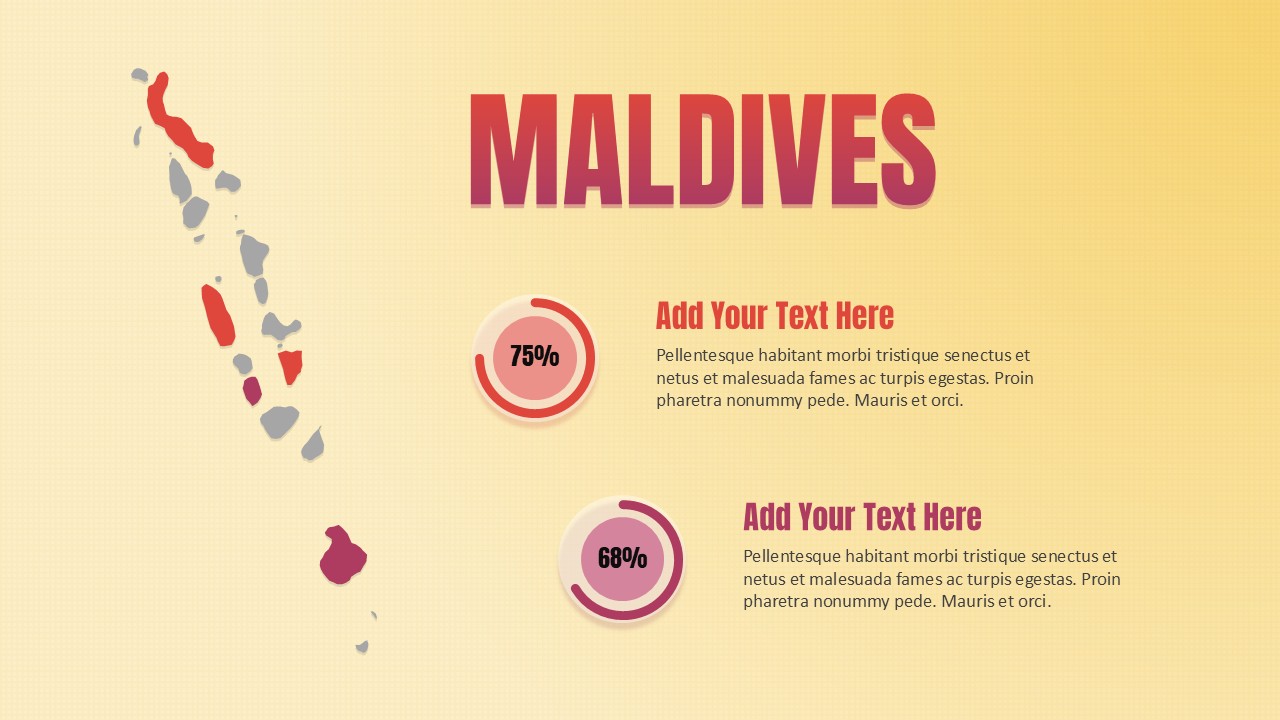
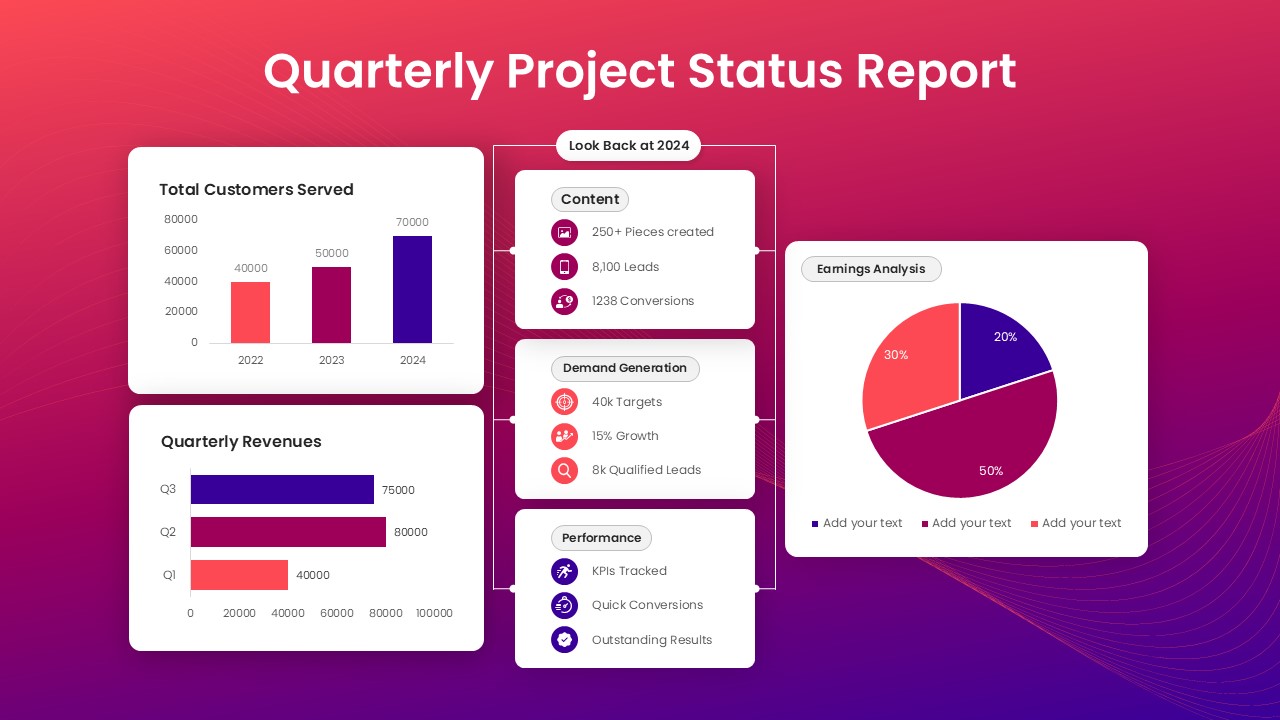
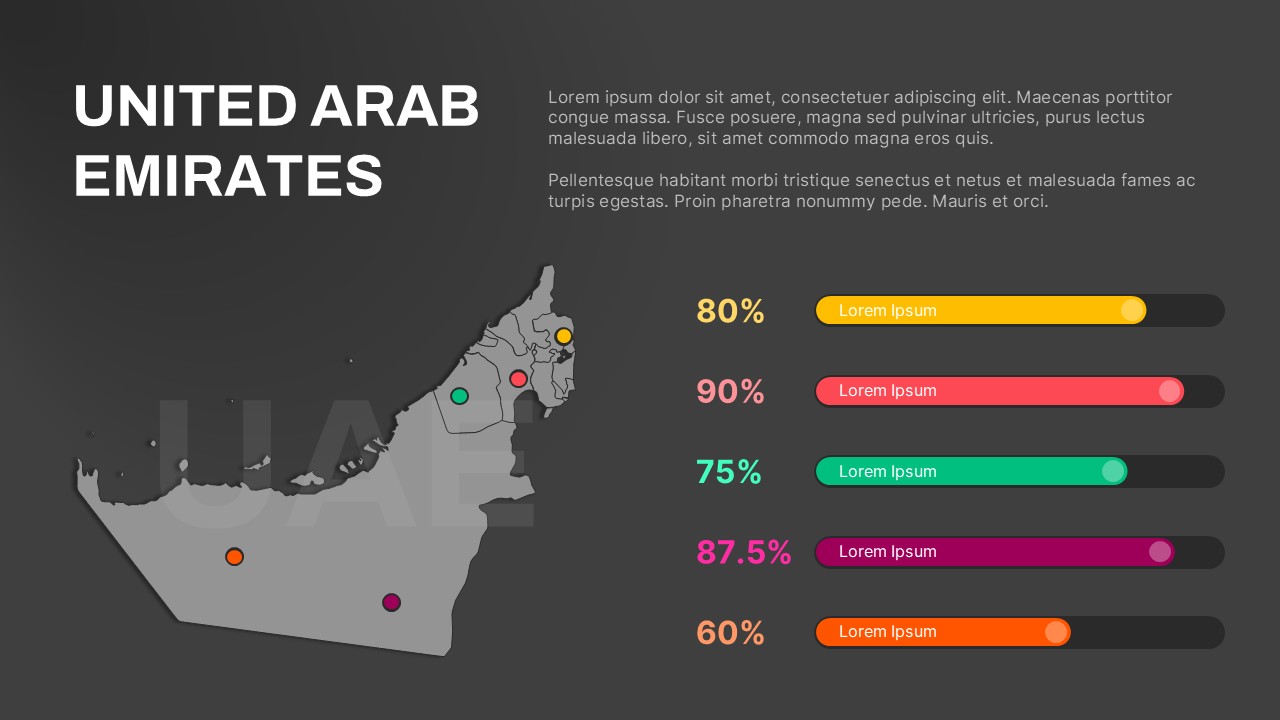
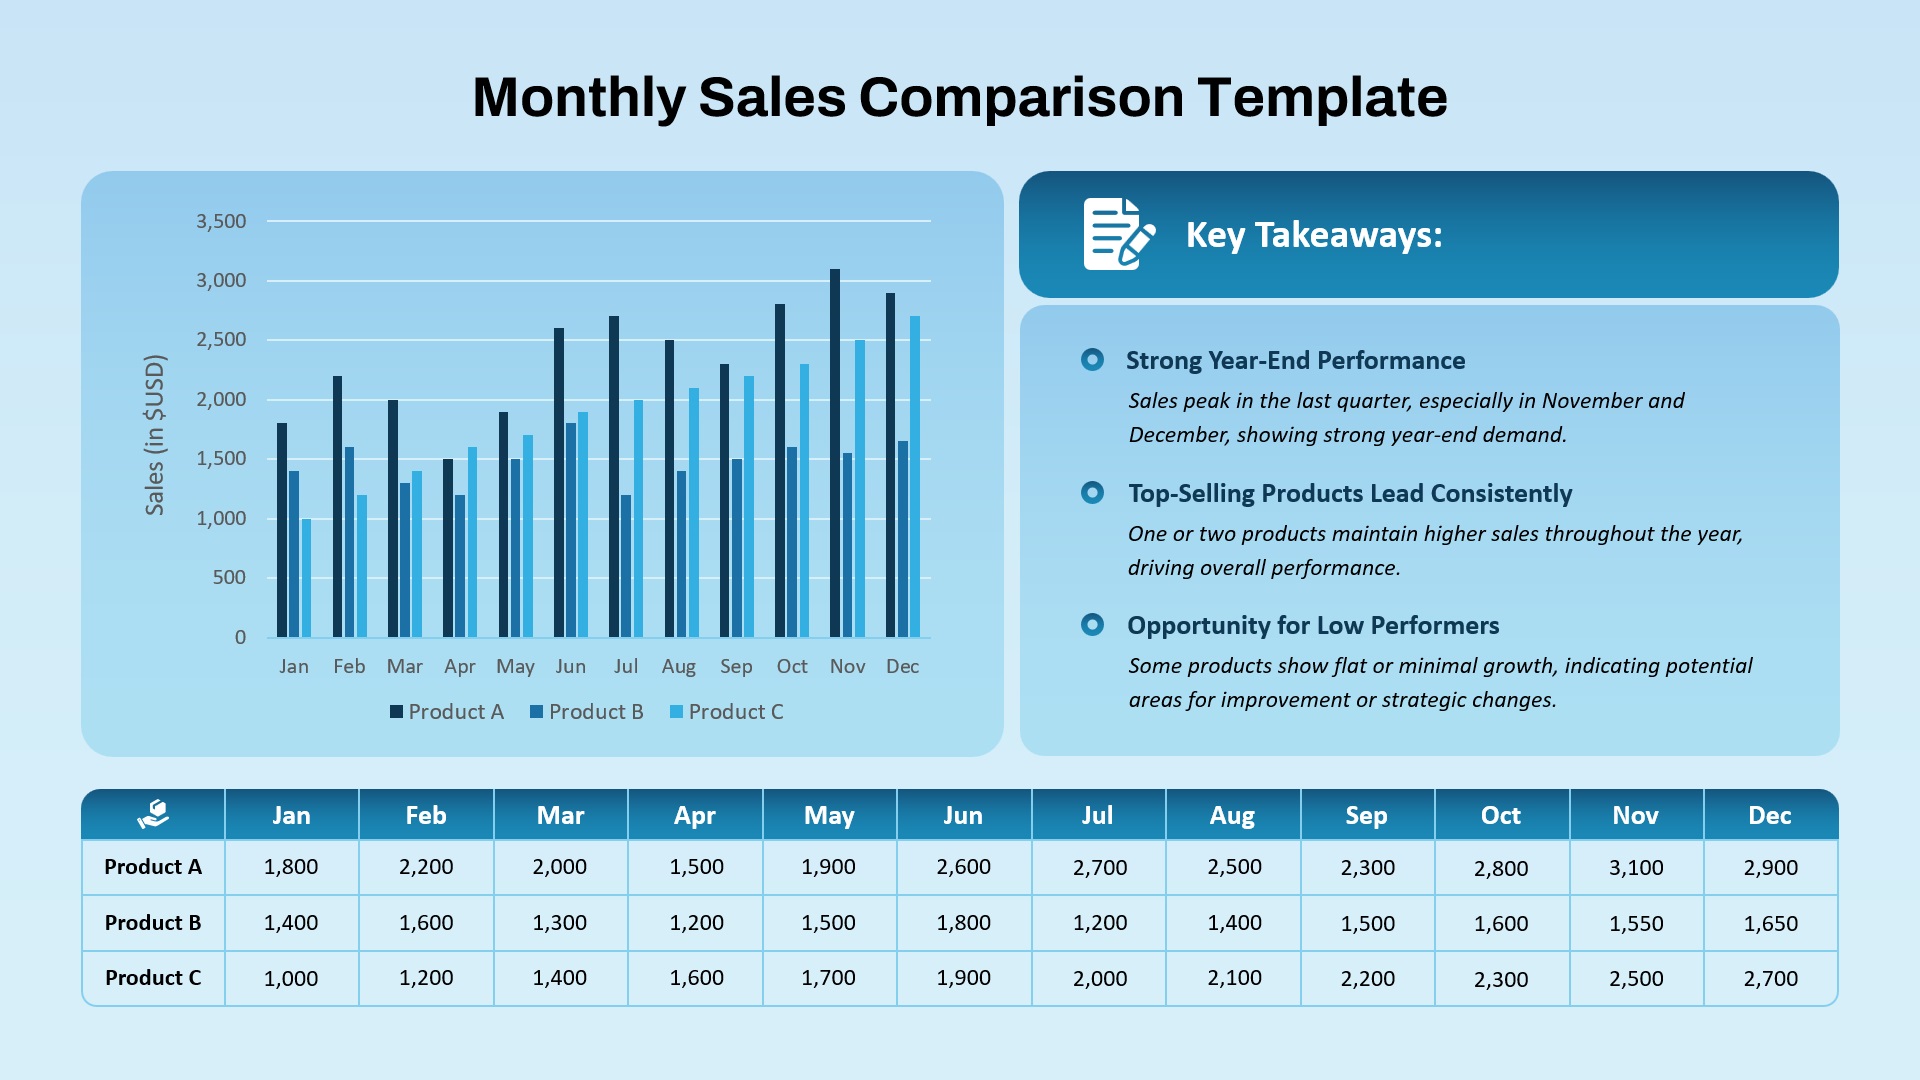
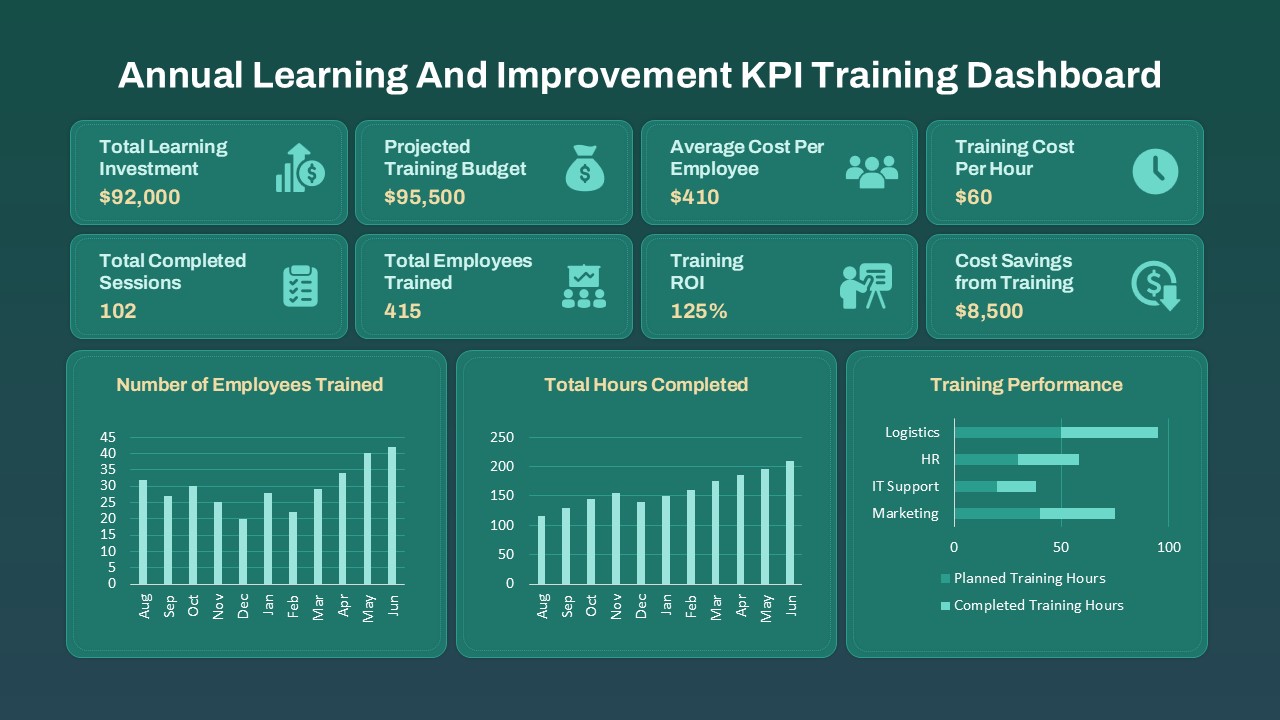
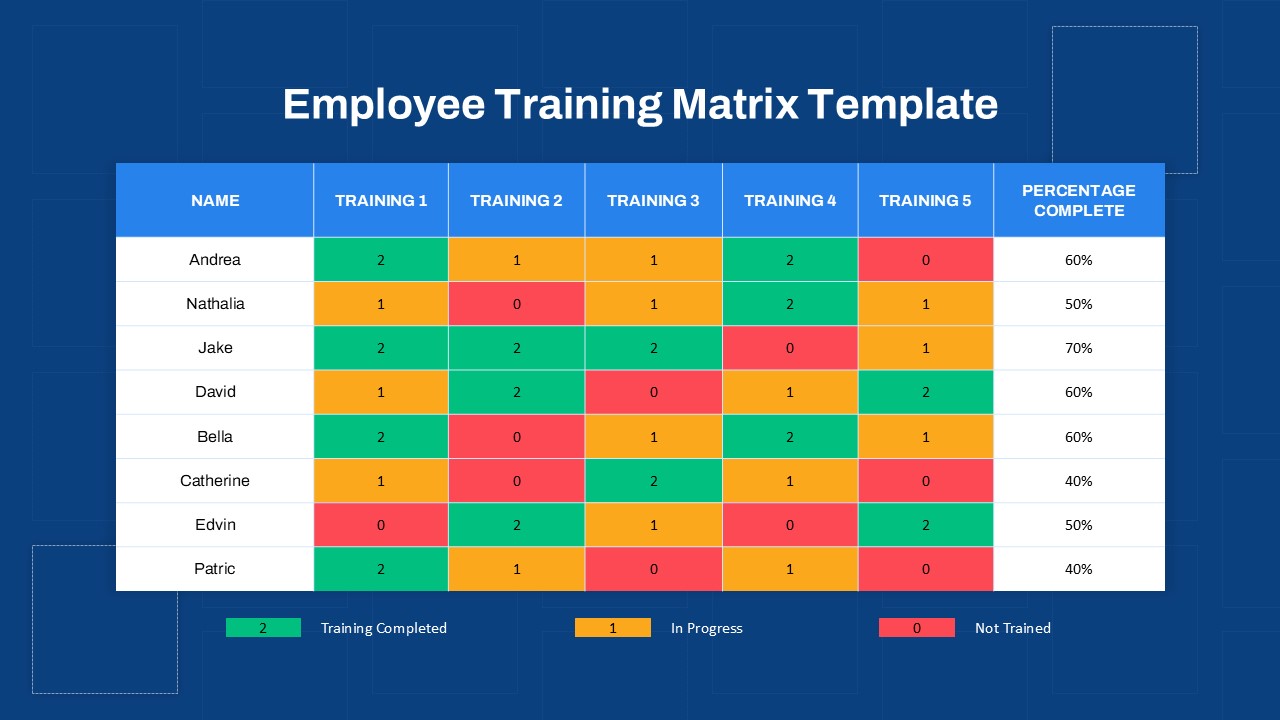
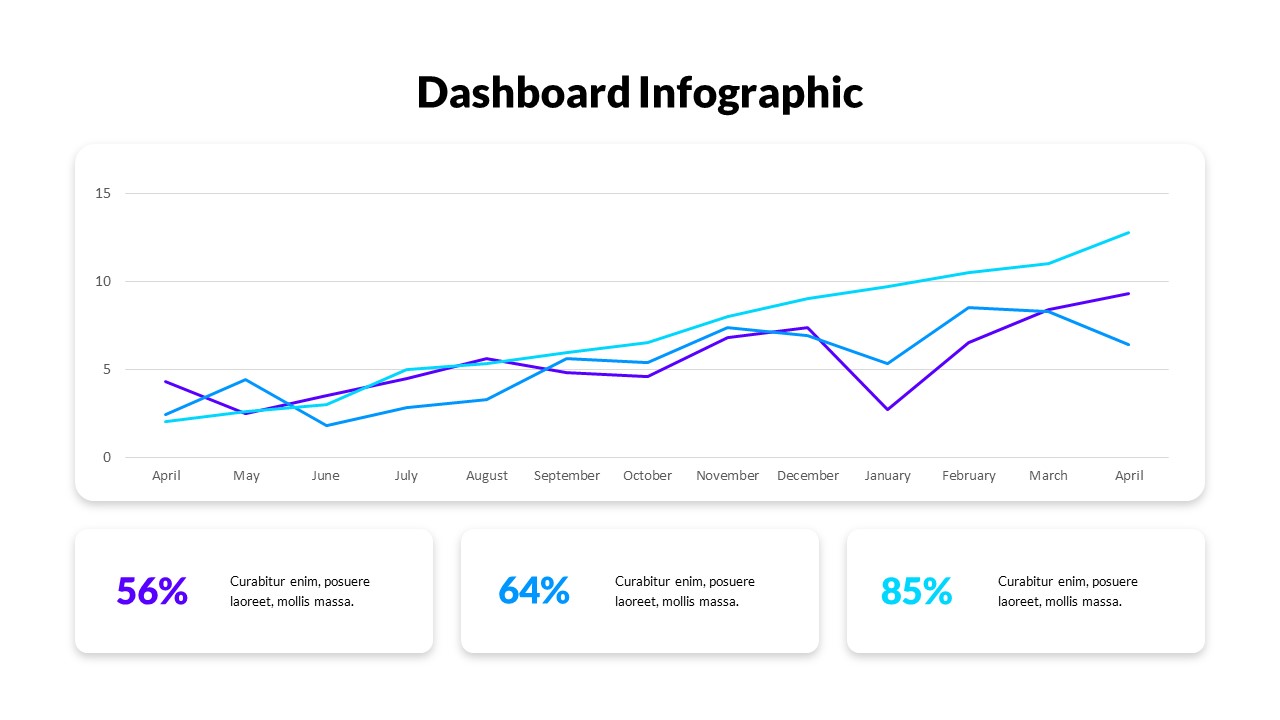
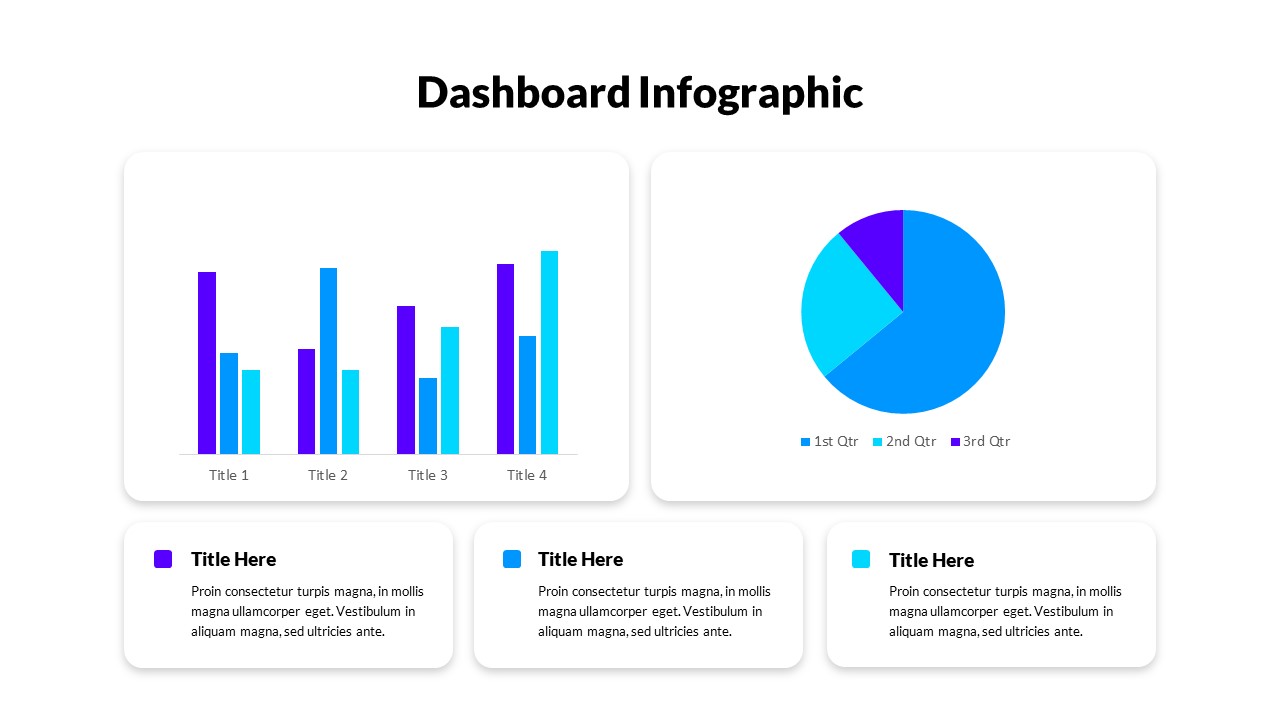
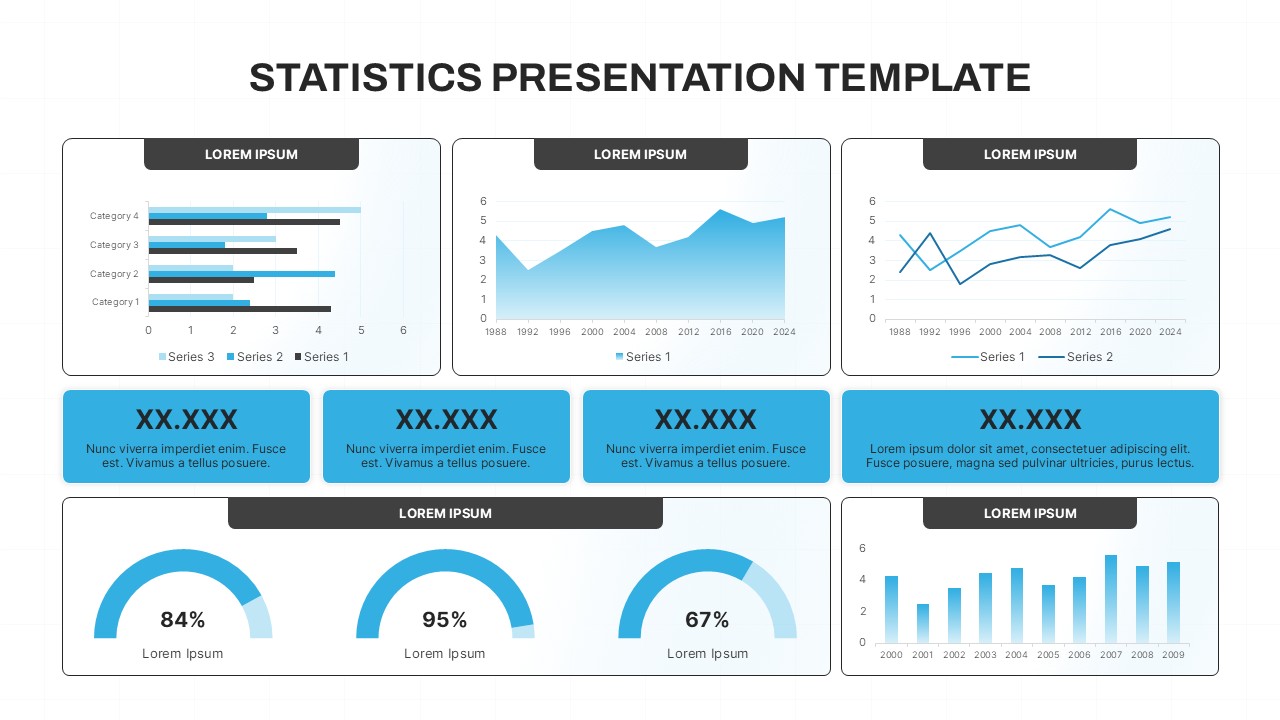
This modern layout integrates multiple chart formats across a single slide—such as comparative bar charts, historical trend line graphs, and time-series area graphs—making it easy to showcase both granular and high-level data patterns. Supporting metrics are displayed in eye-catching callout boxes to highlight KPIs or performance figures, while circular percentage visuals help emphasize progress and goal completion.
Its clean, minimal design with a blue and white palette promotes readability, while the grid-style layout ensures that the visual hierarchy is maintained for seamless storytelling. Whether used in quarterly reports, research studies, marketing performance reviews, or sales updates, this template provides the perfect balance between detail and digestibility.
The template is fully editable in both PowerPoint and Google Slides, allowing users to easily input their own data, change color schemes, and customize graphs to match brand guidelines or audience preferences. This results in polished, executive-ready presentations that are both informative and visually compelling.
See more

Aspect Ratio
16:9Item ID
SKT03547
Features of this template
Other User Cases of the Template:
Marketing analytics reports, business performance reviews, academic research results, investment analysis, financial dashboards, product usage metrics, annual reports, team performance summaries, operational reviews, survey result presentations
FAQs
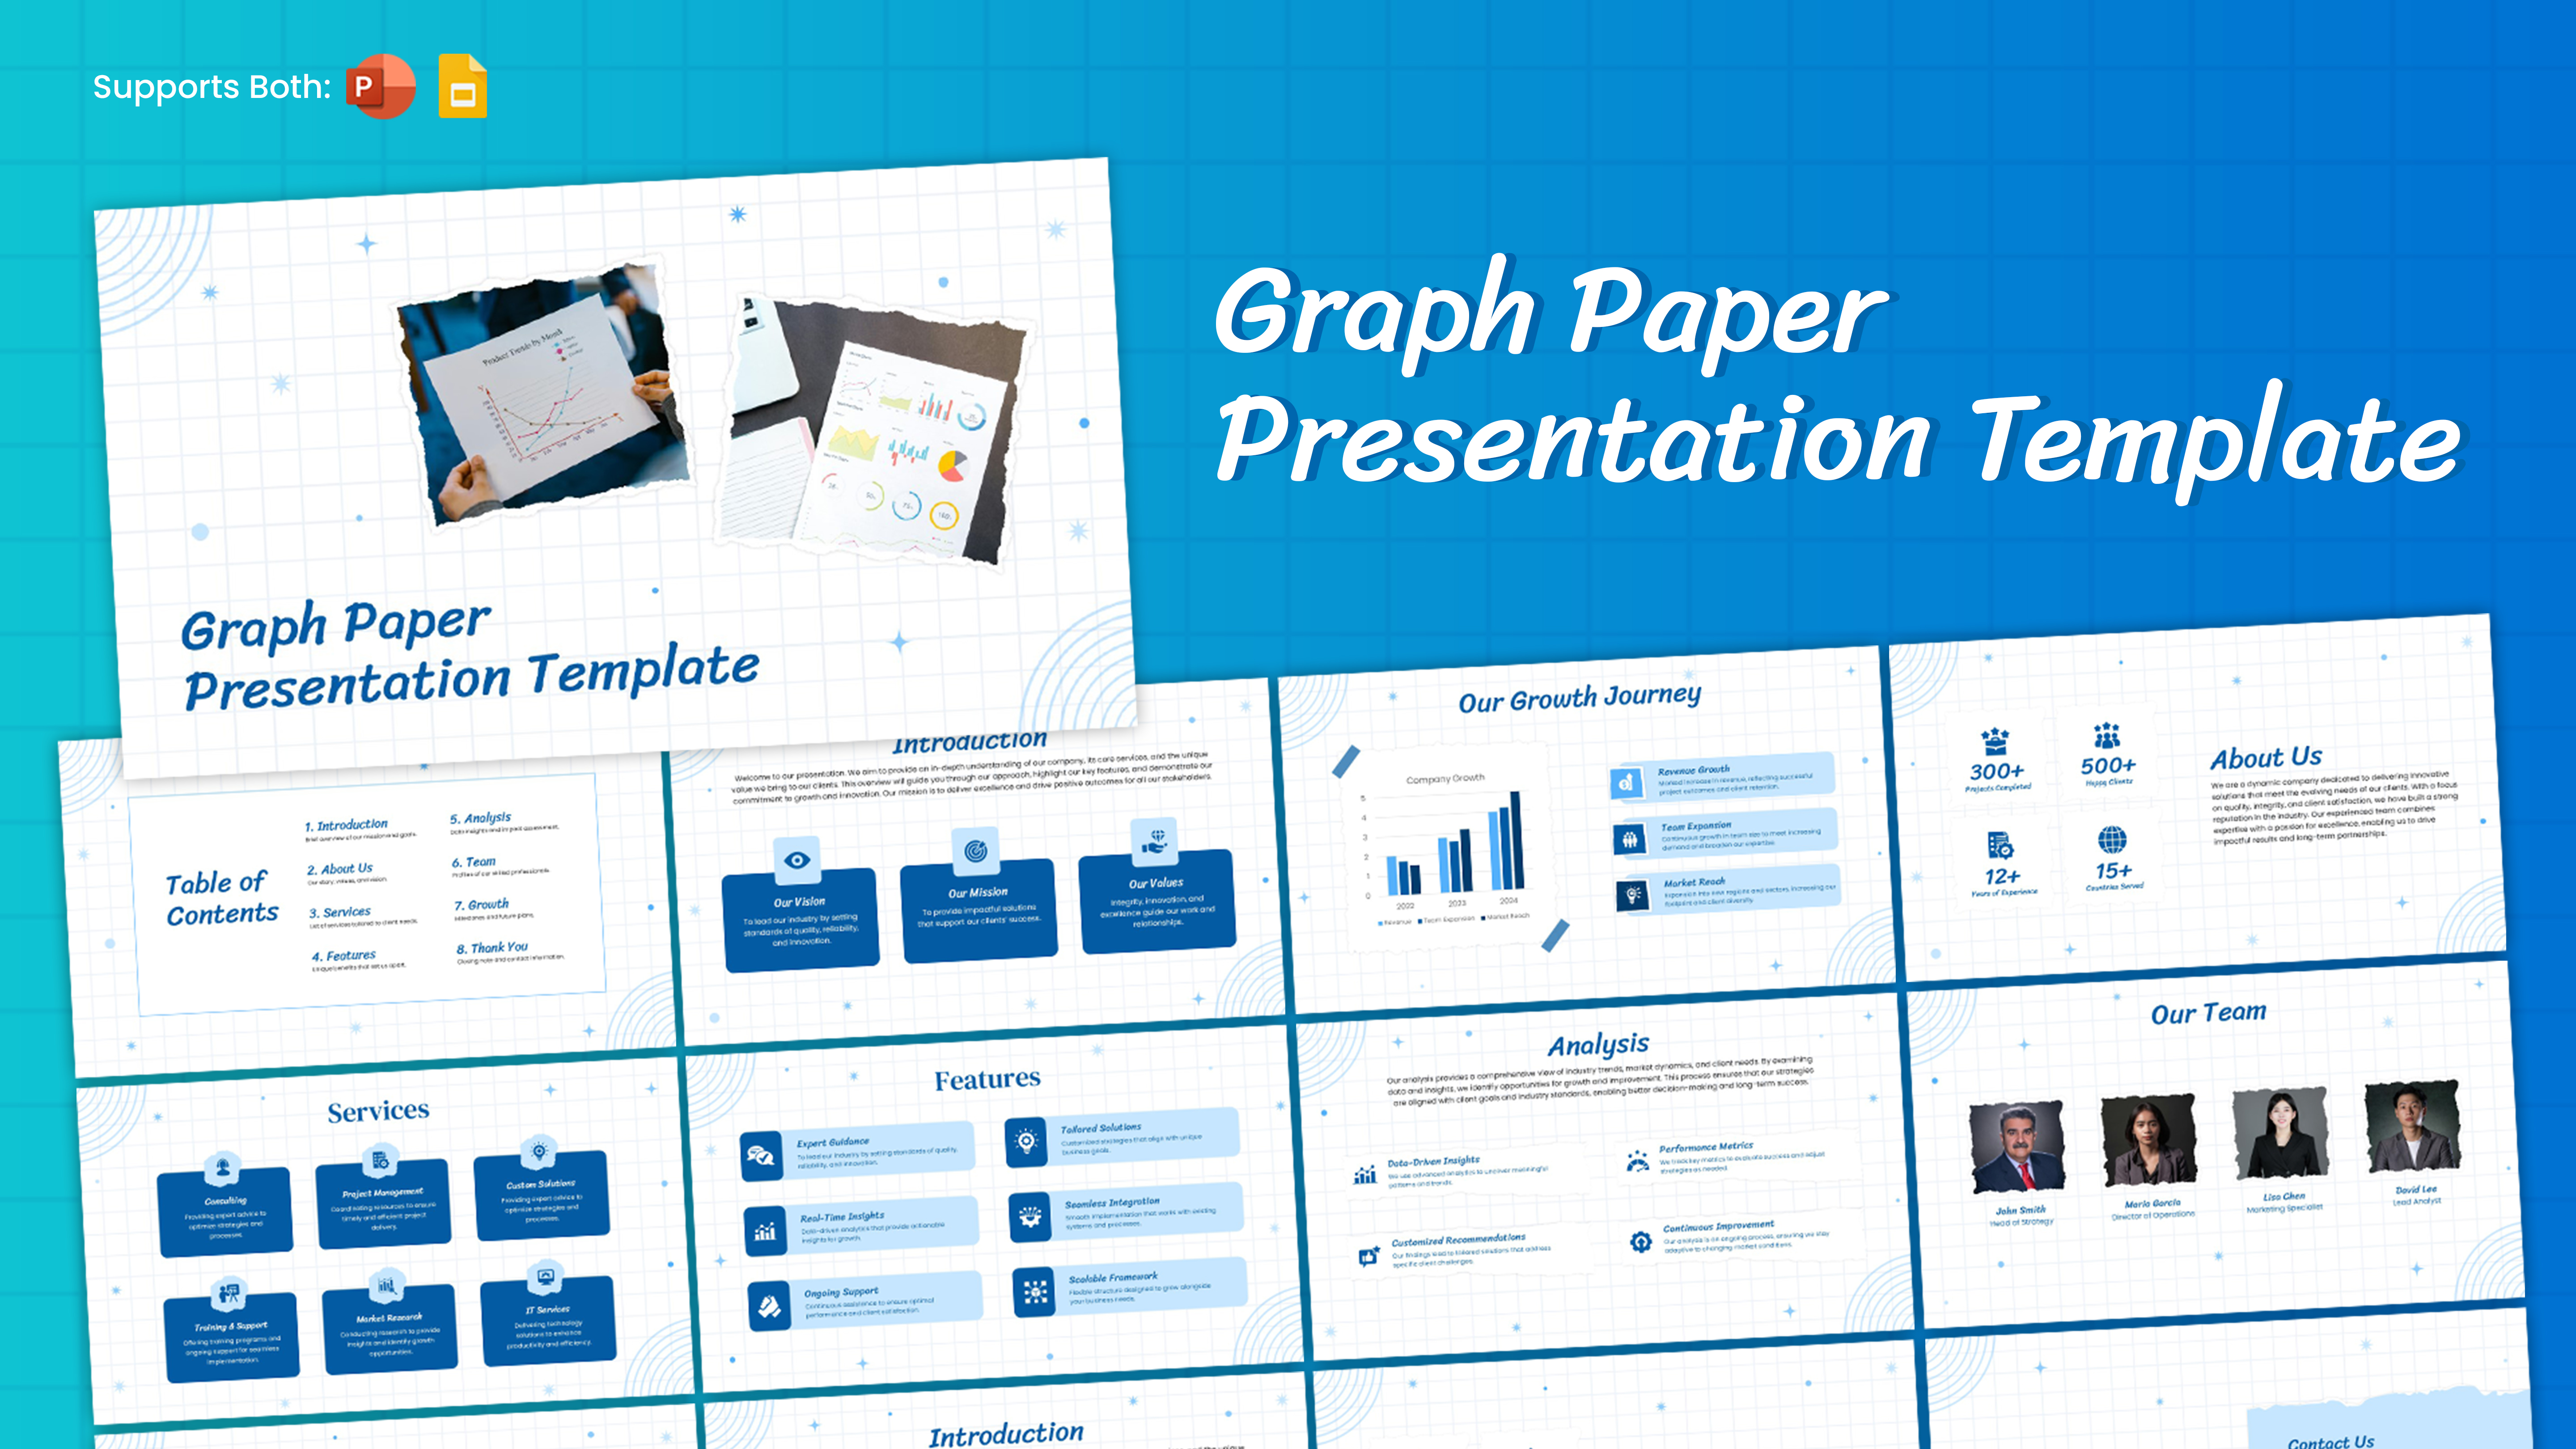
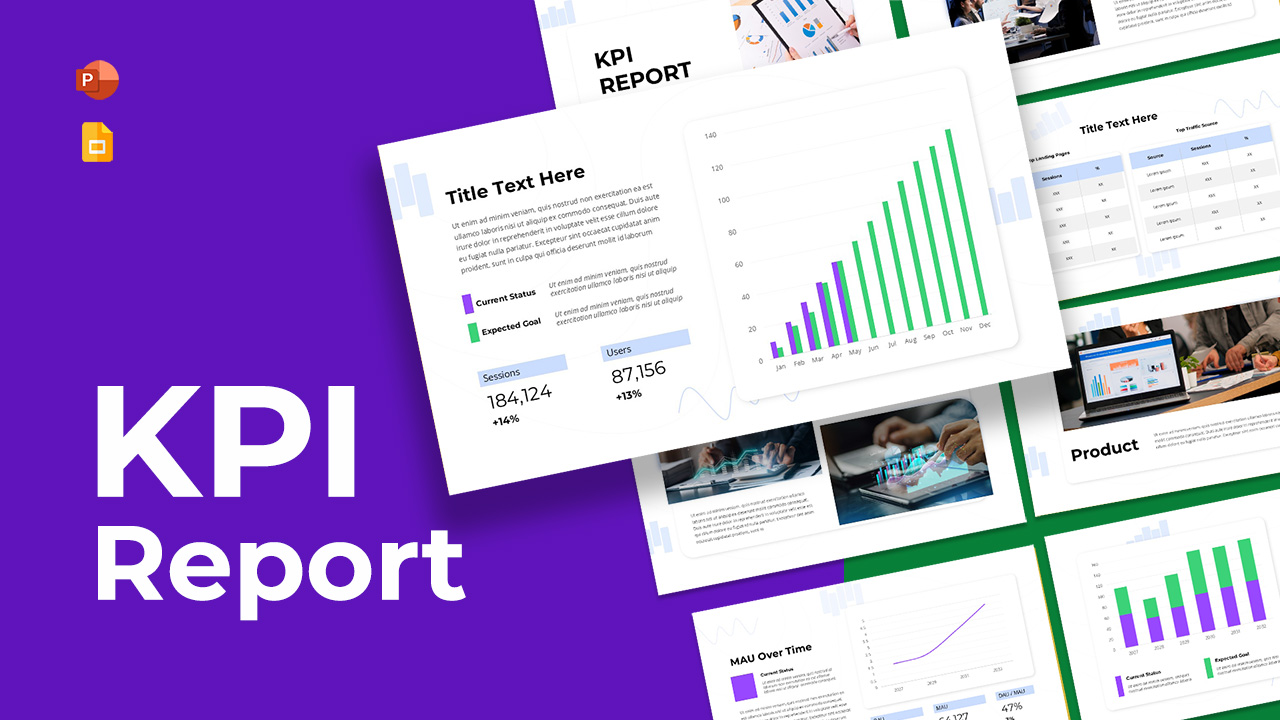
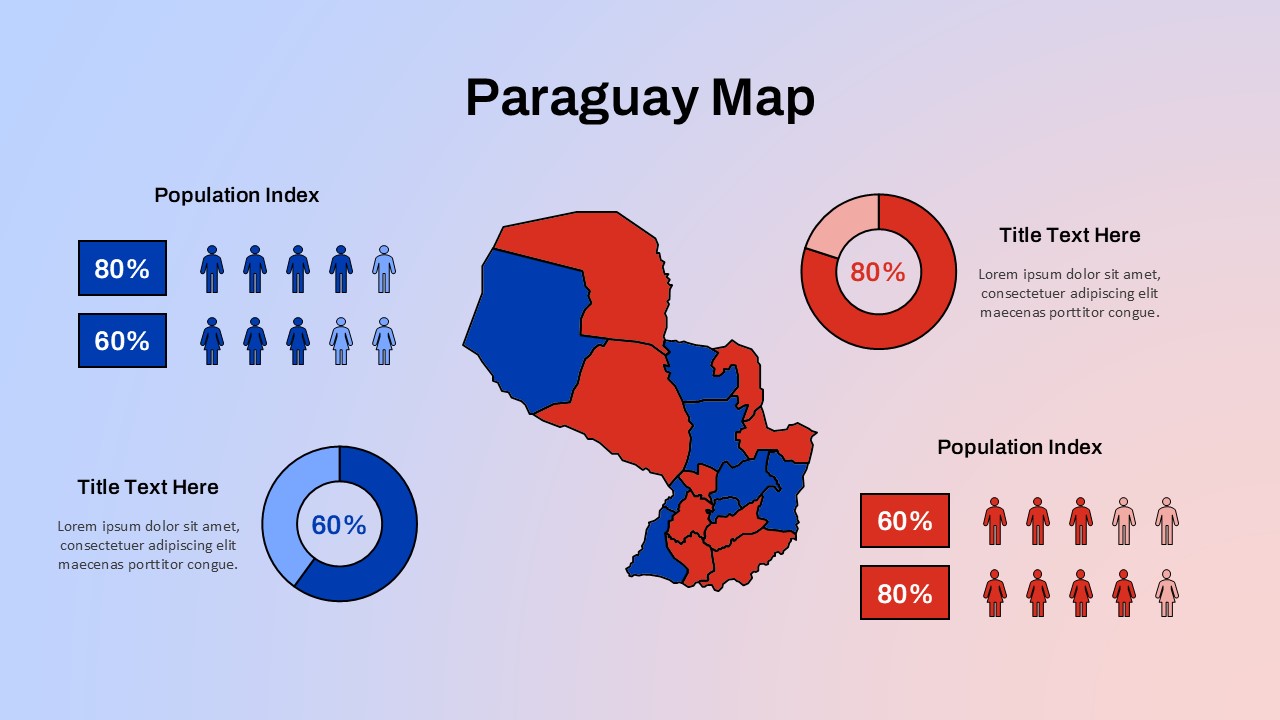
You May Also Like These Presentation Templates


- Free
- Free

- Free


- Free
- Free
- Free
- Free
- Free
- Free
- Free
- Free
- Free

- Free
- Free
- Free
- Free
- Free