NPS Analysis Dashboard Template for PowerPoint and Google Slides
NPS Analysis Dashboard Template for Customer Feedback Insights
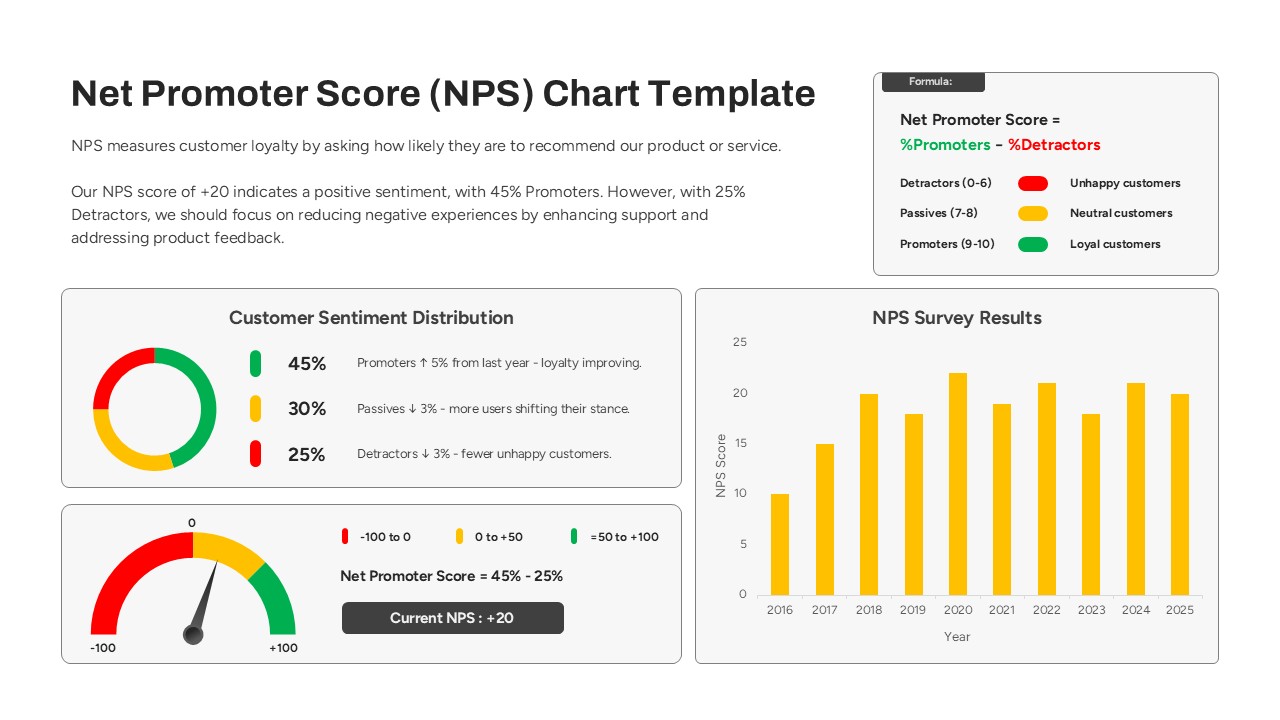
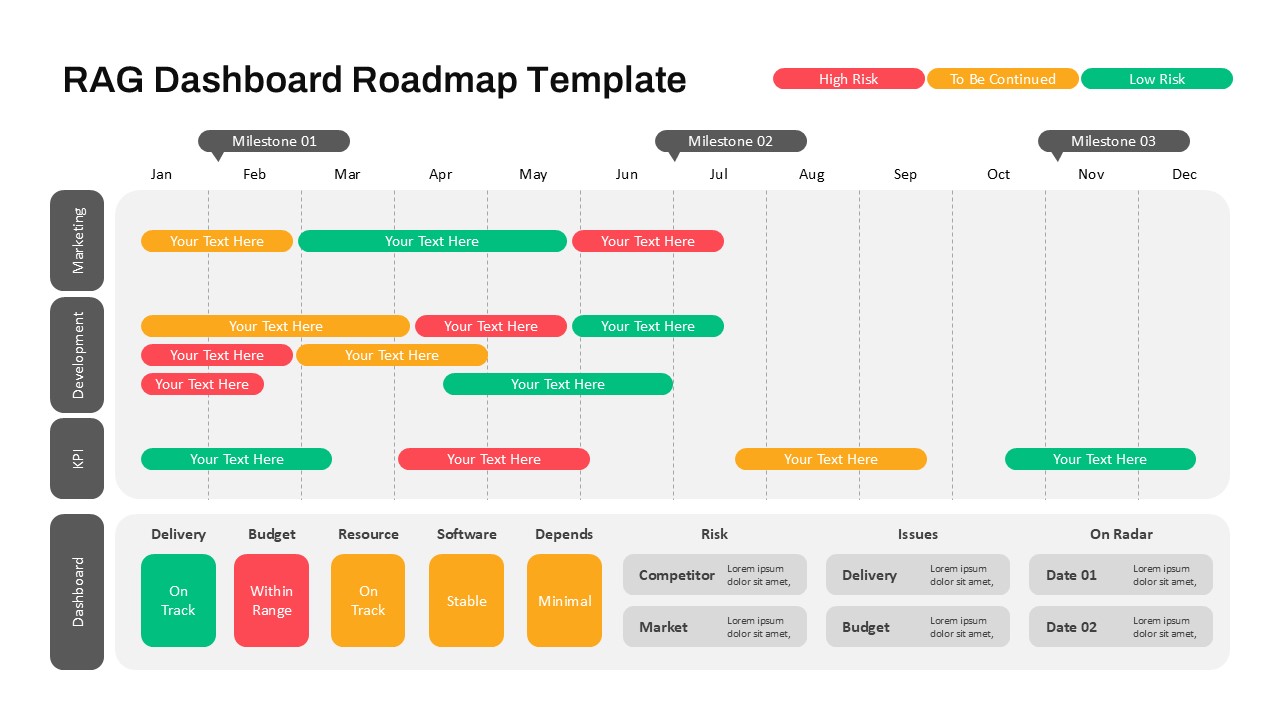
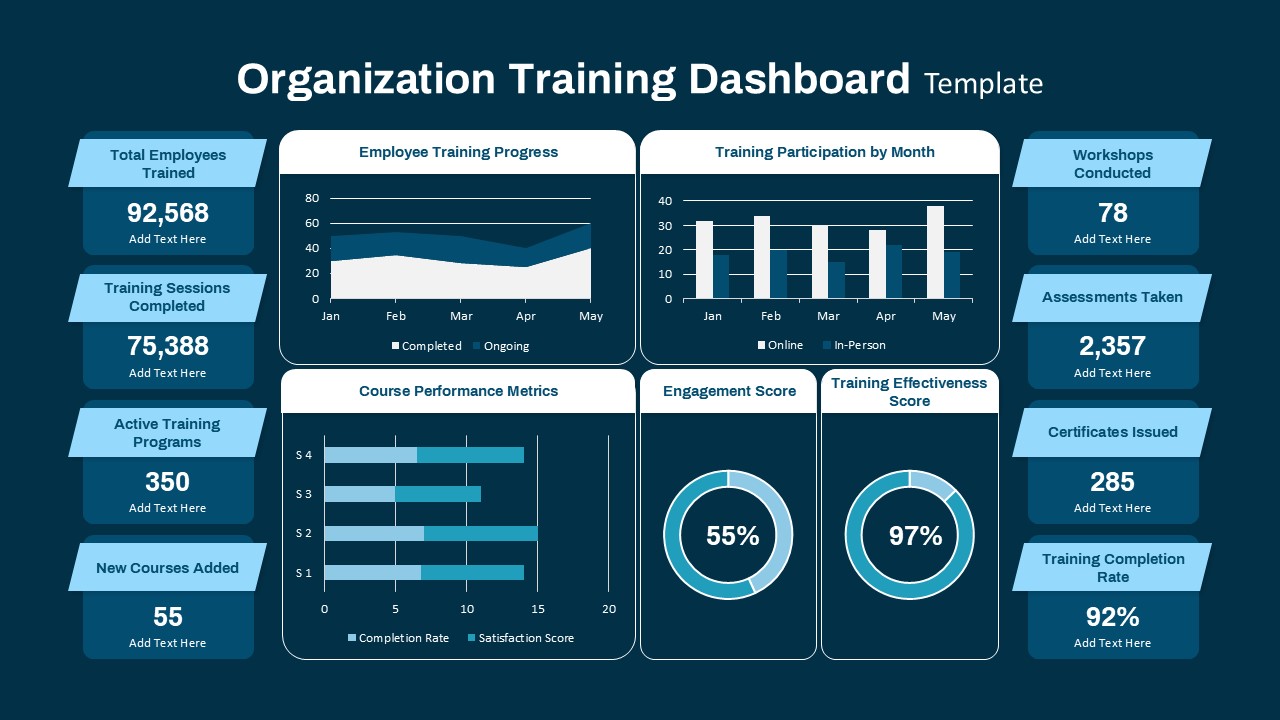
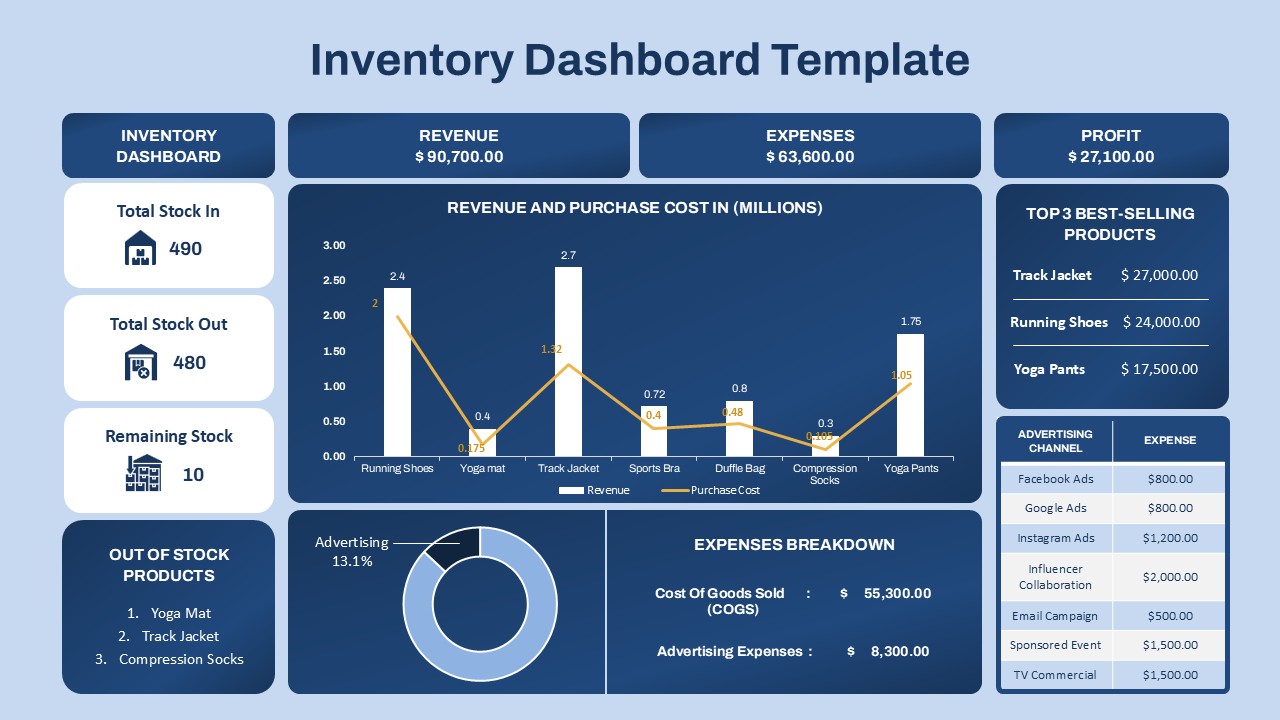
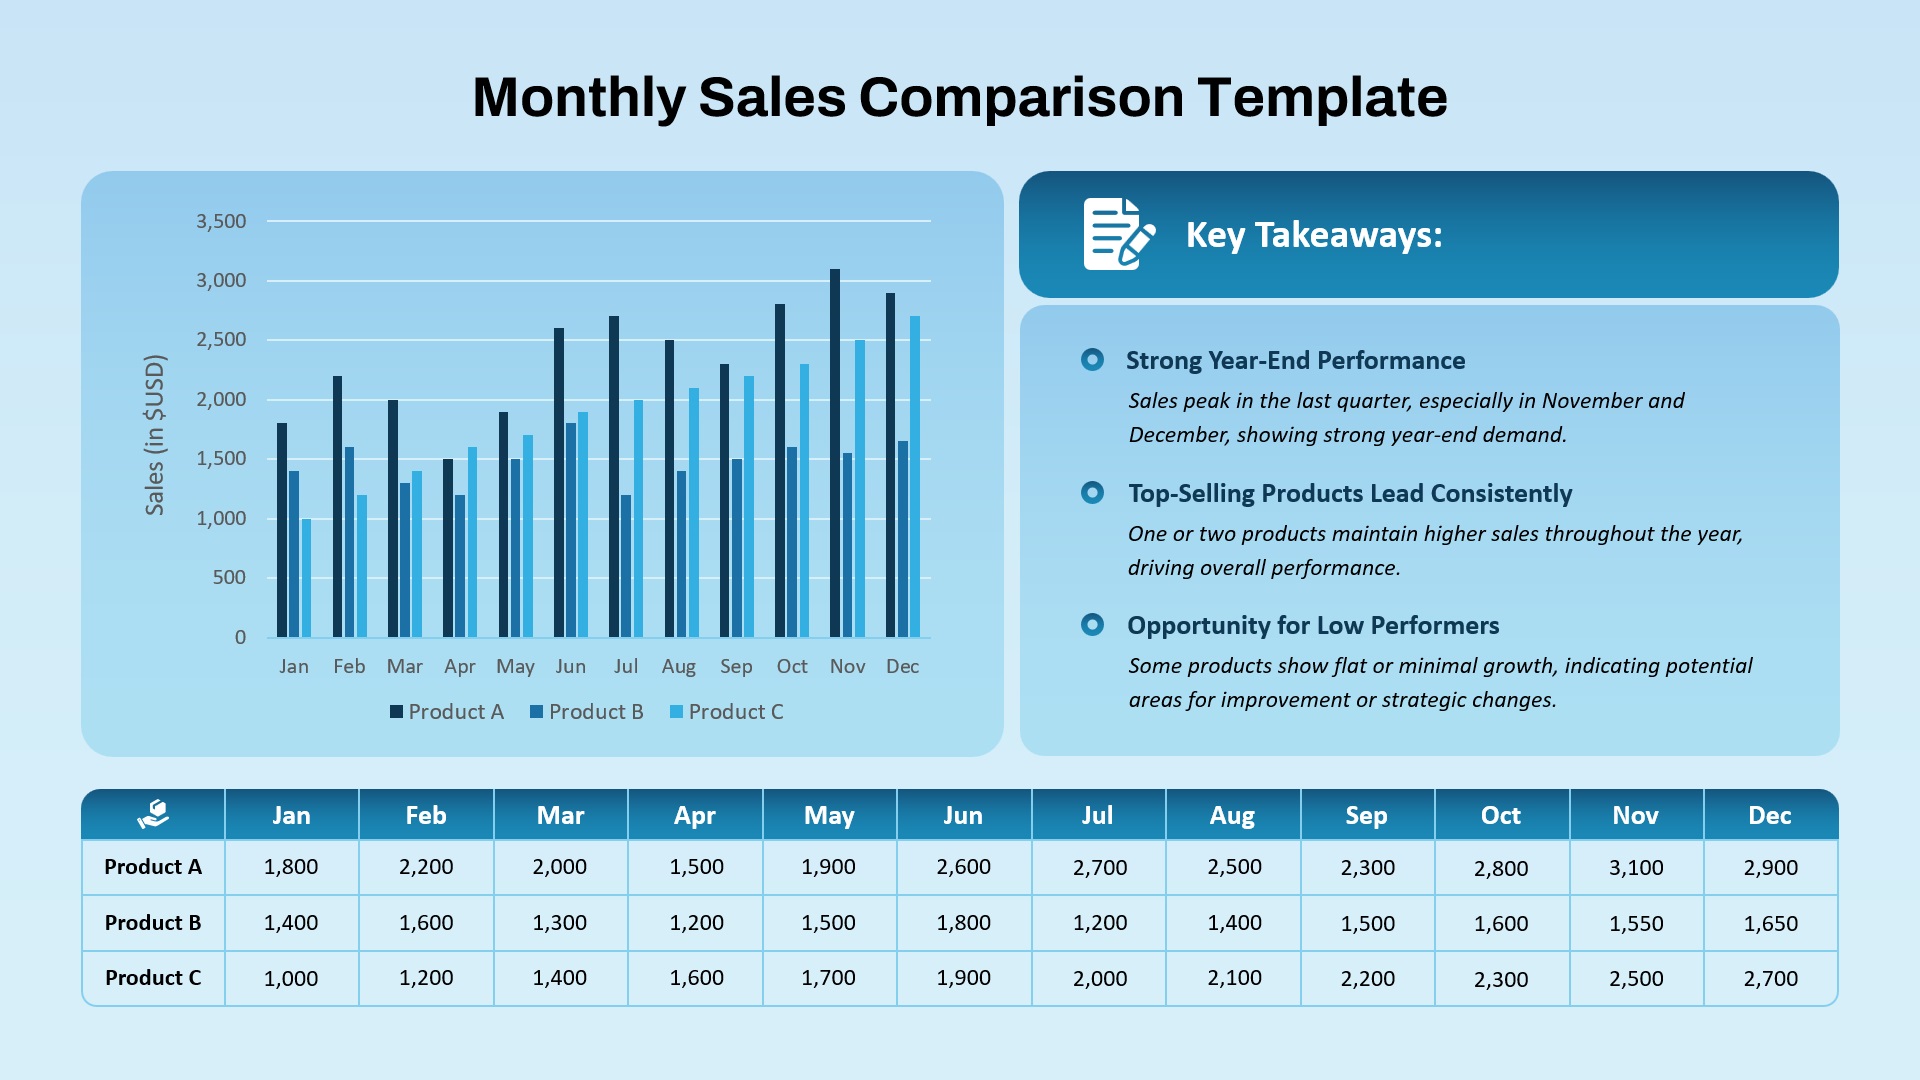
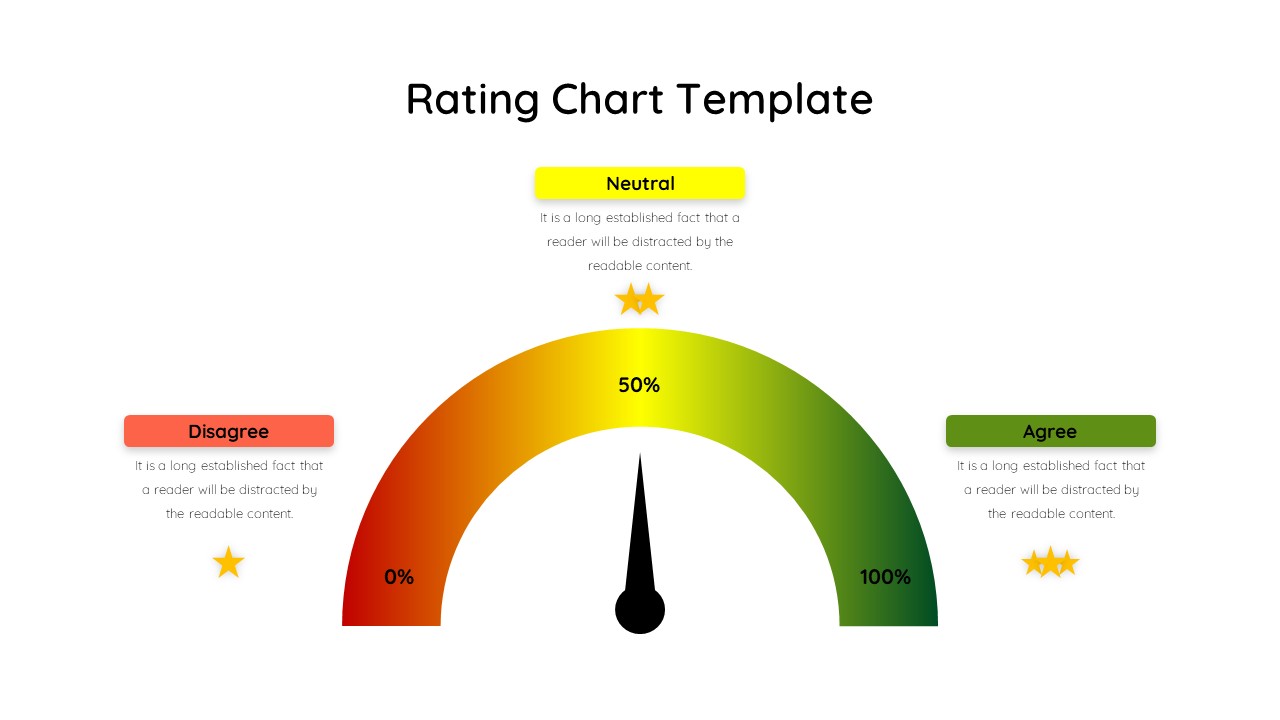
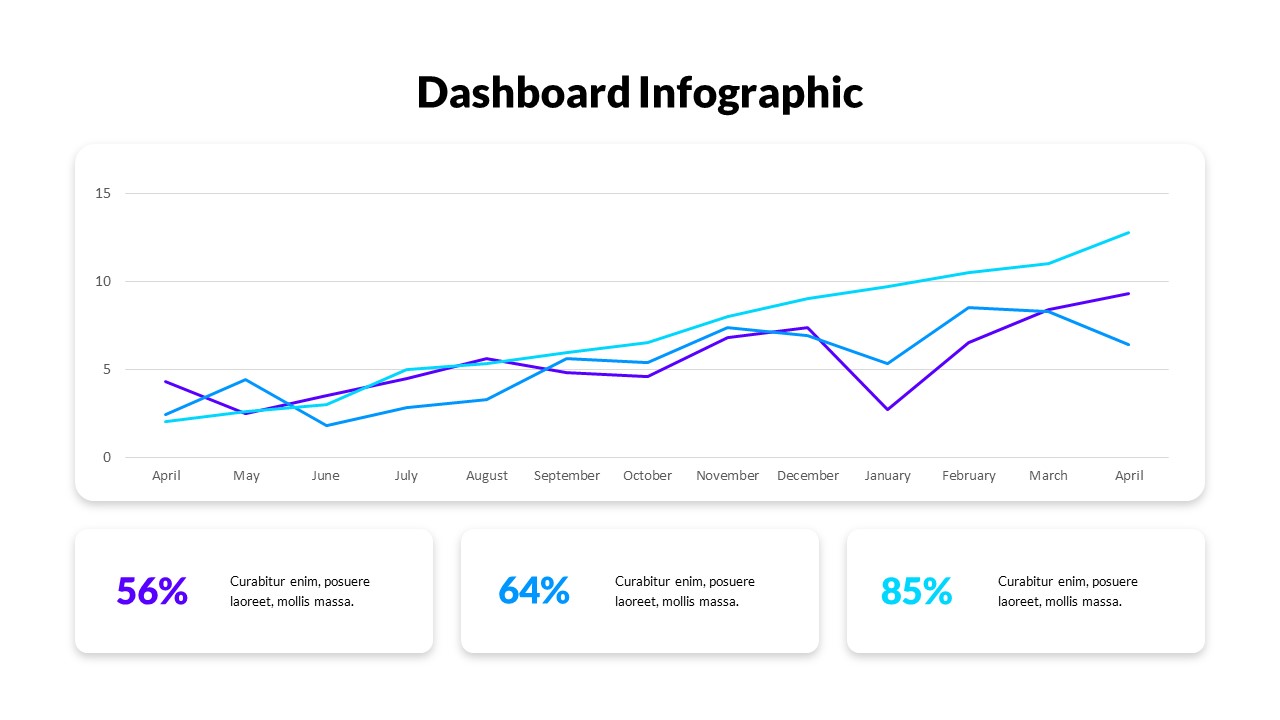
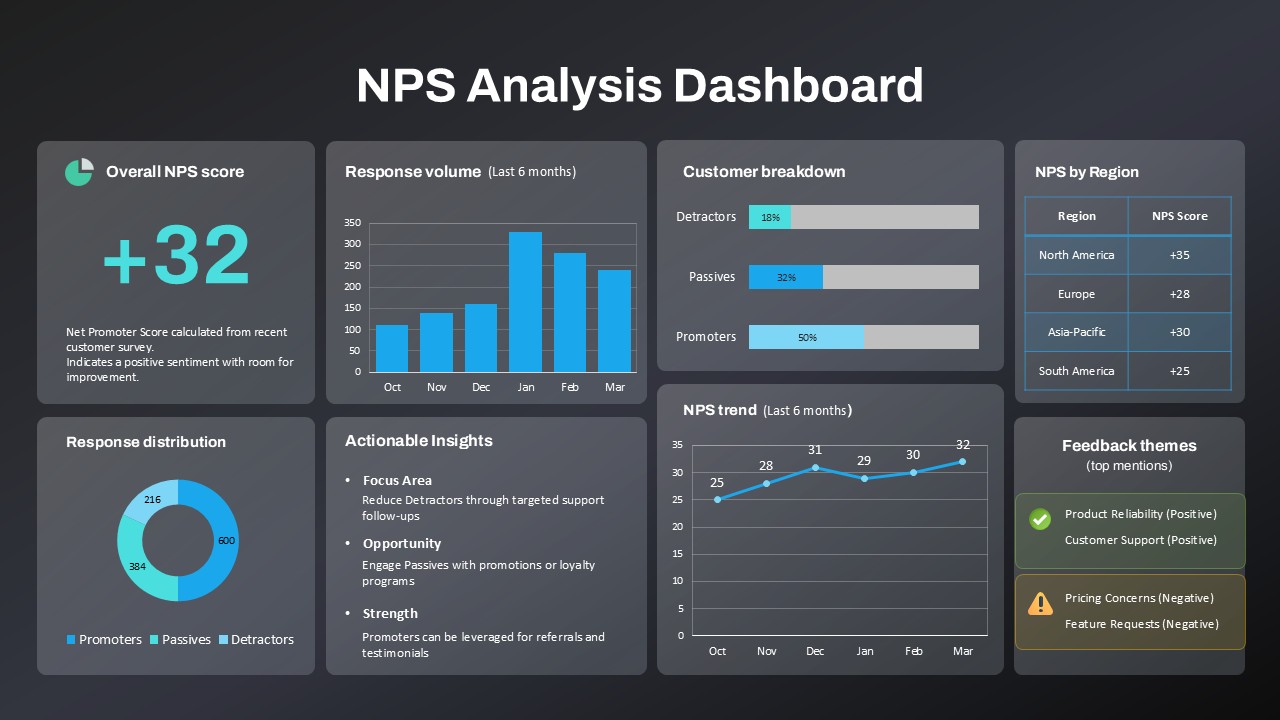
The NPS Analysis Dashboard Template is a powerful visual tool designed to help organizations track and interpret Net Promoter Score (NPS) metrics over time. Ideal for marketing, customer success, and operations teams, this dashboard slide powerpoint presents a comprehensive view of customer sentiment through key indicators such as overall NPS score, response distribution, feedback volume, and trends over a six-month period.
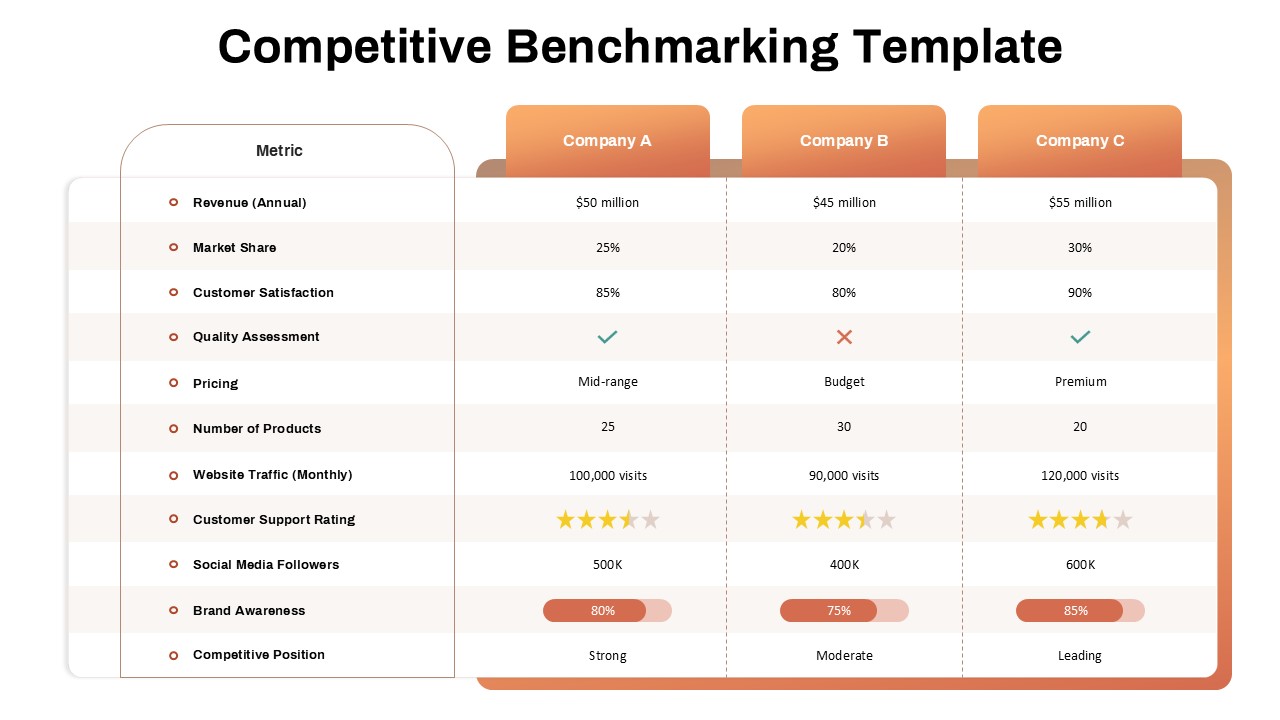
With a clear layout and data-driven visuals, the template showcases customer segmentation—Promoters, Passives, and Detractors—alongside actionable insights to guide business decisions. It emphasizes focus areas to reduce detractors, highlights opportunities to engage passives, and leverages strengths by promoting referrals and testimonials from satisfied customers.
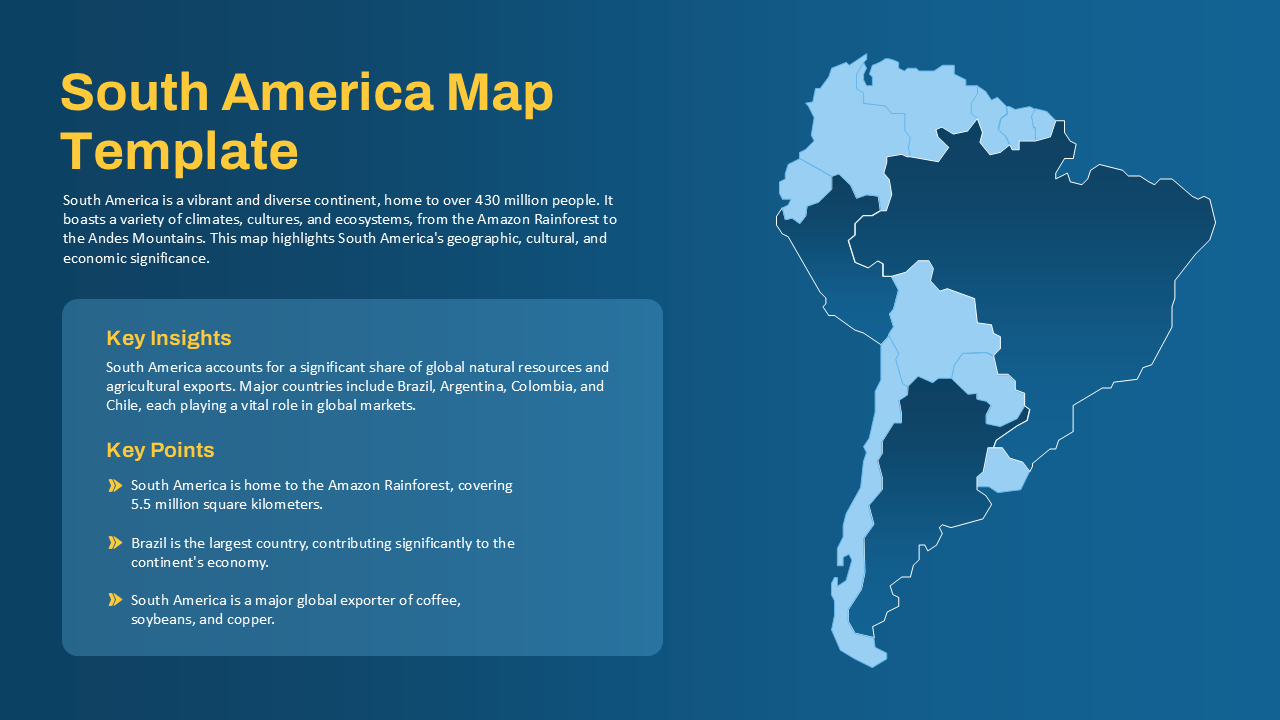
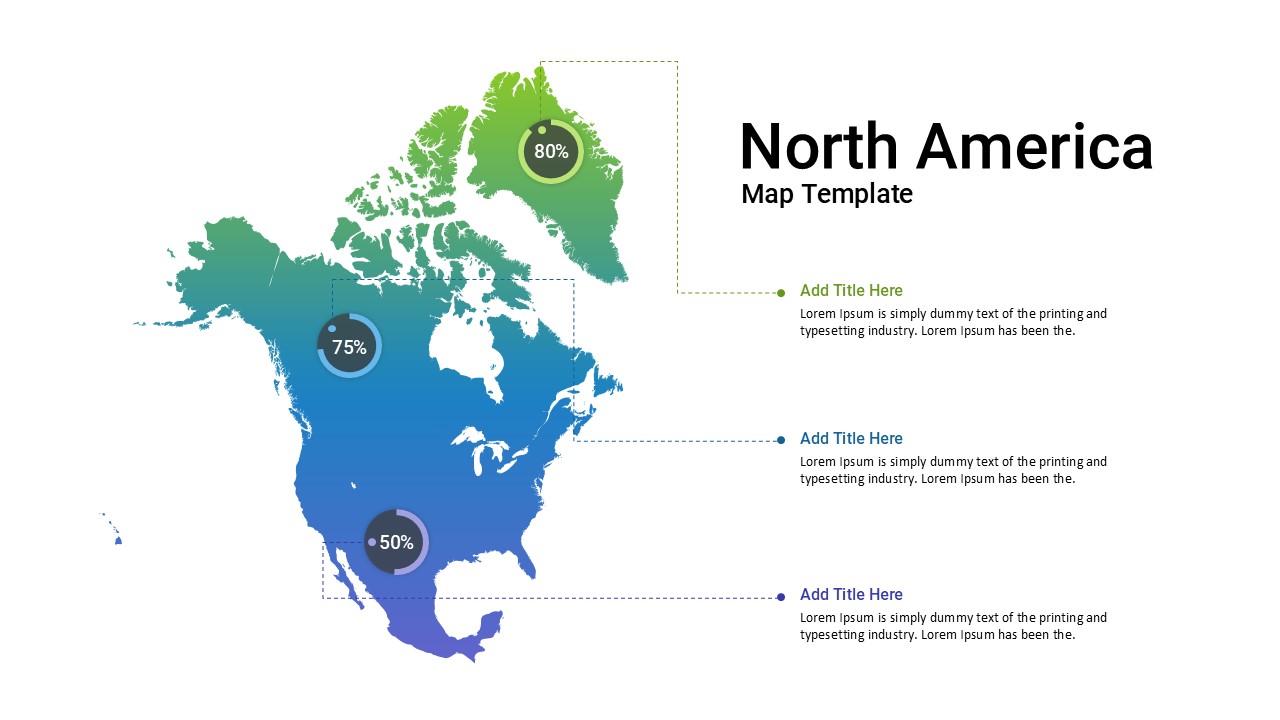
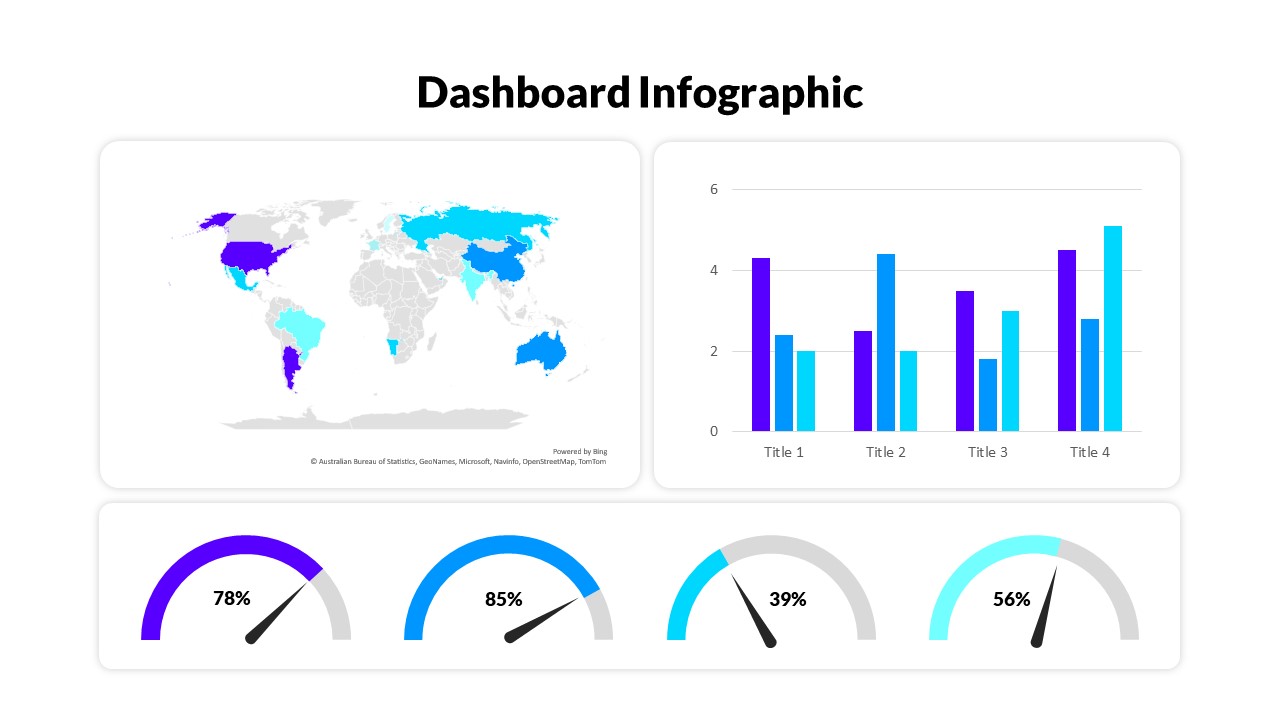
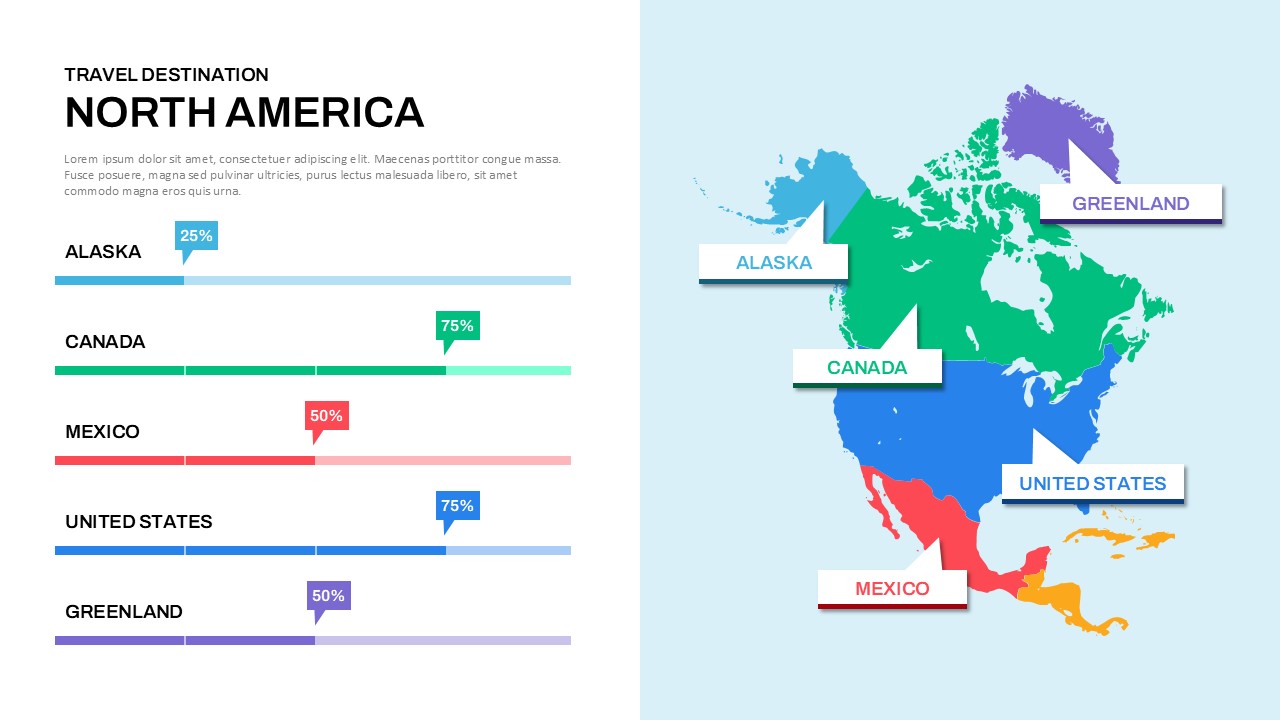
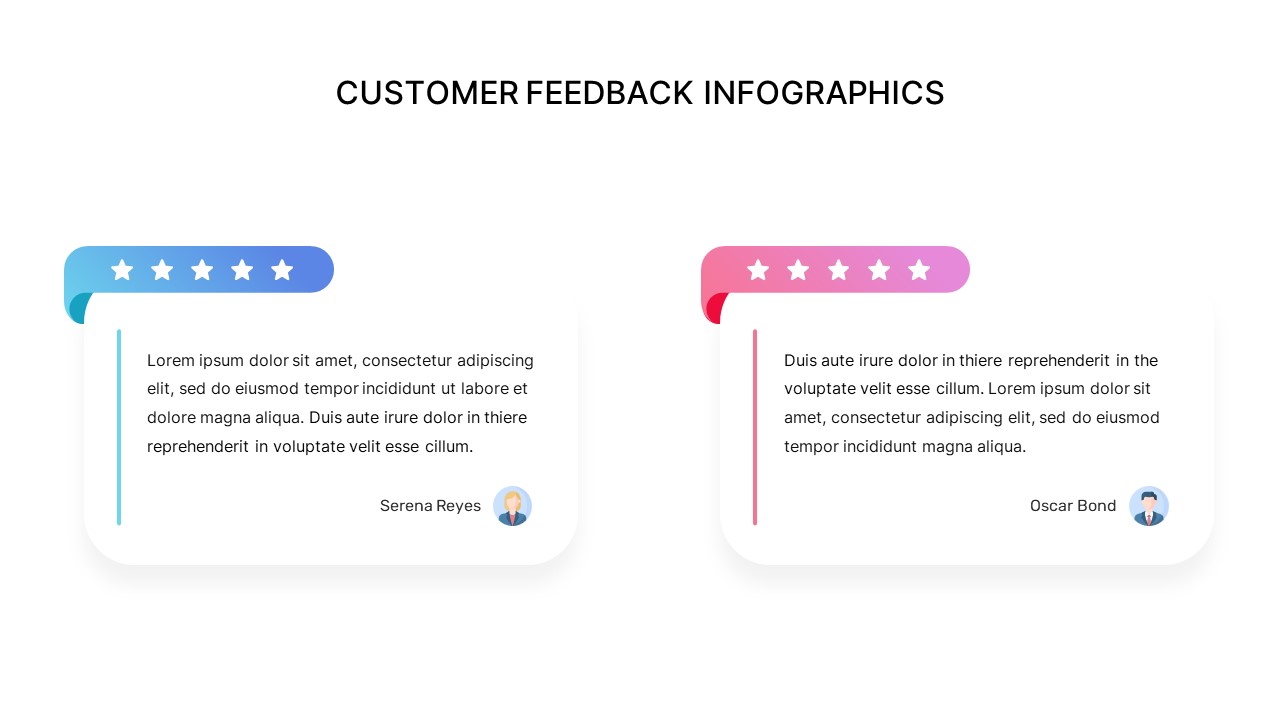
The regional NPS breakdown helps identify performance variations across markets including North America, Europe, Asia-Pacific, and South America. Additionally, a feedback themes section summarizes top positive mentions like product reliability and customer support, while also flagging concerns such as pricing and feature requests.
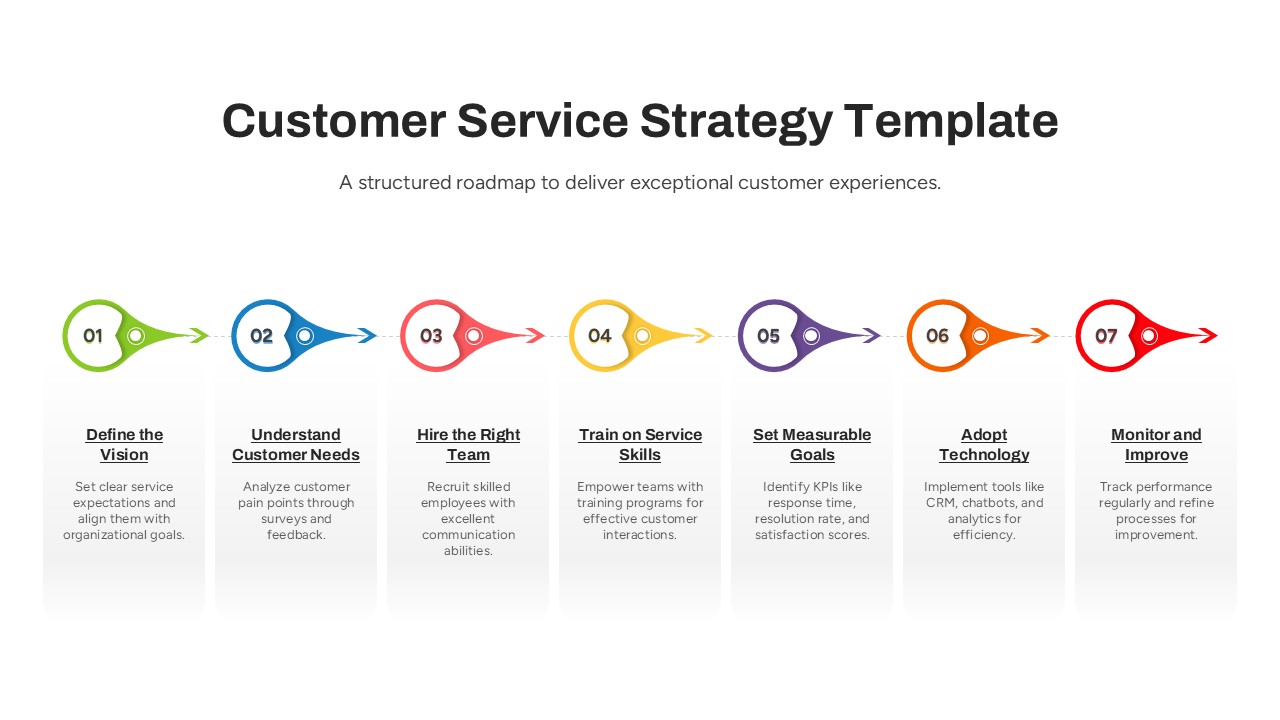
Perfect for performance reviews, quarterly reports, and strategy meetings, this editable dashboard slide template is compatible with both PowerPoint and Google Slides. It allows teams to present complex data in an easy-to-understand format, fostering informed discussions and continuous customer experience improvements.
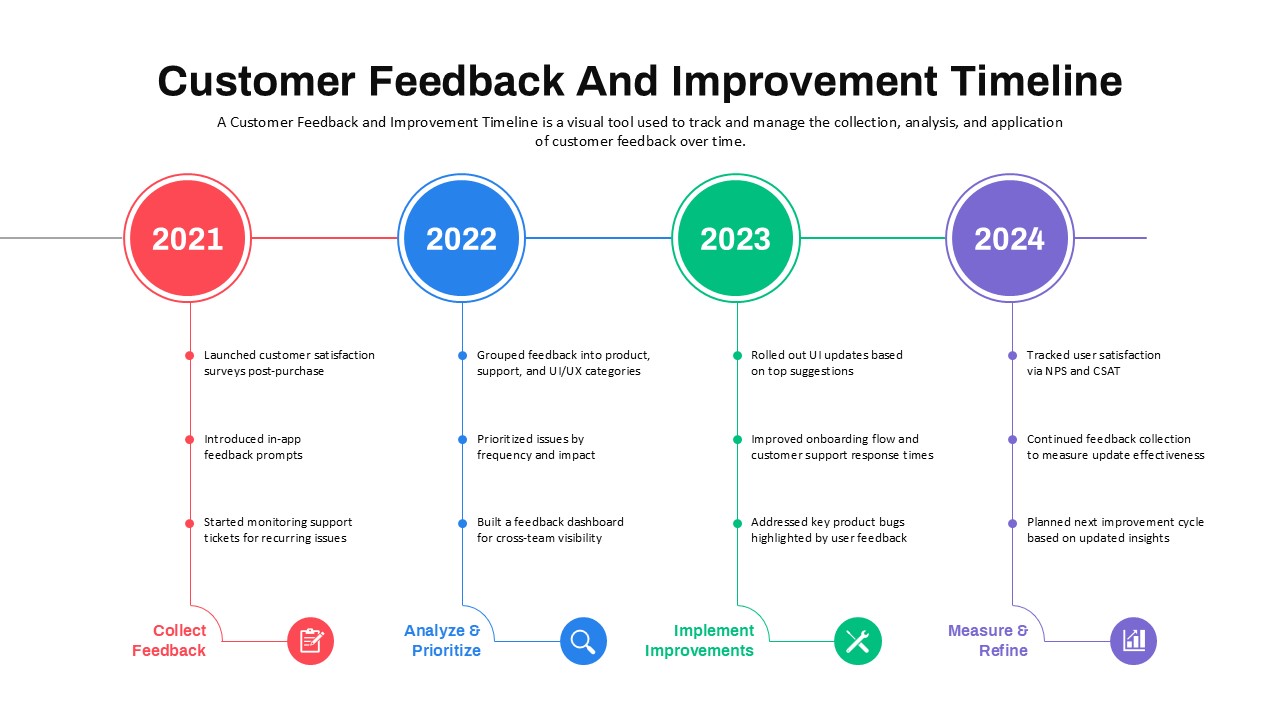
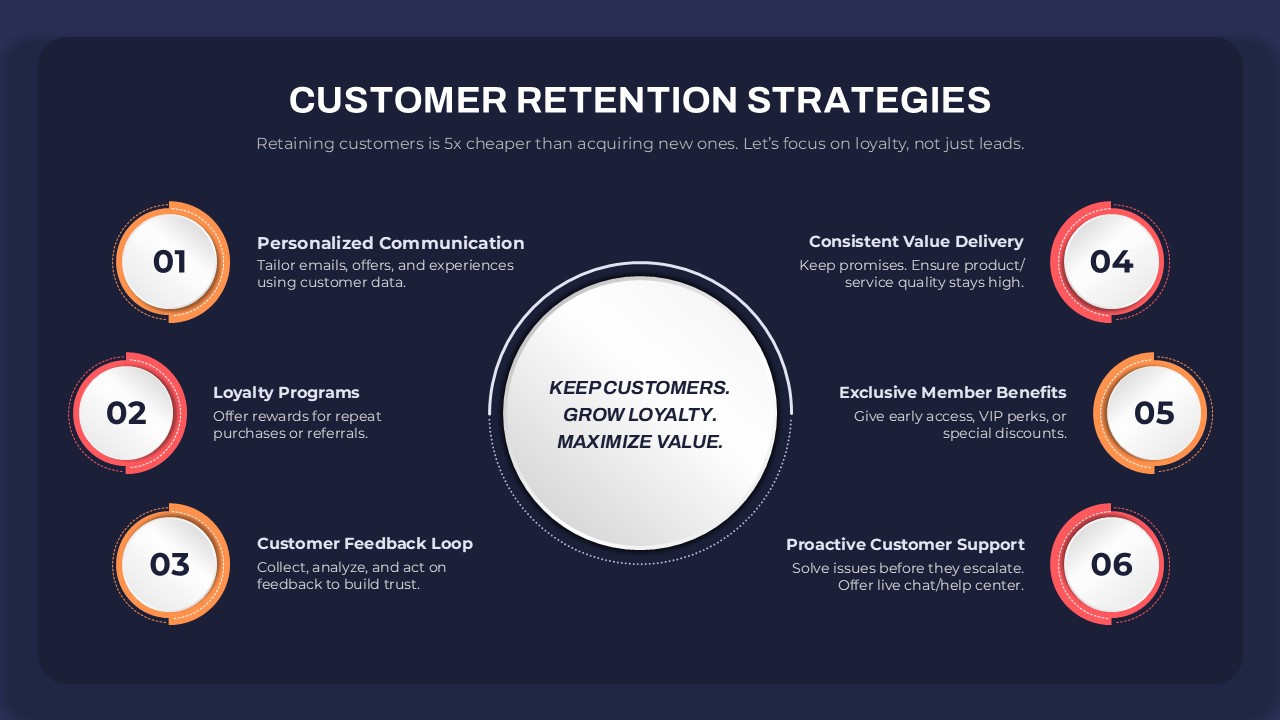
Use this dashboard to not only track NPS but to build a structured feedback loop that enhances retention and drives customer loyalty through actionable data.
See more

Aspect Ratio
16:9Item ID
SKT03785
Features of this template
Other User Cases of the Template
Customer satisfaction reporting, executive dashboards, quarterly business reviews, performance benchmarking, marketing campaign analysis, product feedback summaries, investor presentations, customer success strategy planning
FAQs
You May Also Like These Presentation Templates


- Free

- Free
- Free
- Free

- Free

- Free
- Free
- Free