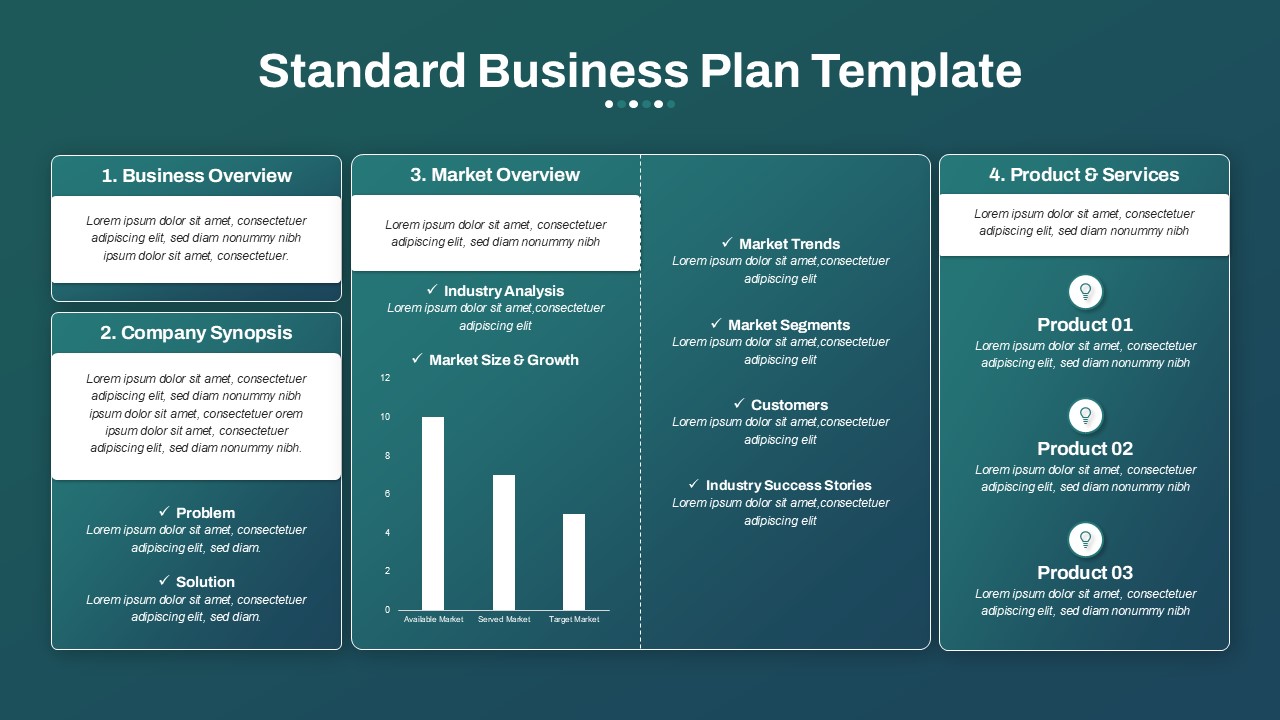
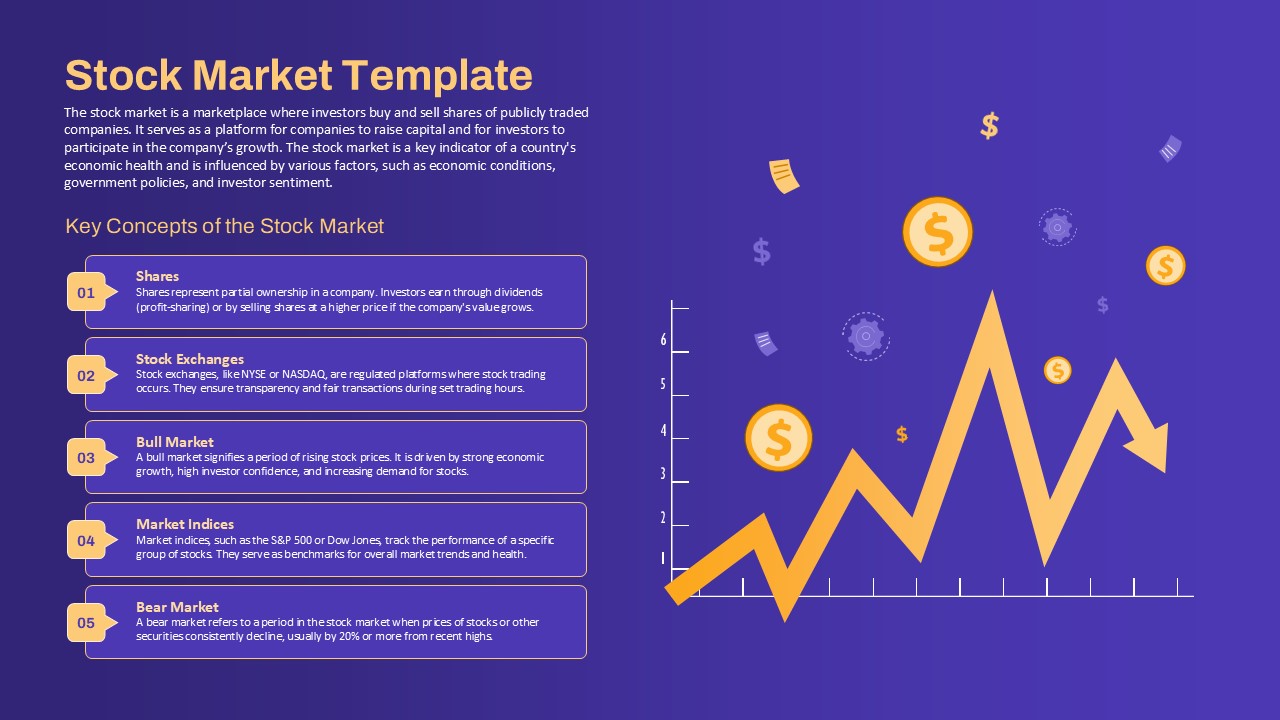
Market Share Distribution Pie Chart PPT Template
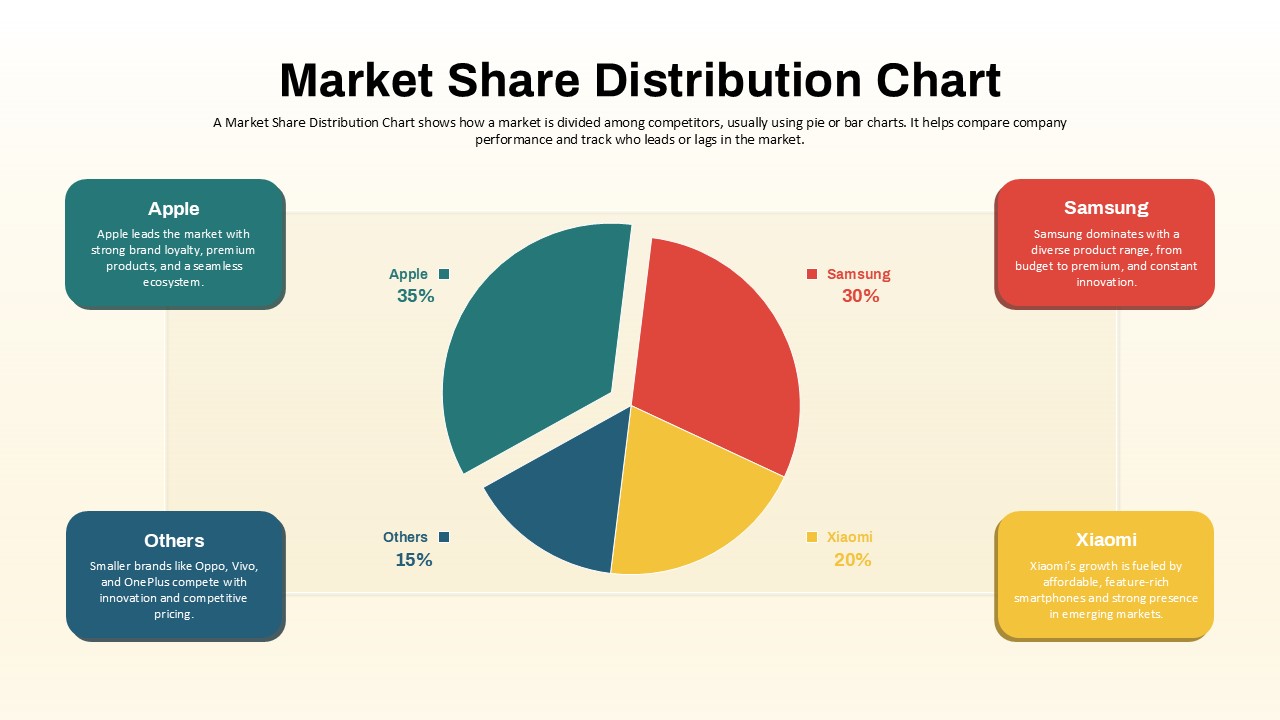
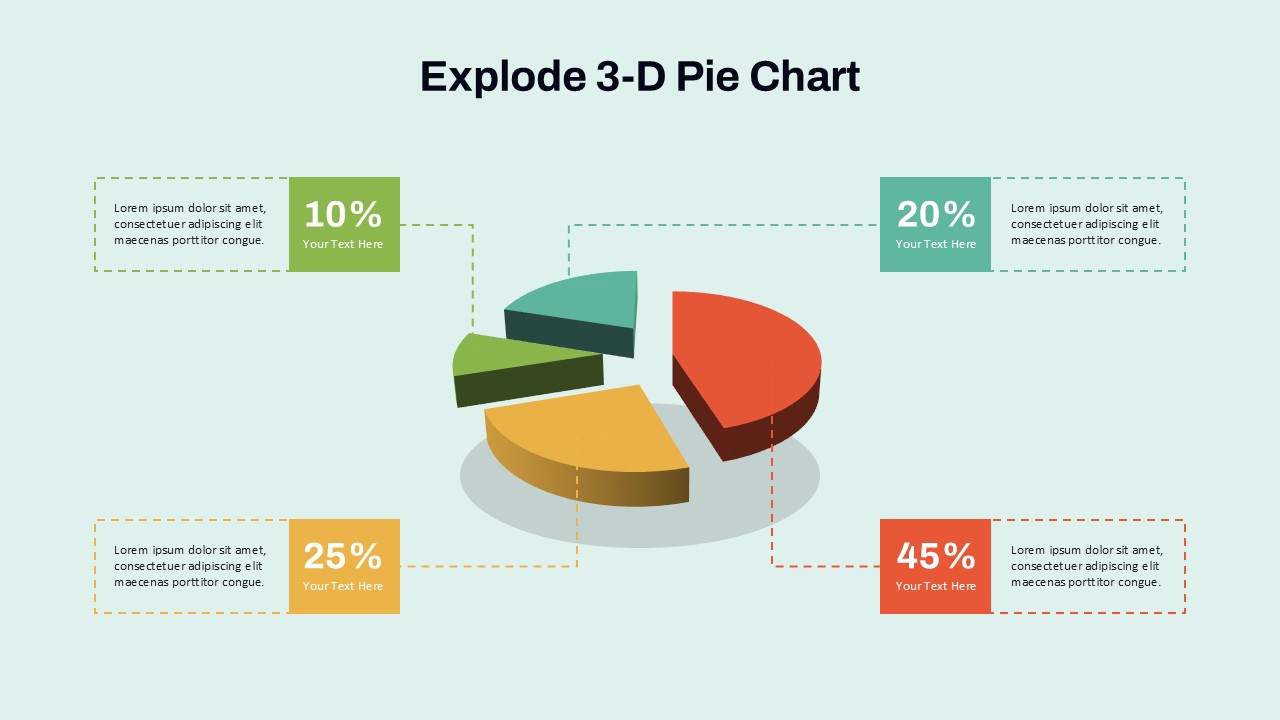
Visualize your market landscape effectively with this Market Share Distribution Pie Chart PPT Template. This template provides a clear and engaging pie chart that illustrates how market share is divided among key competitors, making it easier to analyze market leaders and emerging challengers.
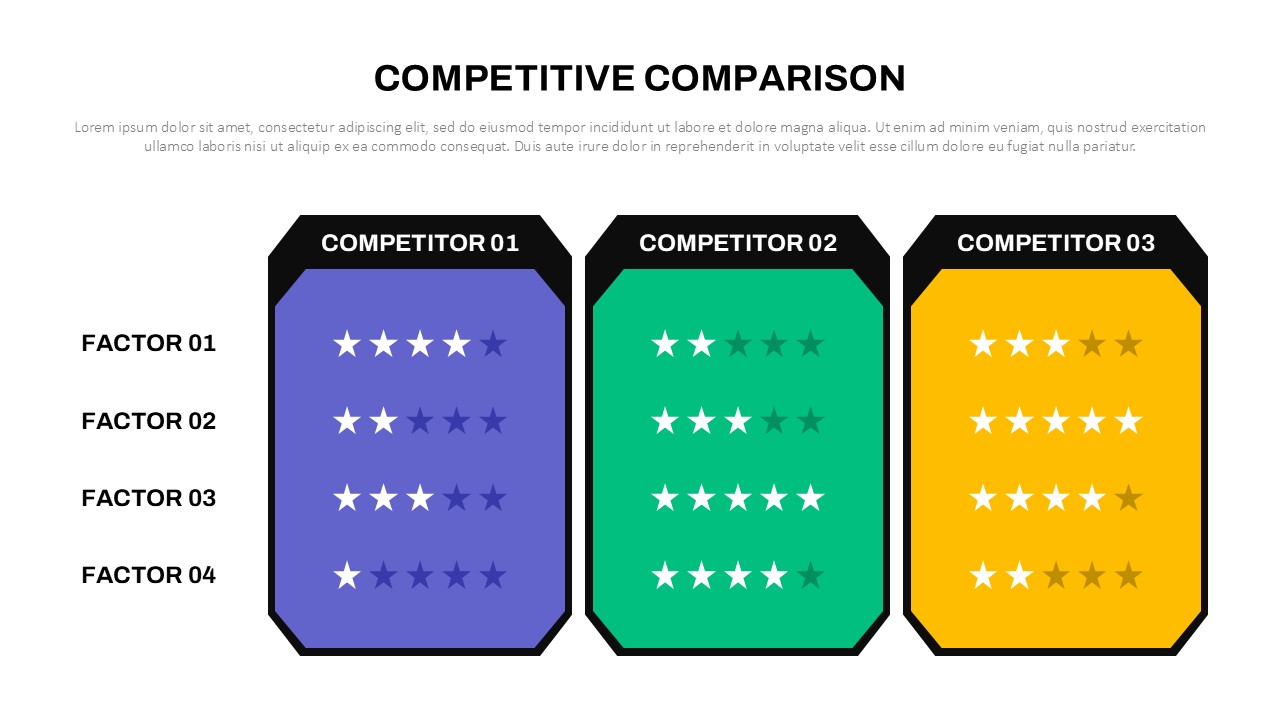
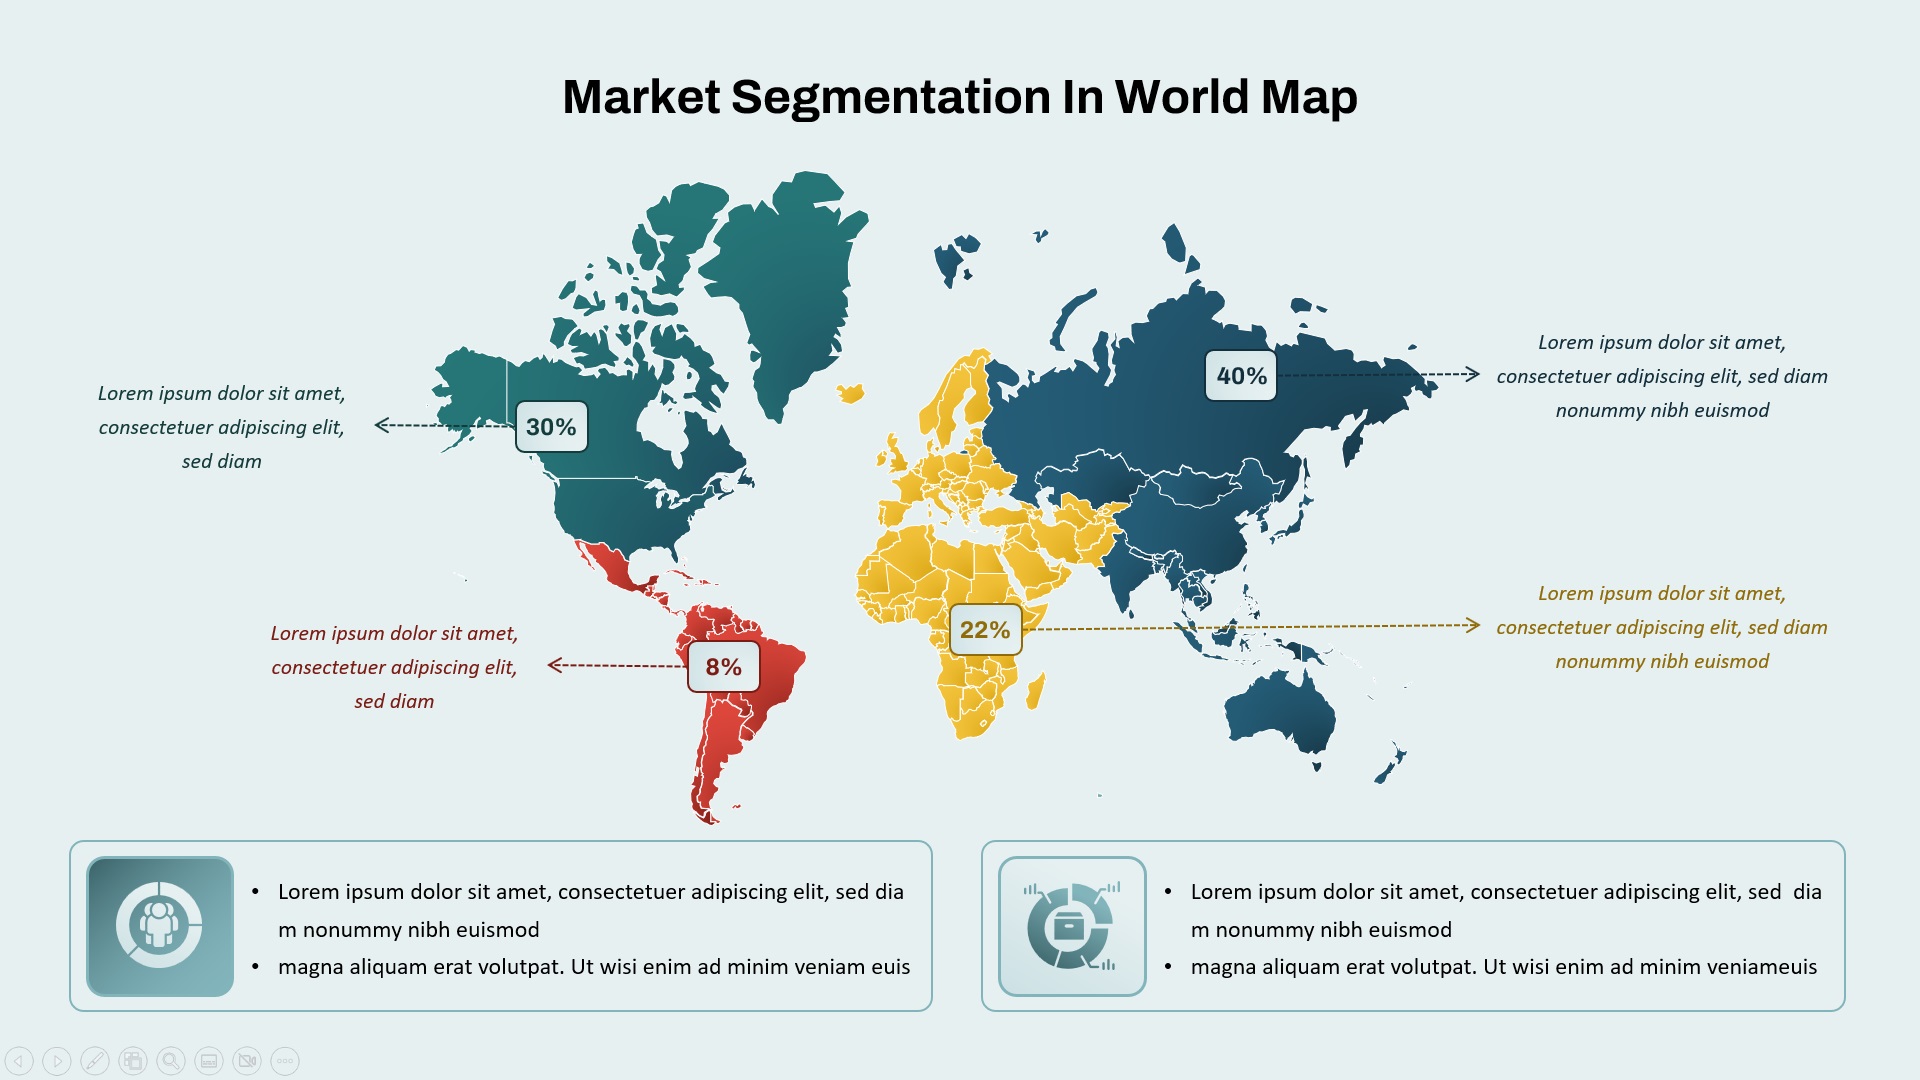
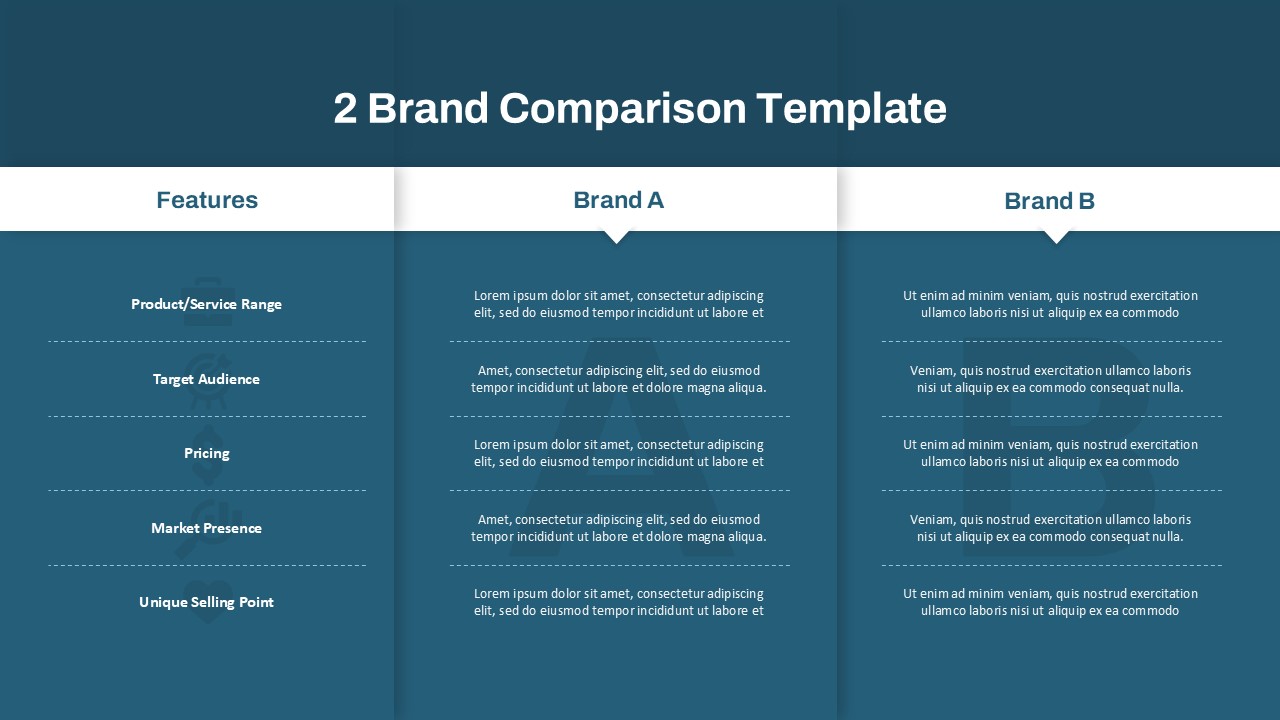
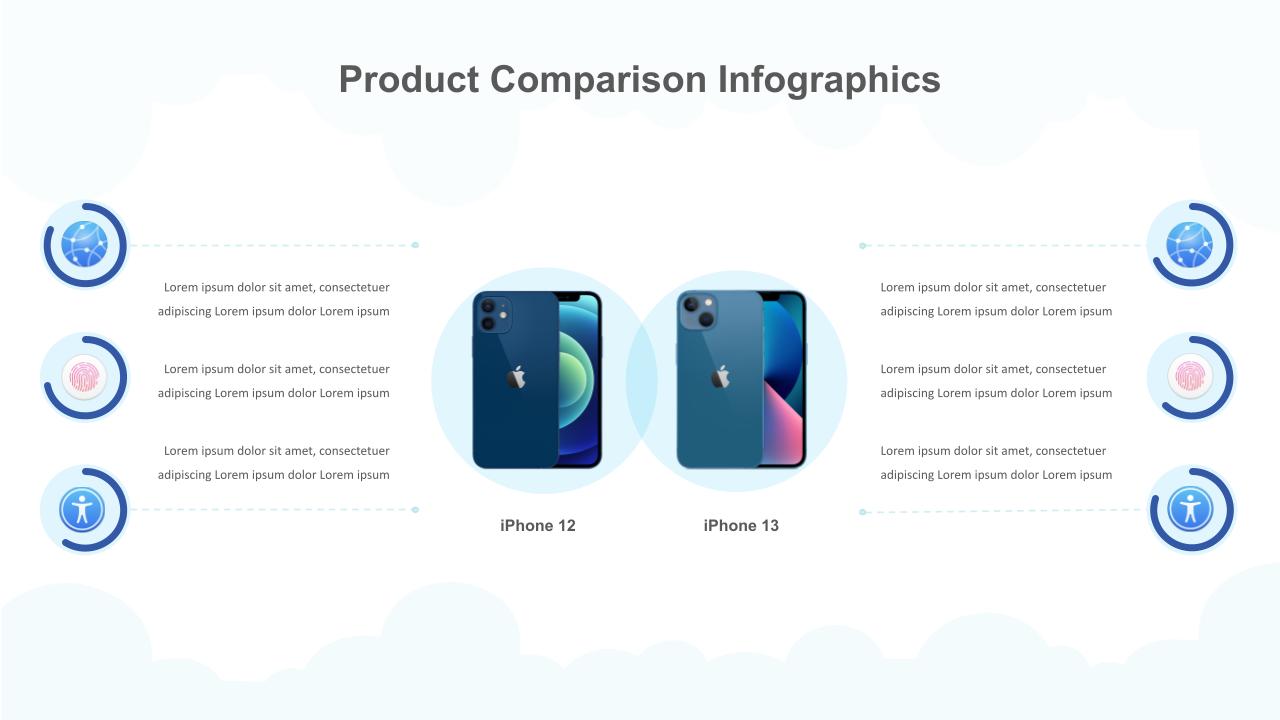
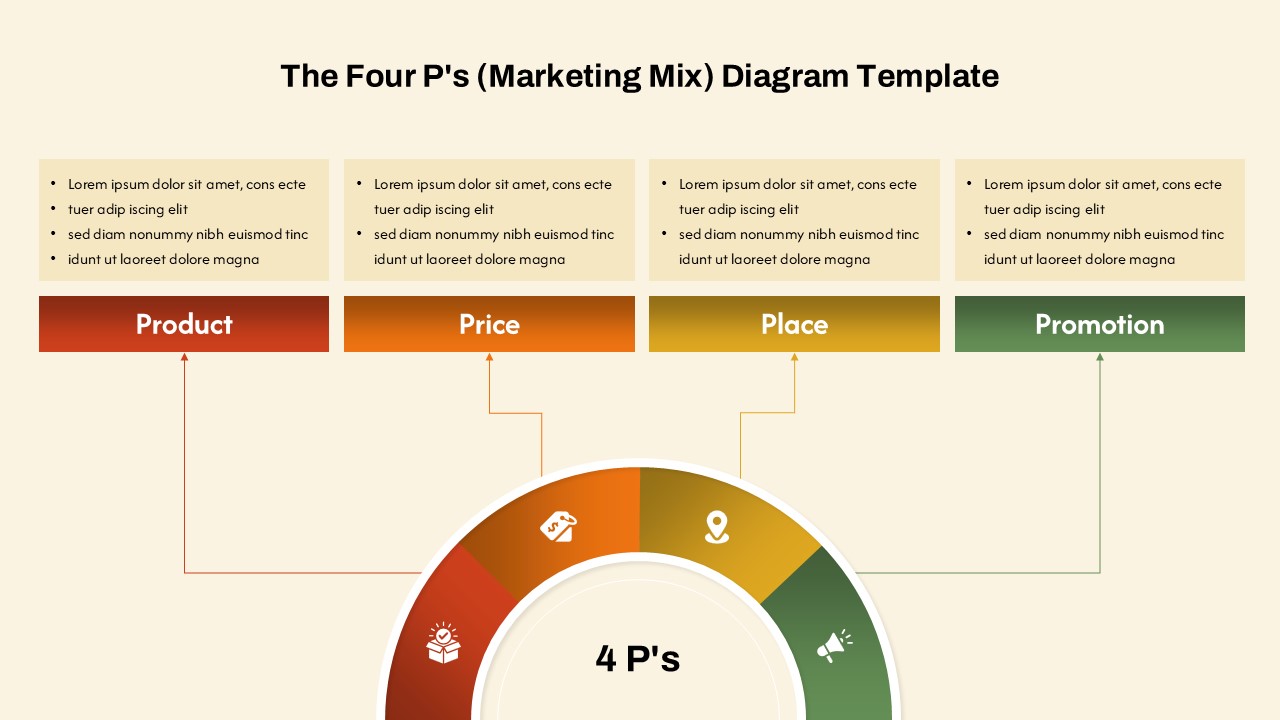
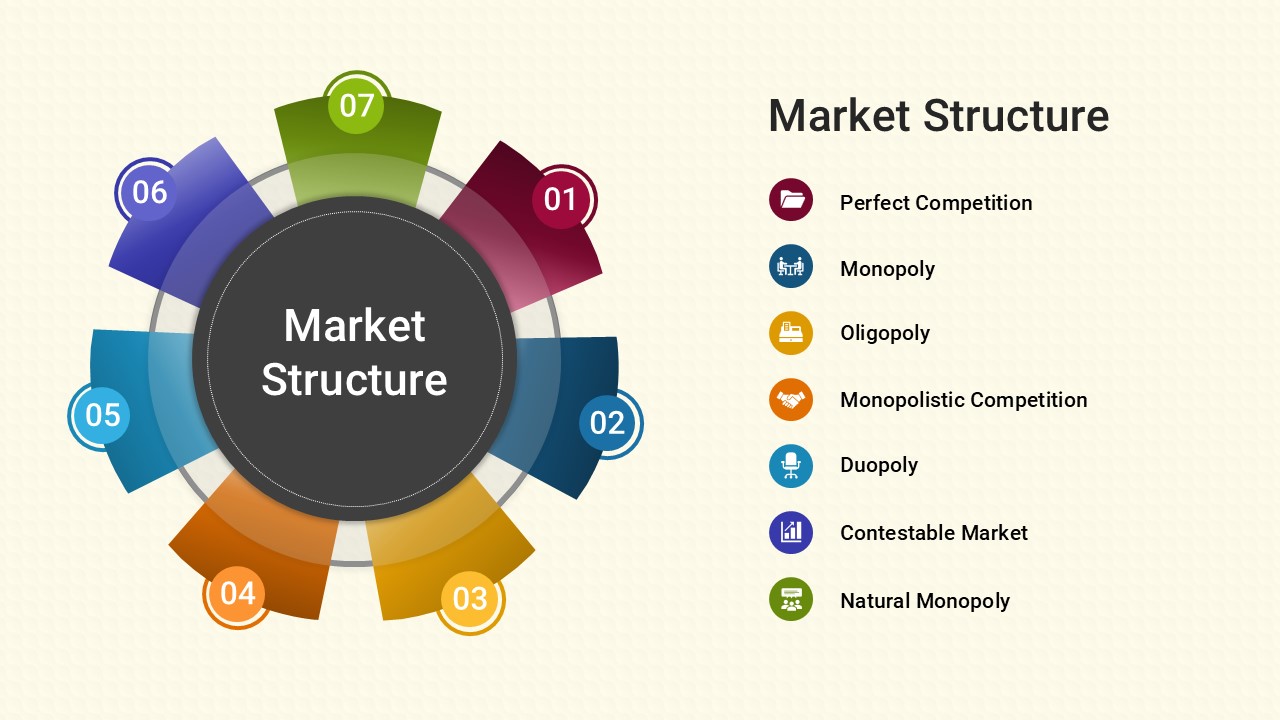
Ideal for marketing teams, business analysts, and strategists, the chart highlights competitive positioning with a focus on four primary players—Apple, Samsung, Xiaomi, and Others. Each segment is paired with detailed descriptions that emphasize the strengths and strategies of these companies, such as Apple’s premium brand loyalty, Samsung’s broad product range, Xiaomi’s aggressive market expansion, and the innovation-driven smaller brands.
Key Features:
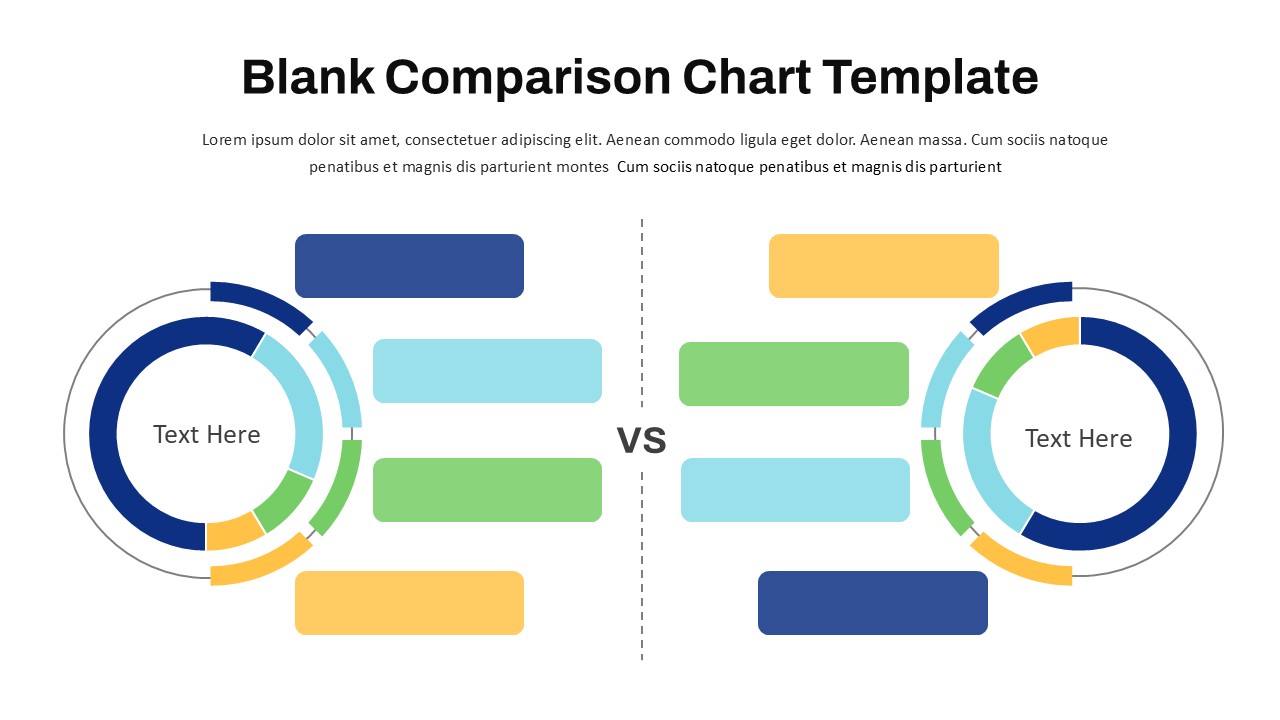
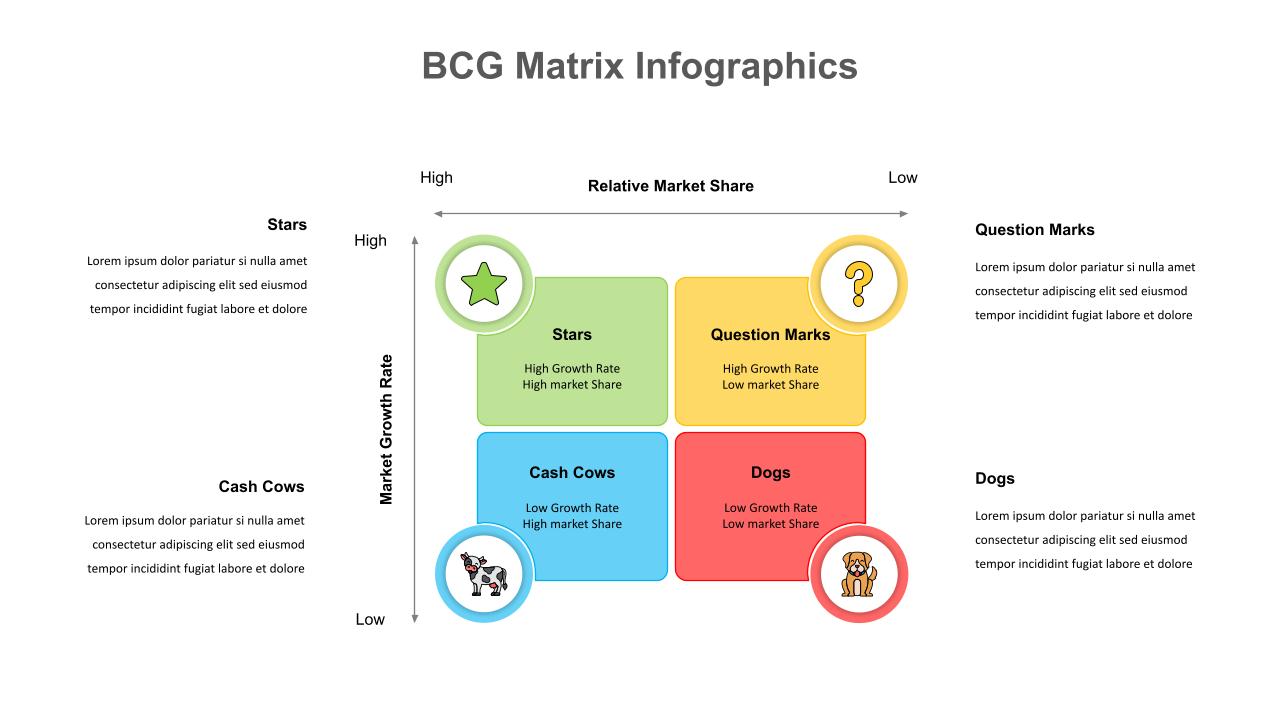
- Clear Visual Comparison: Pie chart format offers quick insights into market dominance
- Detailed Annotations: Informative text boxes provide context on each competitor’s positioning
- Customizable Design: Easily modify colors, labels, and data to suit your market and competitors
- Perfect for Strategic Meetings: Use it in market analysis presentations, competitor research, and business planning
- User-Friendly Layout: Compatible with both PowerPoint and Google Slides for easy editing and sharing
Whether you’re preparing investor reports, internal marketing reviews, or competitive intelligence briefings, this pie graph in powerpoint template ensures your audience grasps market dynamics at a glance.
See more

Aspect Ratio
16:9Item ID
SKT03602
Features of this template
Other User Cases of the Template:
competitive analysis presentations, market research reports, investor briefings, business strategy sessions, product positioning reviews, sales team updates, industry benchmarking, marketing performance analysis, market entry strategy planning, corporate presentations
FAQs
You May Also Like These Presentation Templates
- Free

- Free

- Free


- Free

- Free
- Free
- Free
- Free
- Free