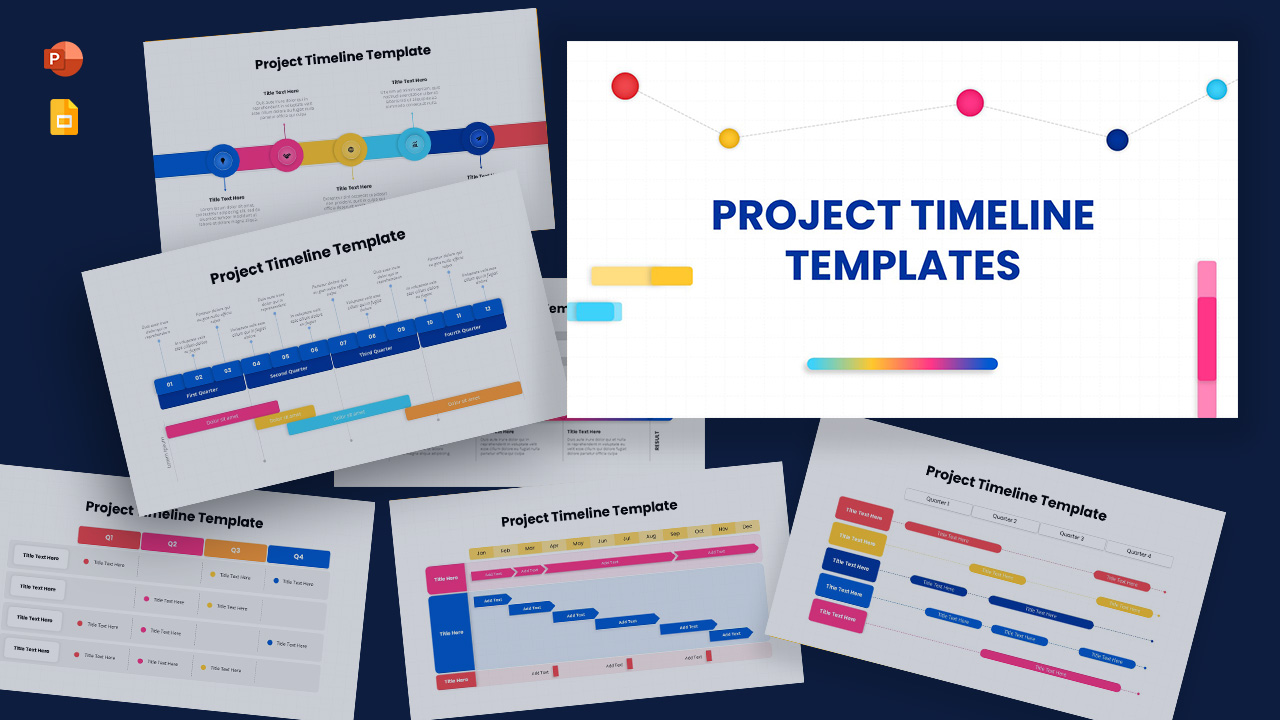
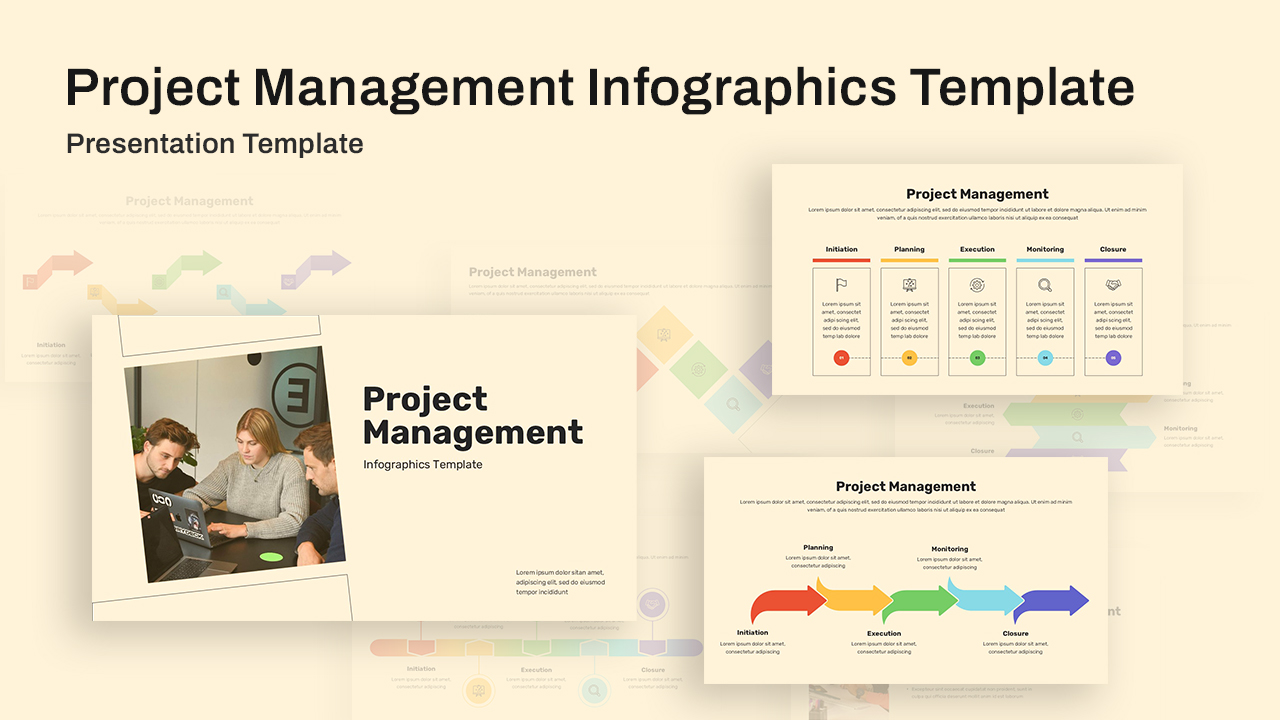
Jira Dashboard Presentation Template

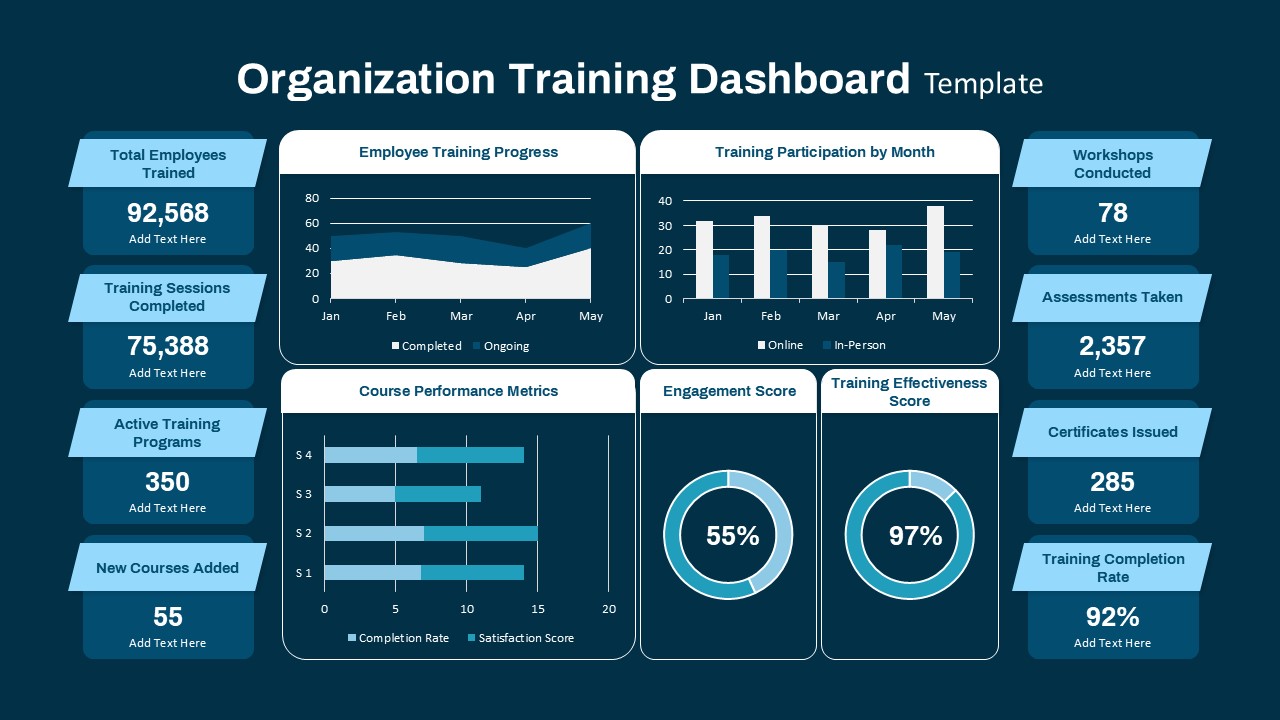
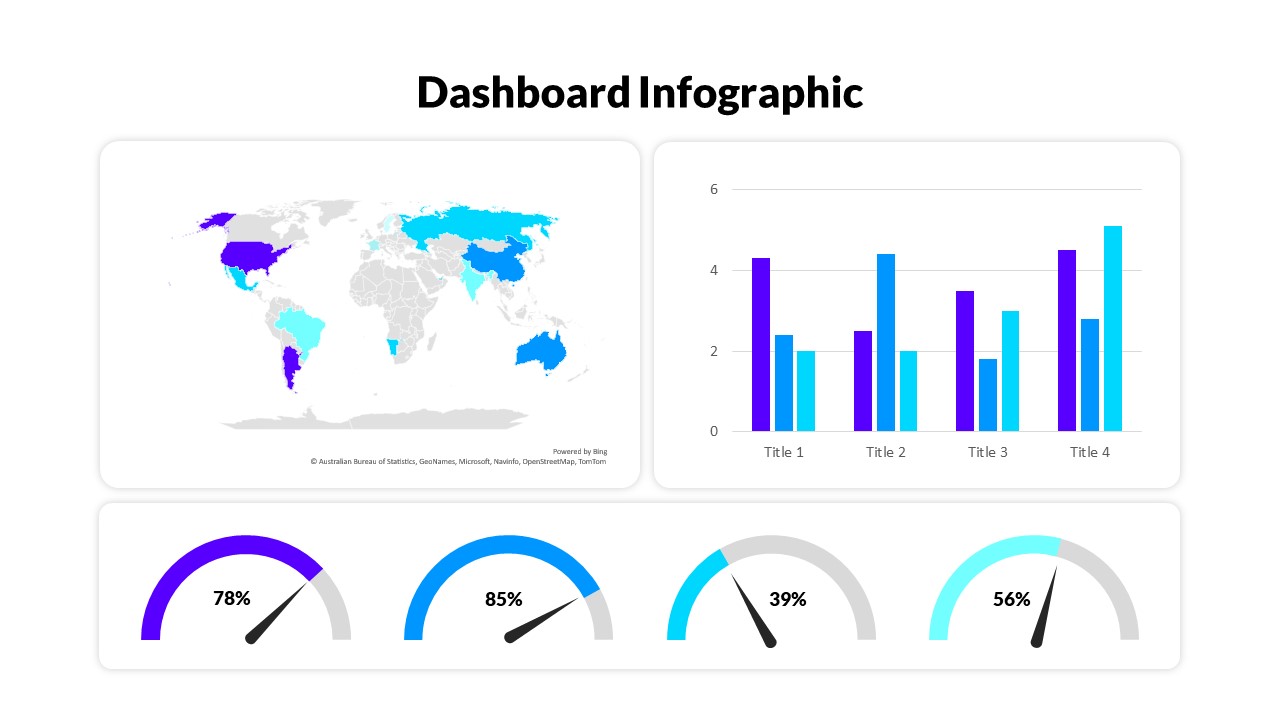
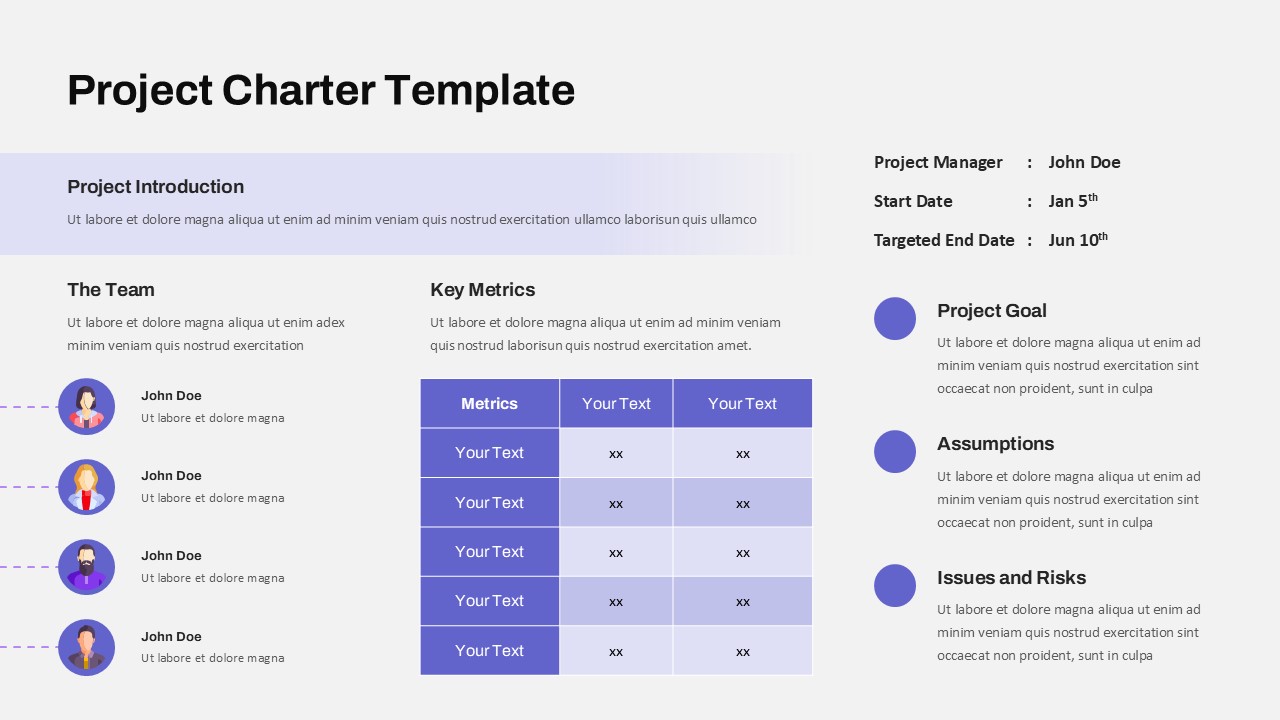
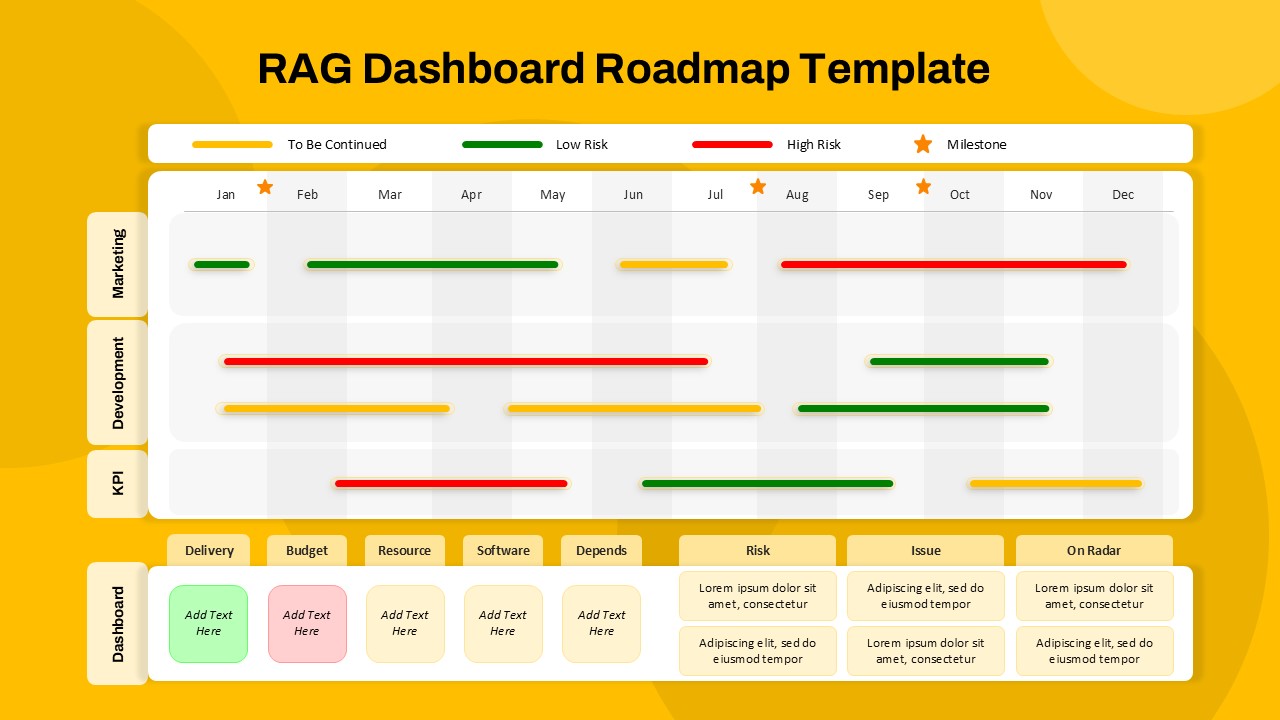
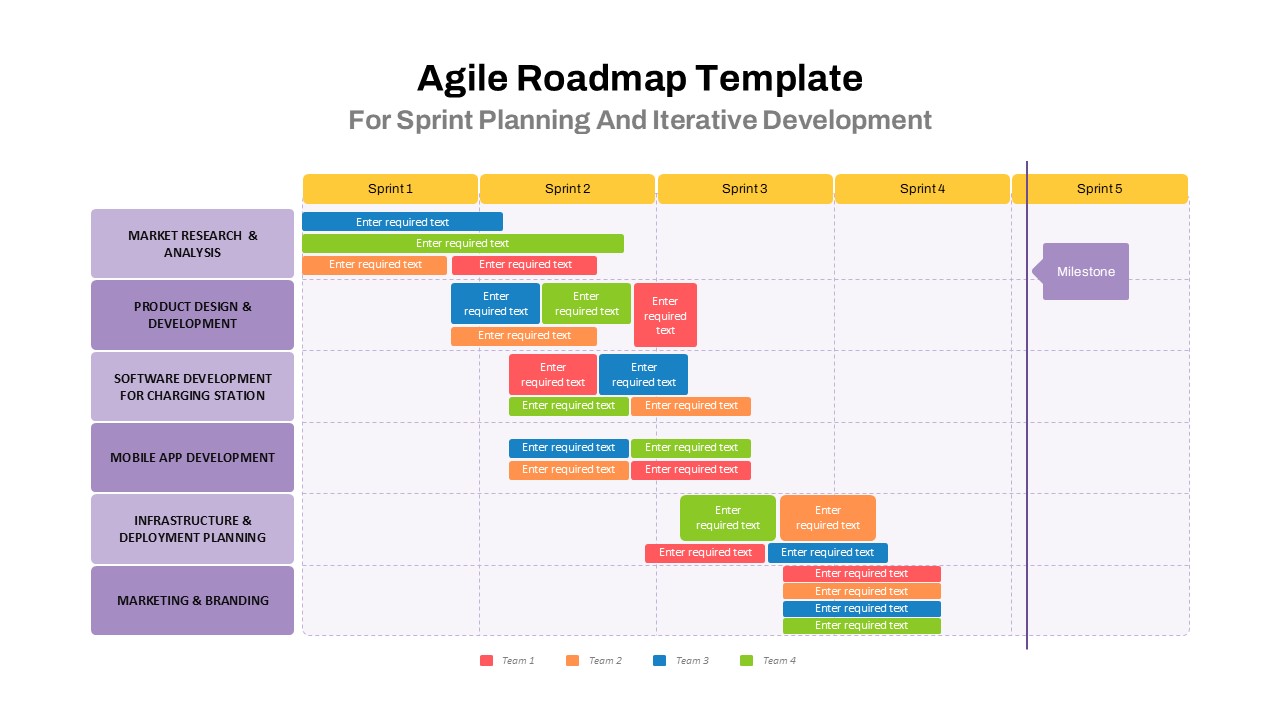
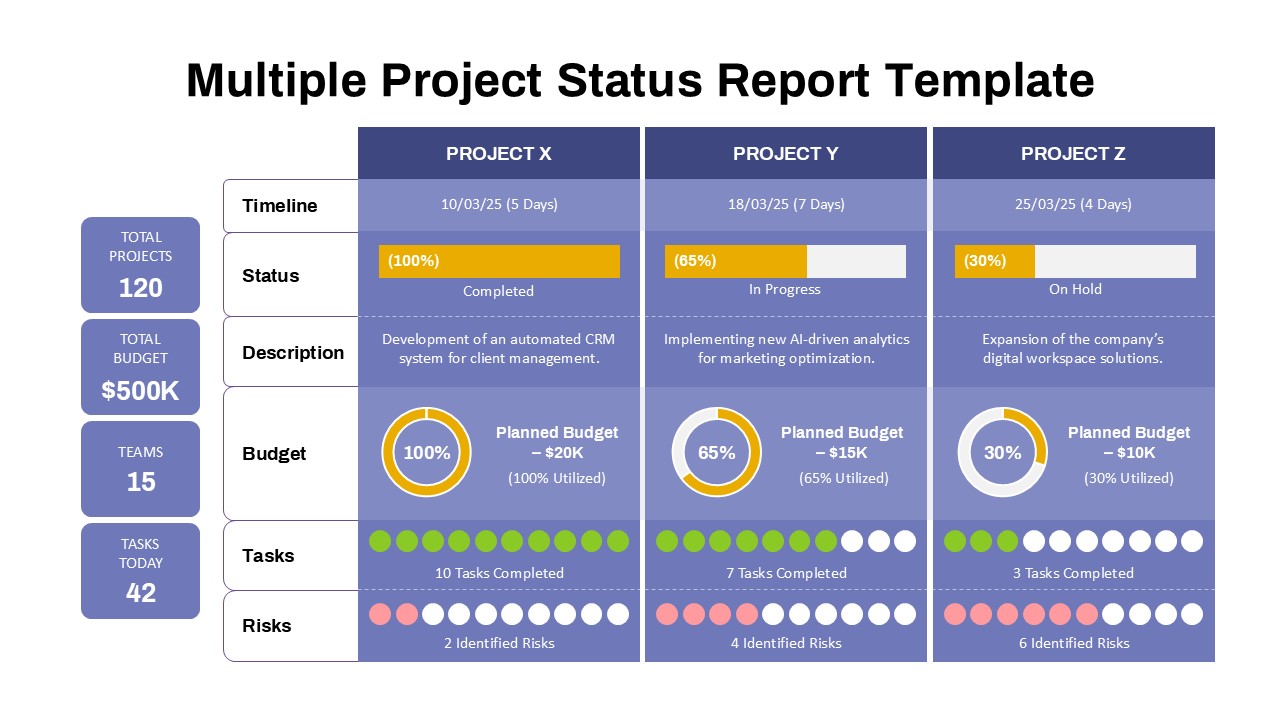
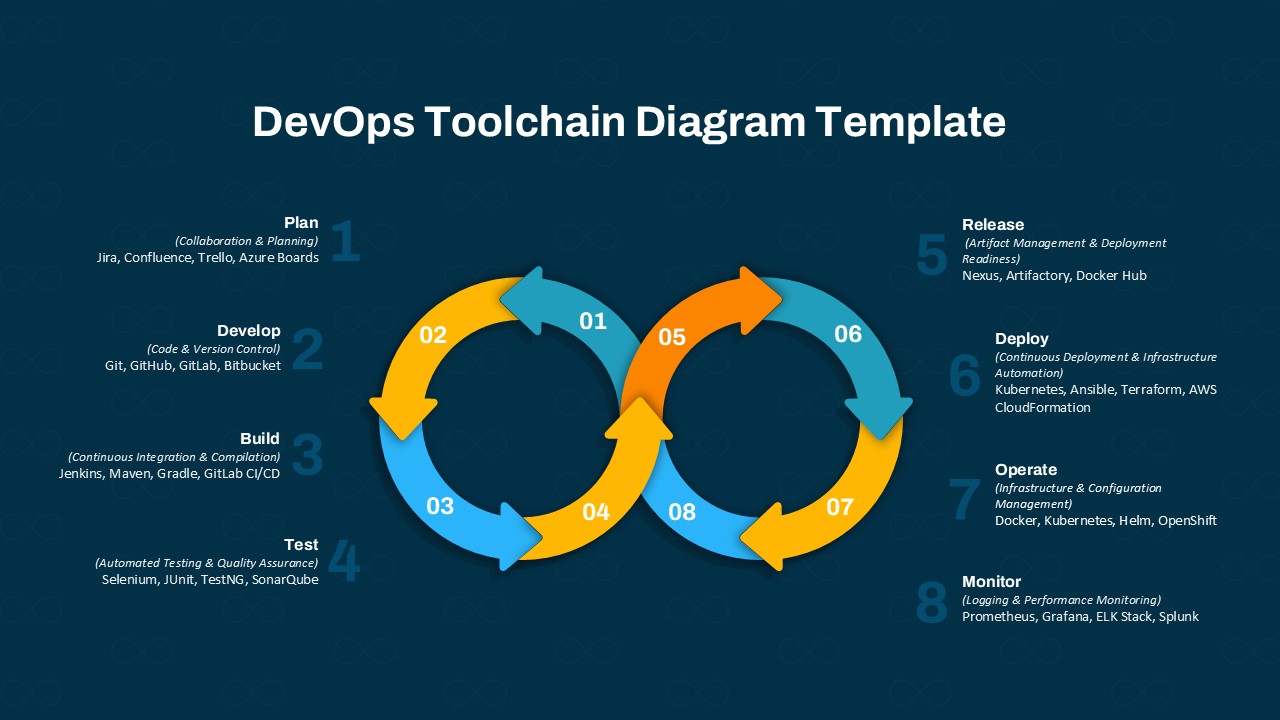
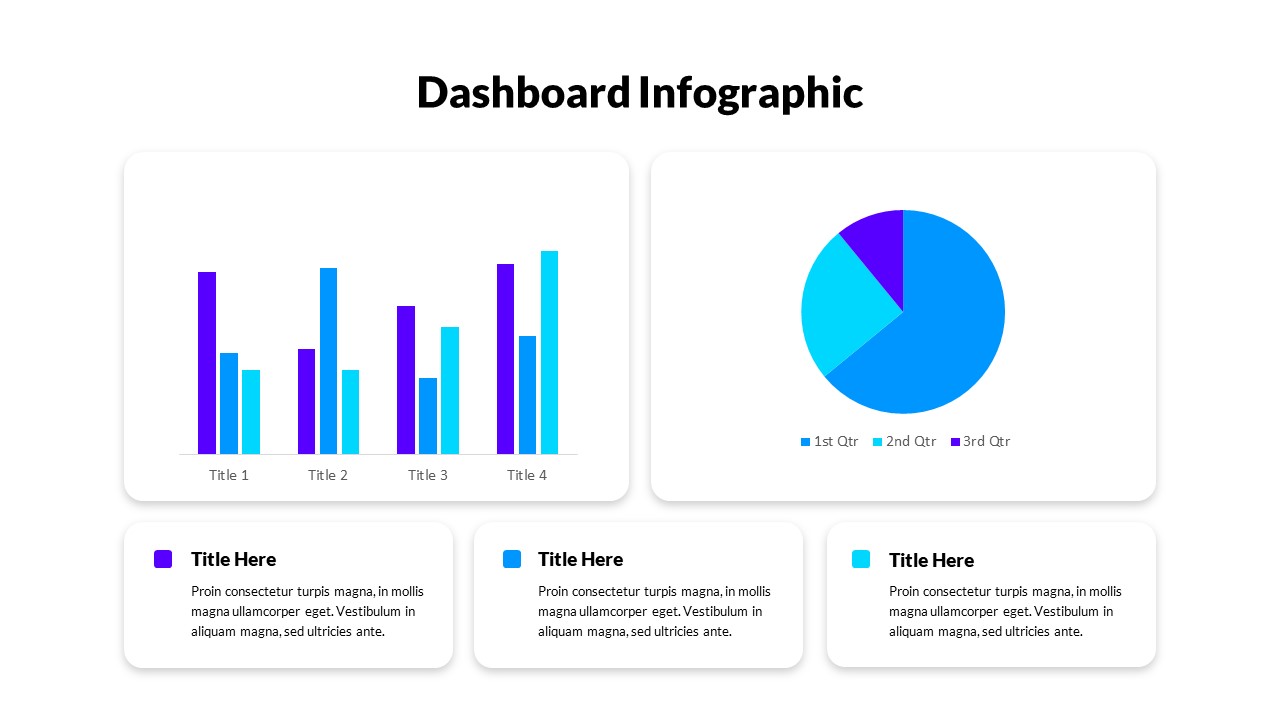
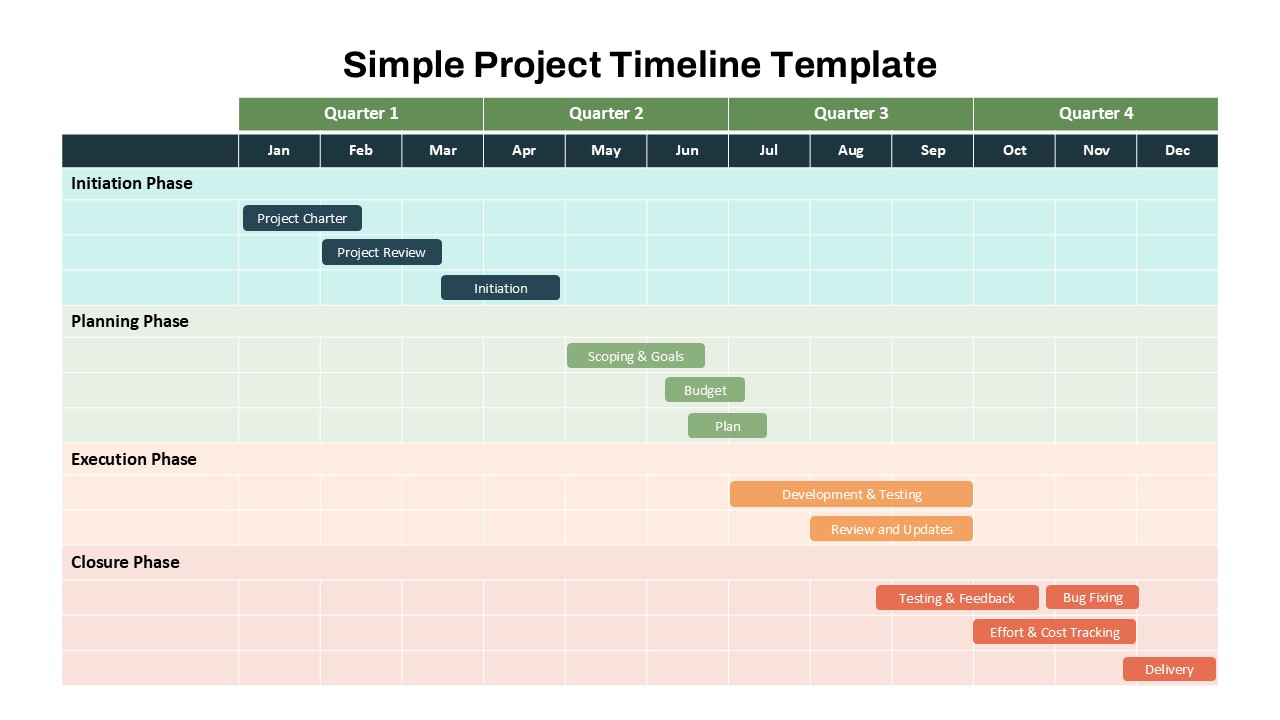
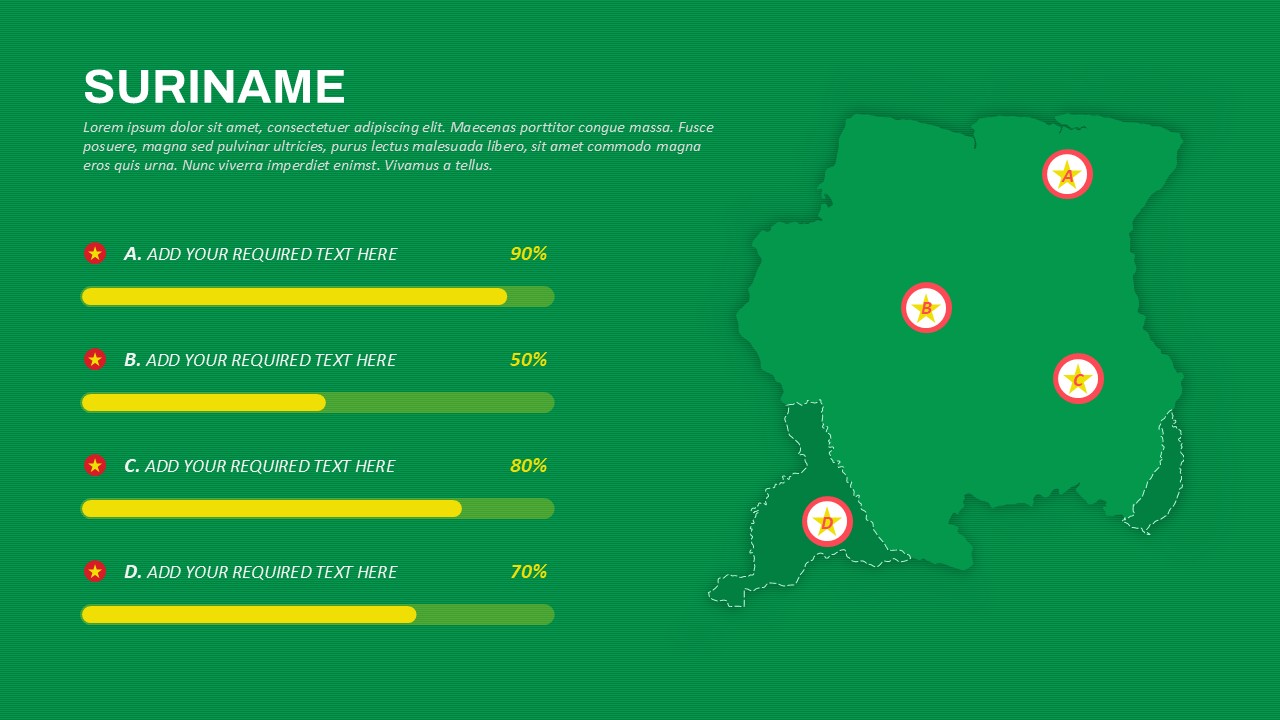
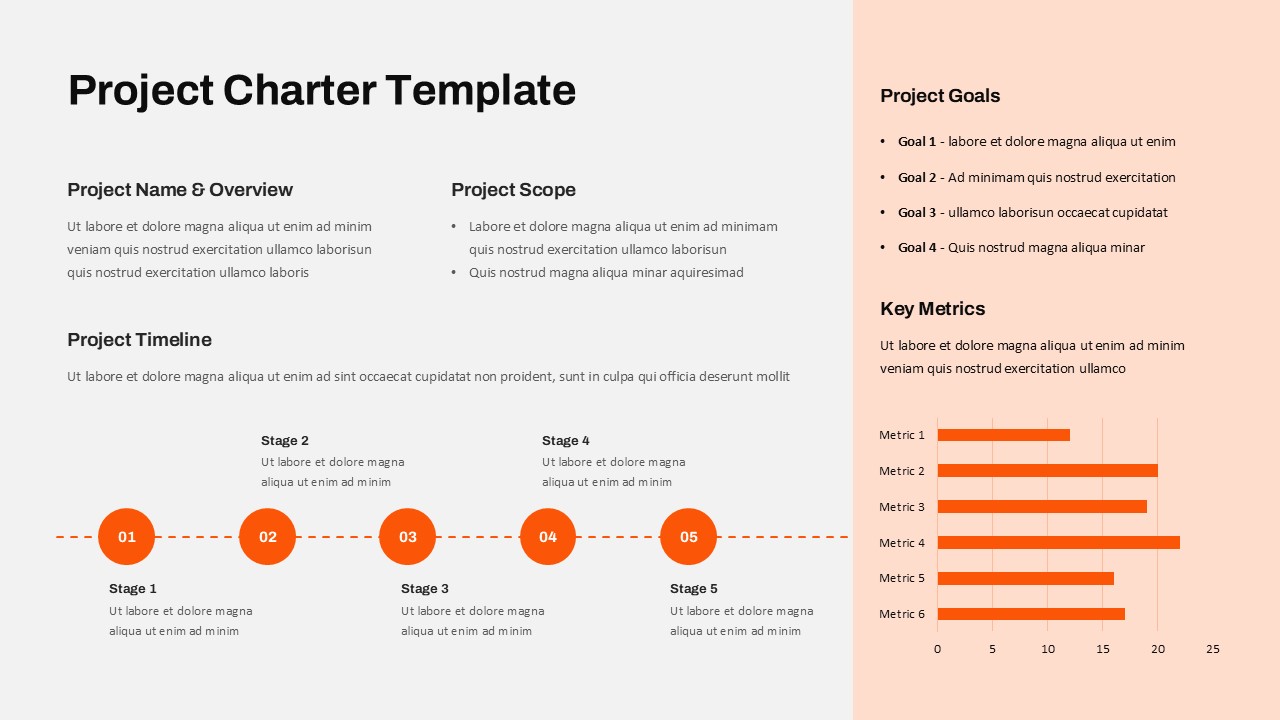
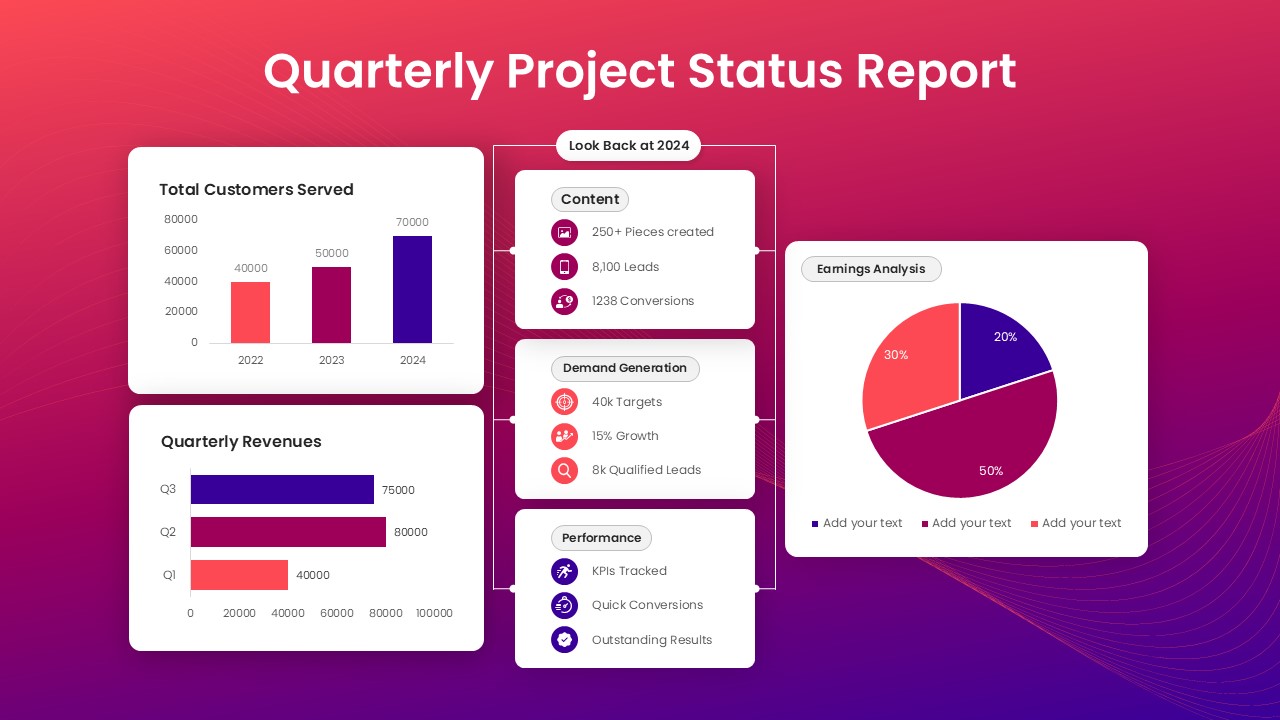
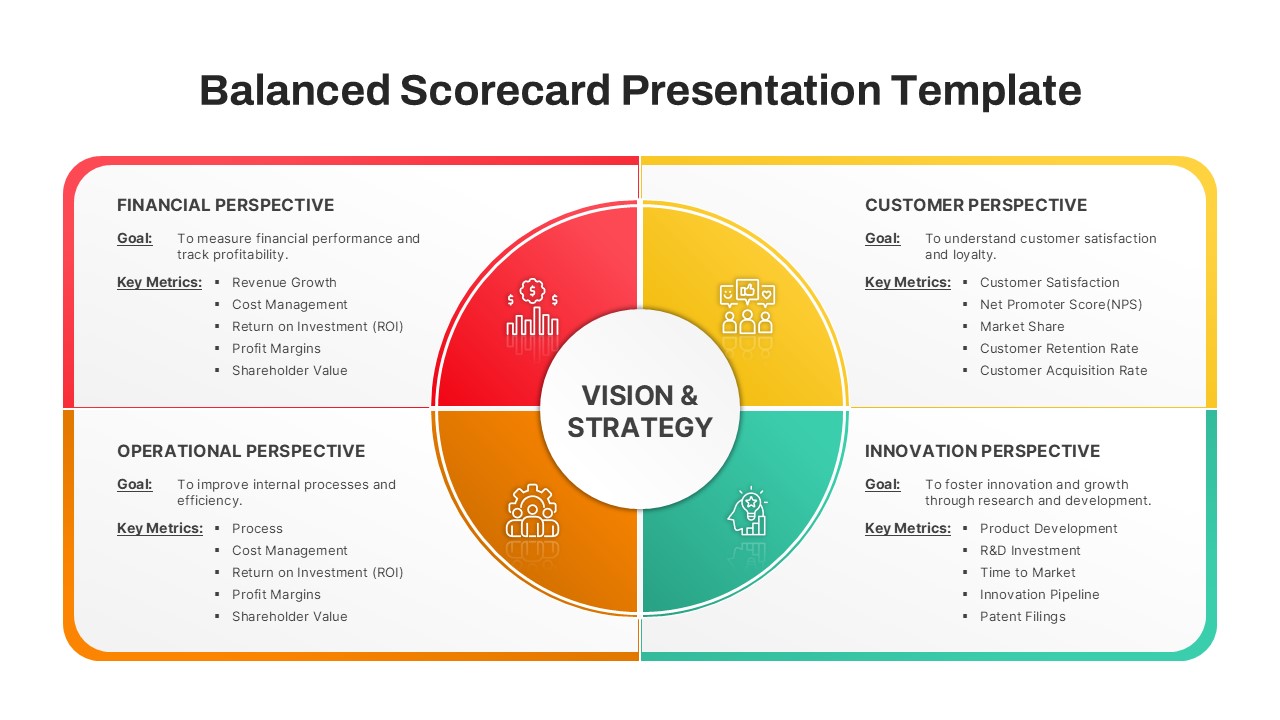
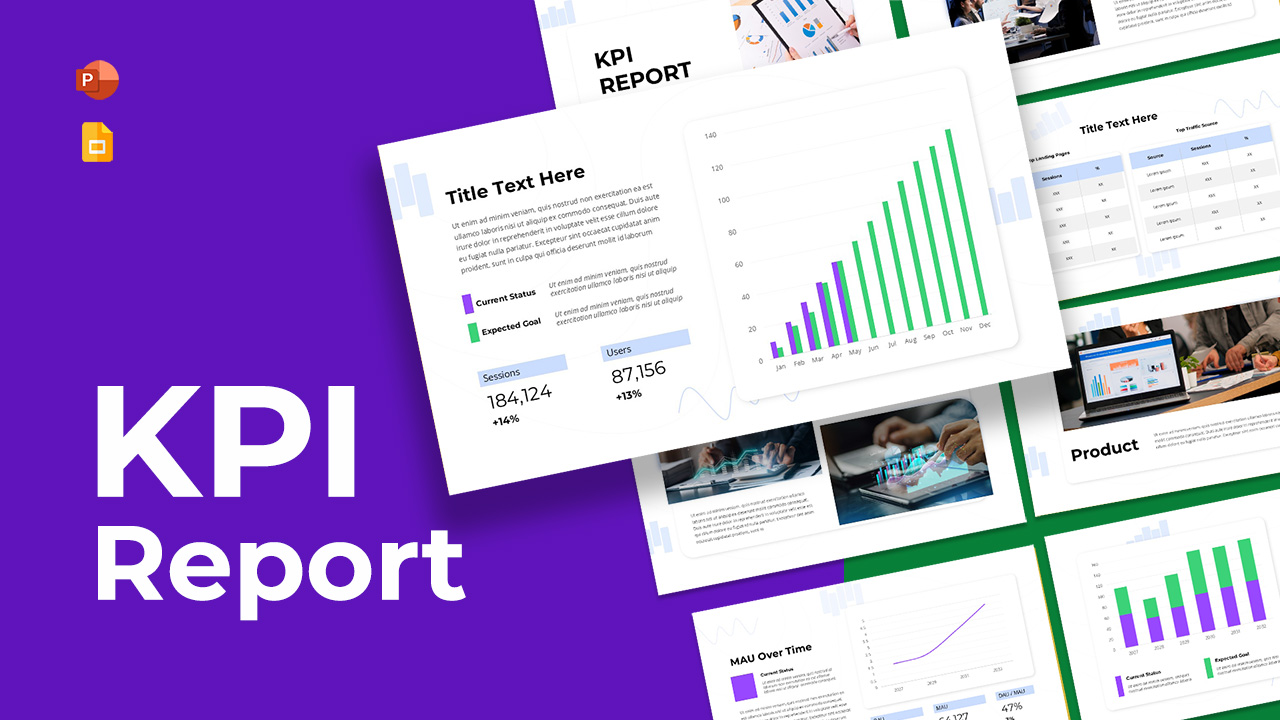
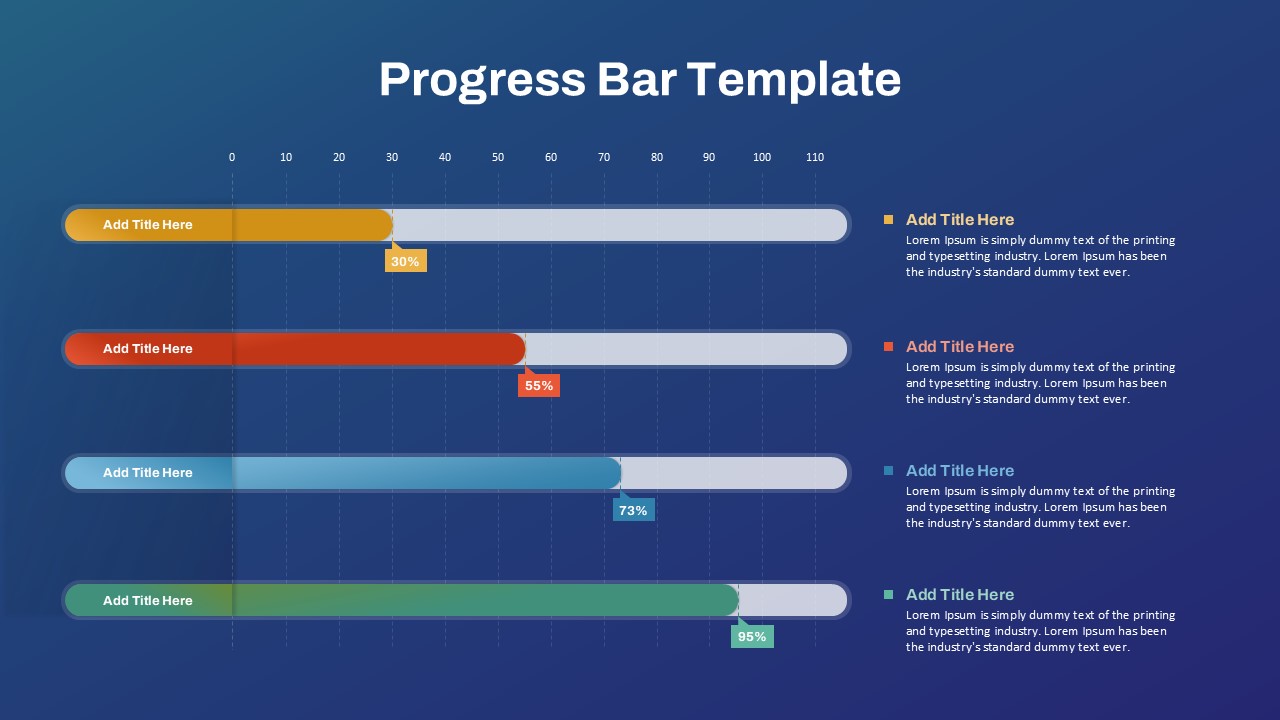
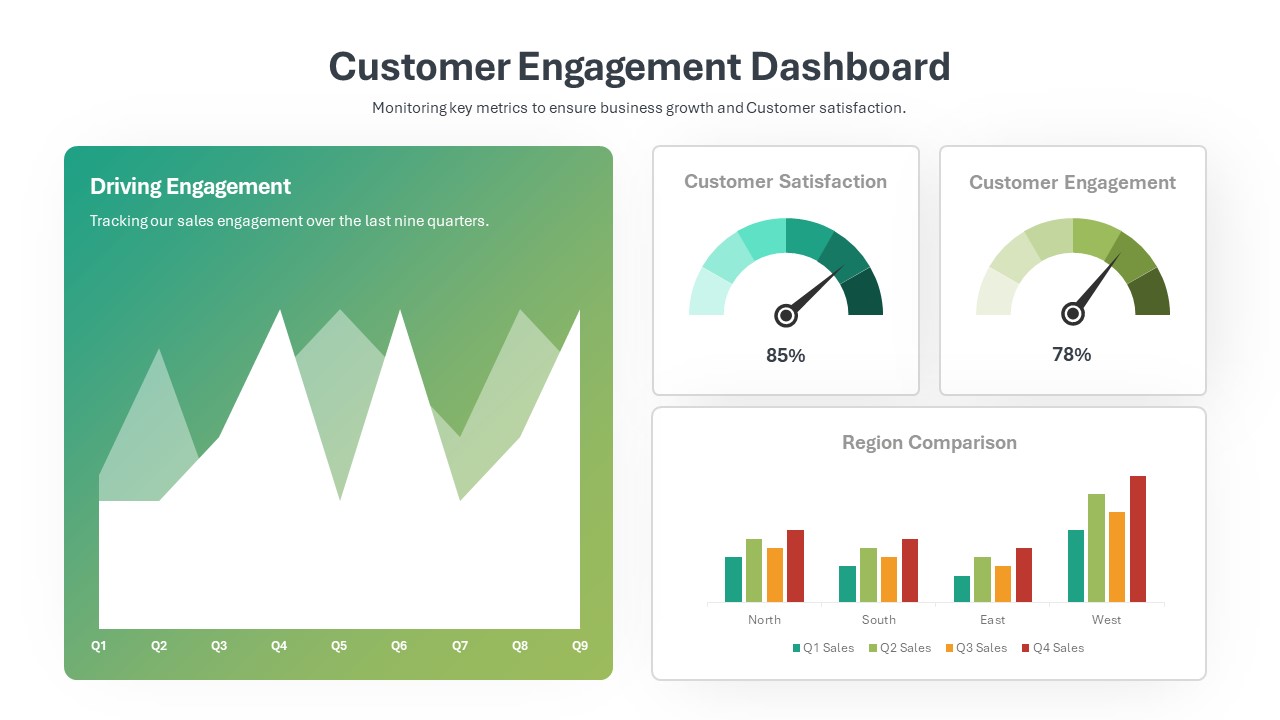
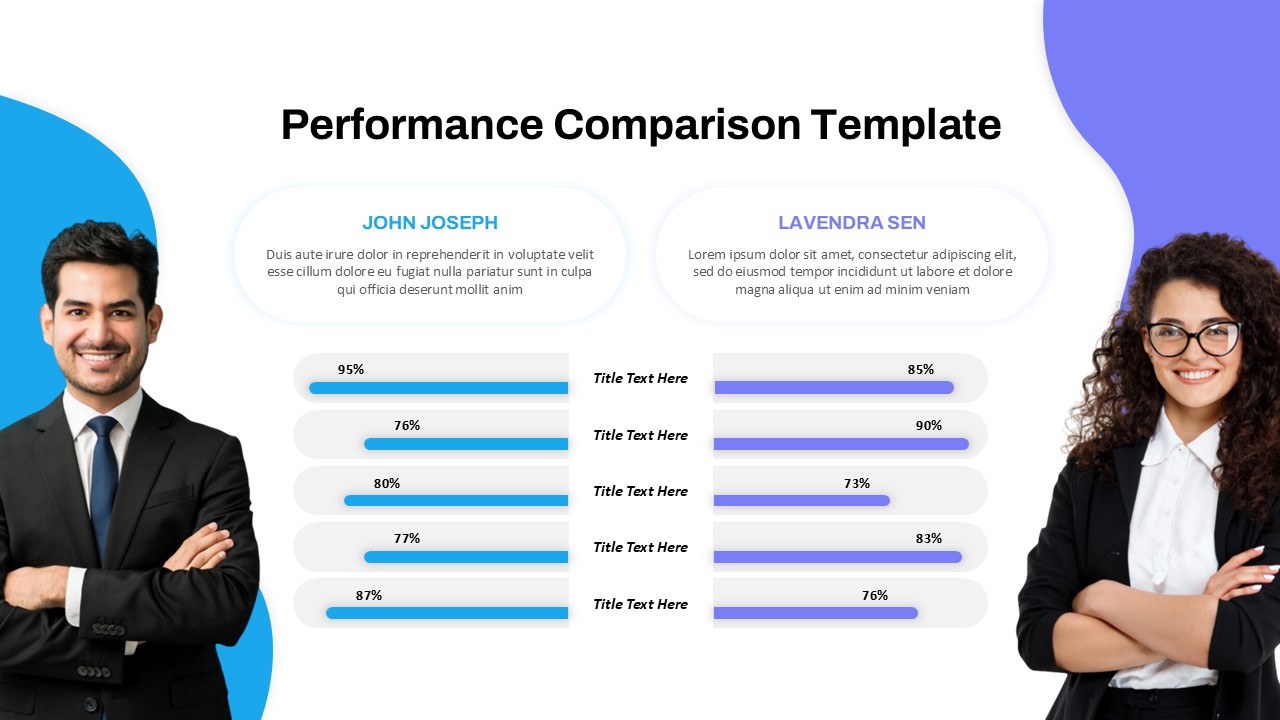
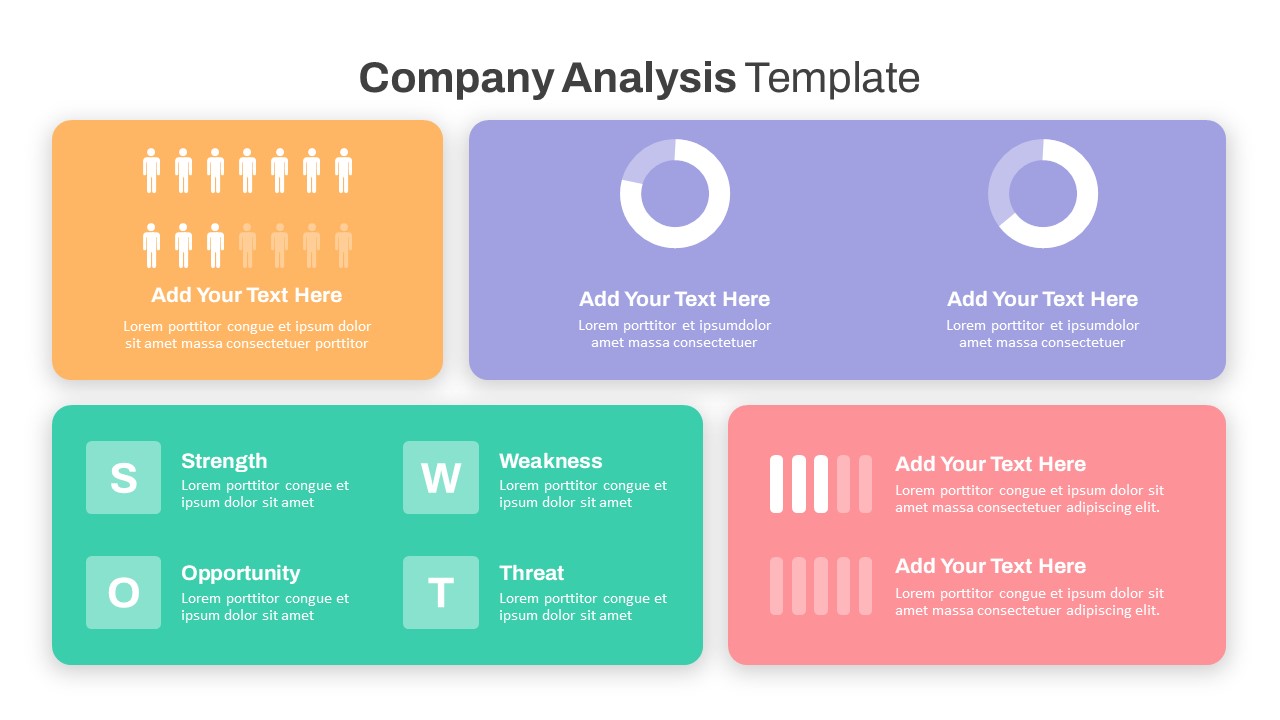
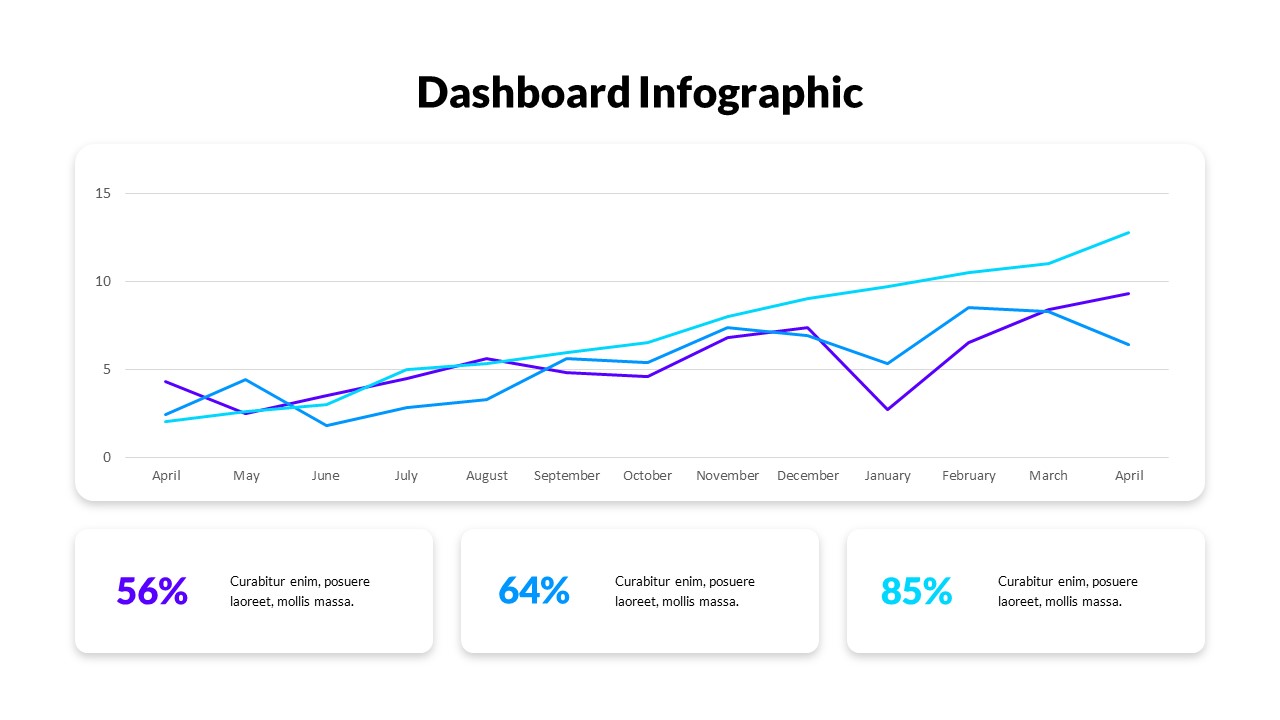
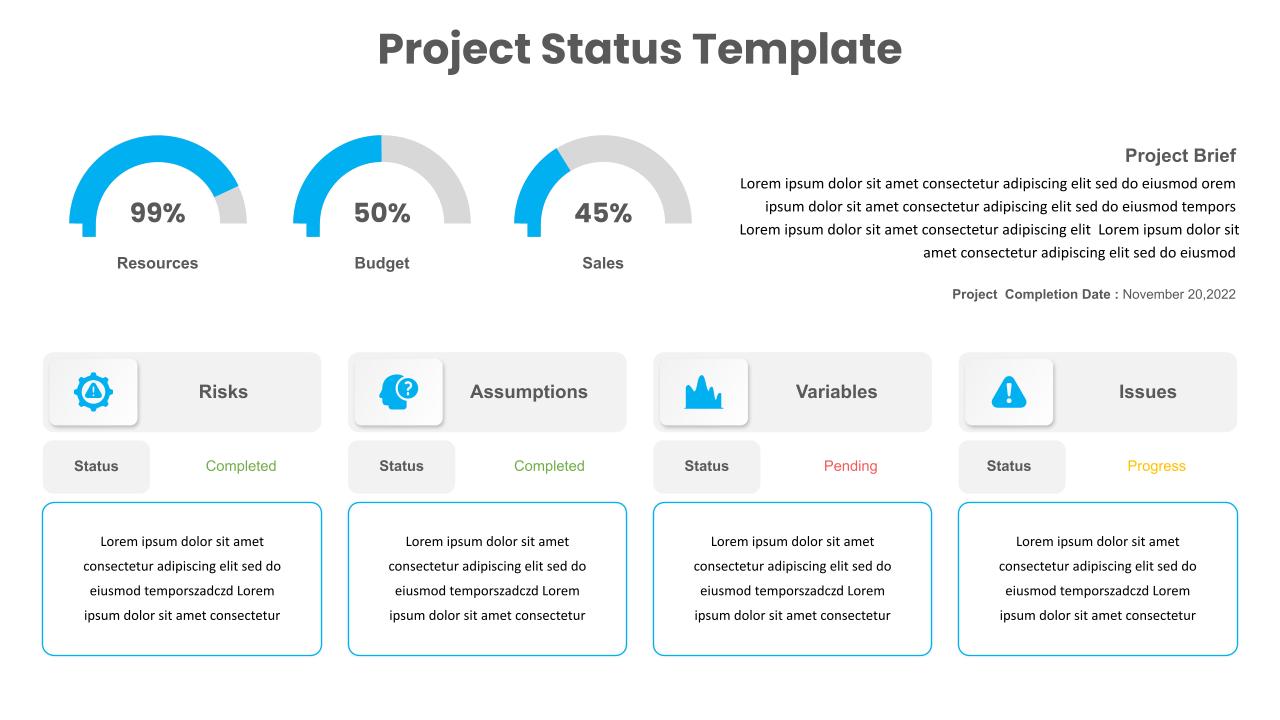
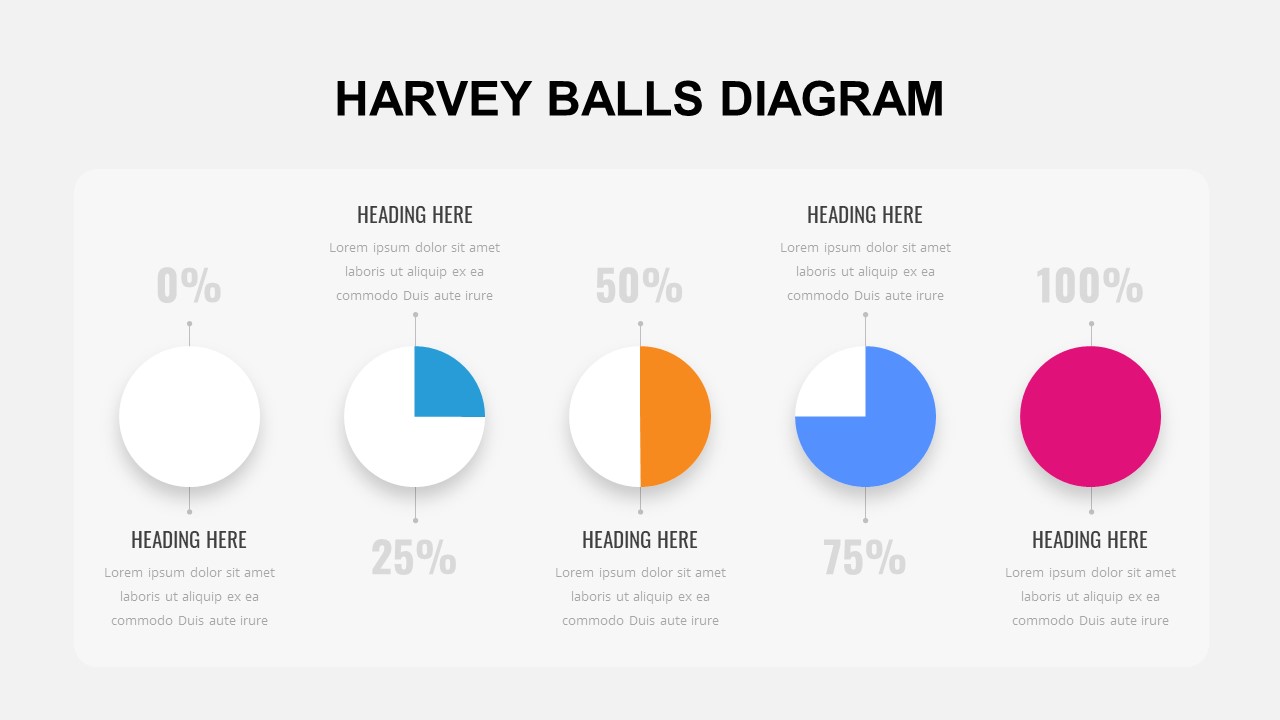
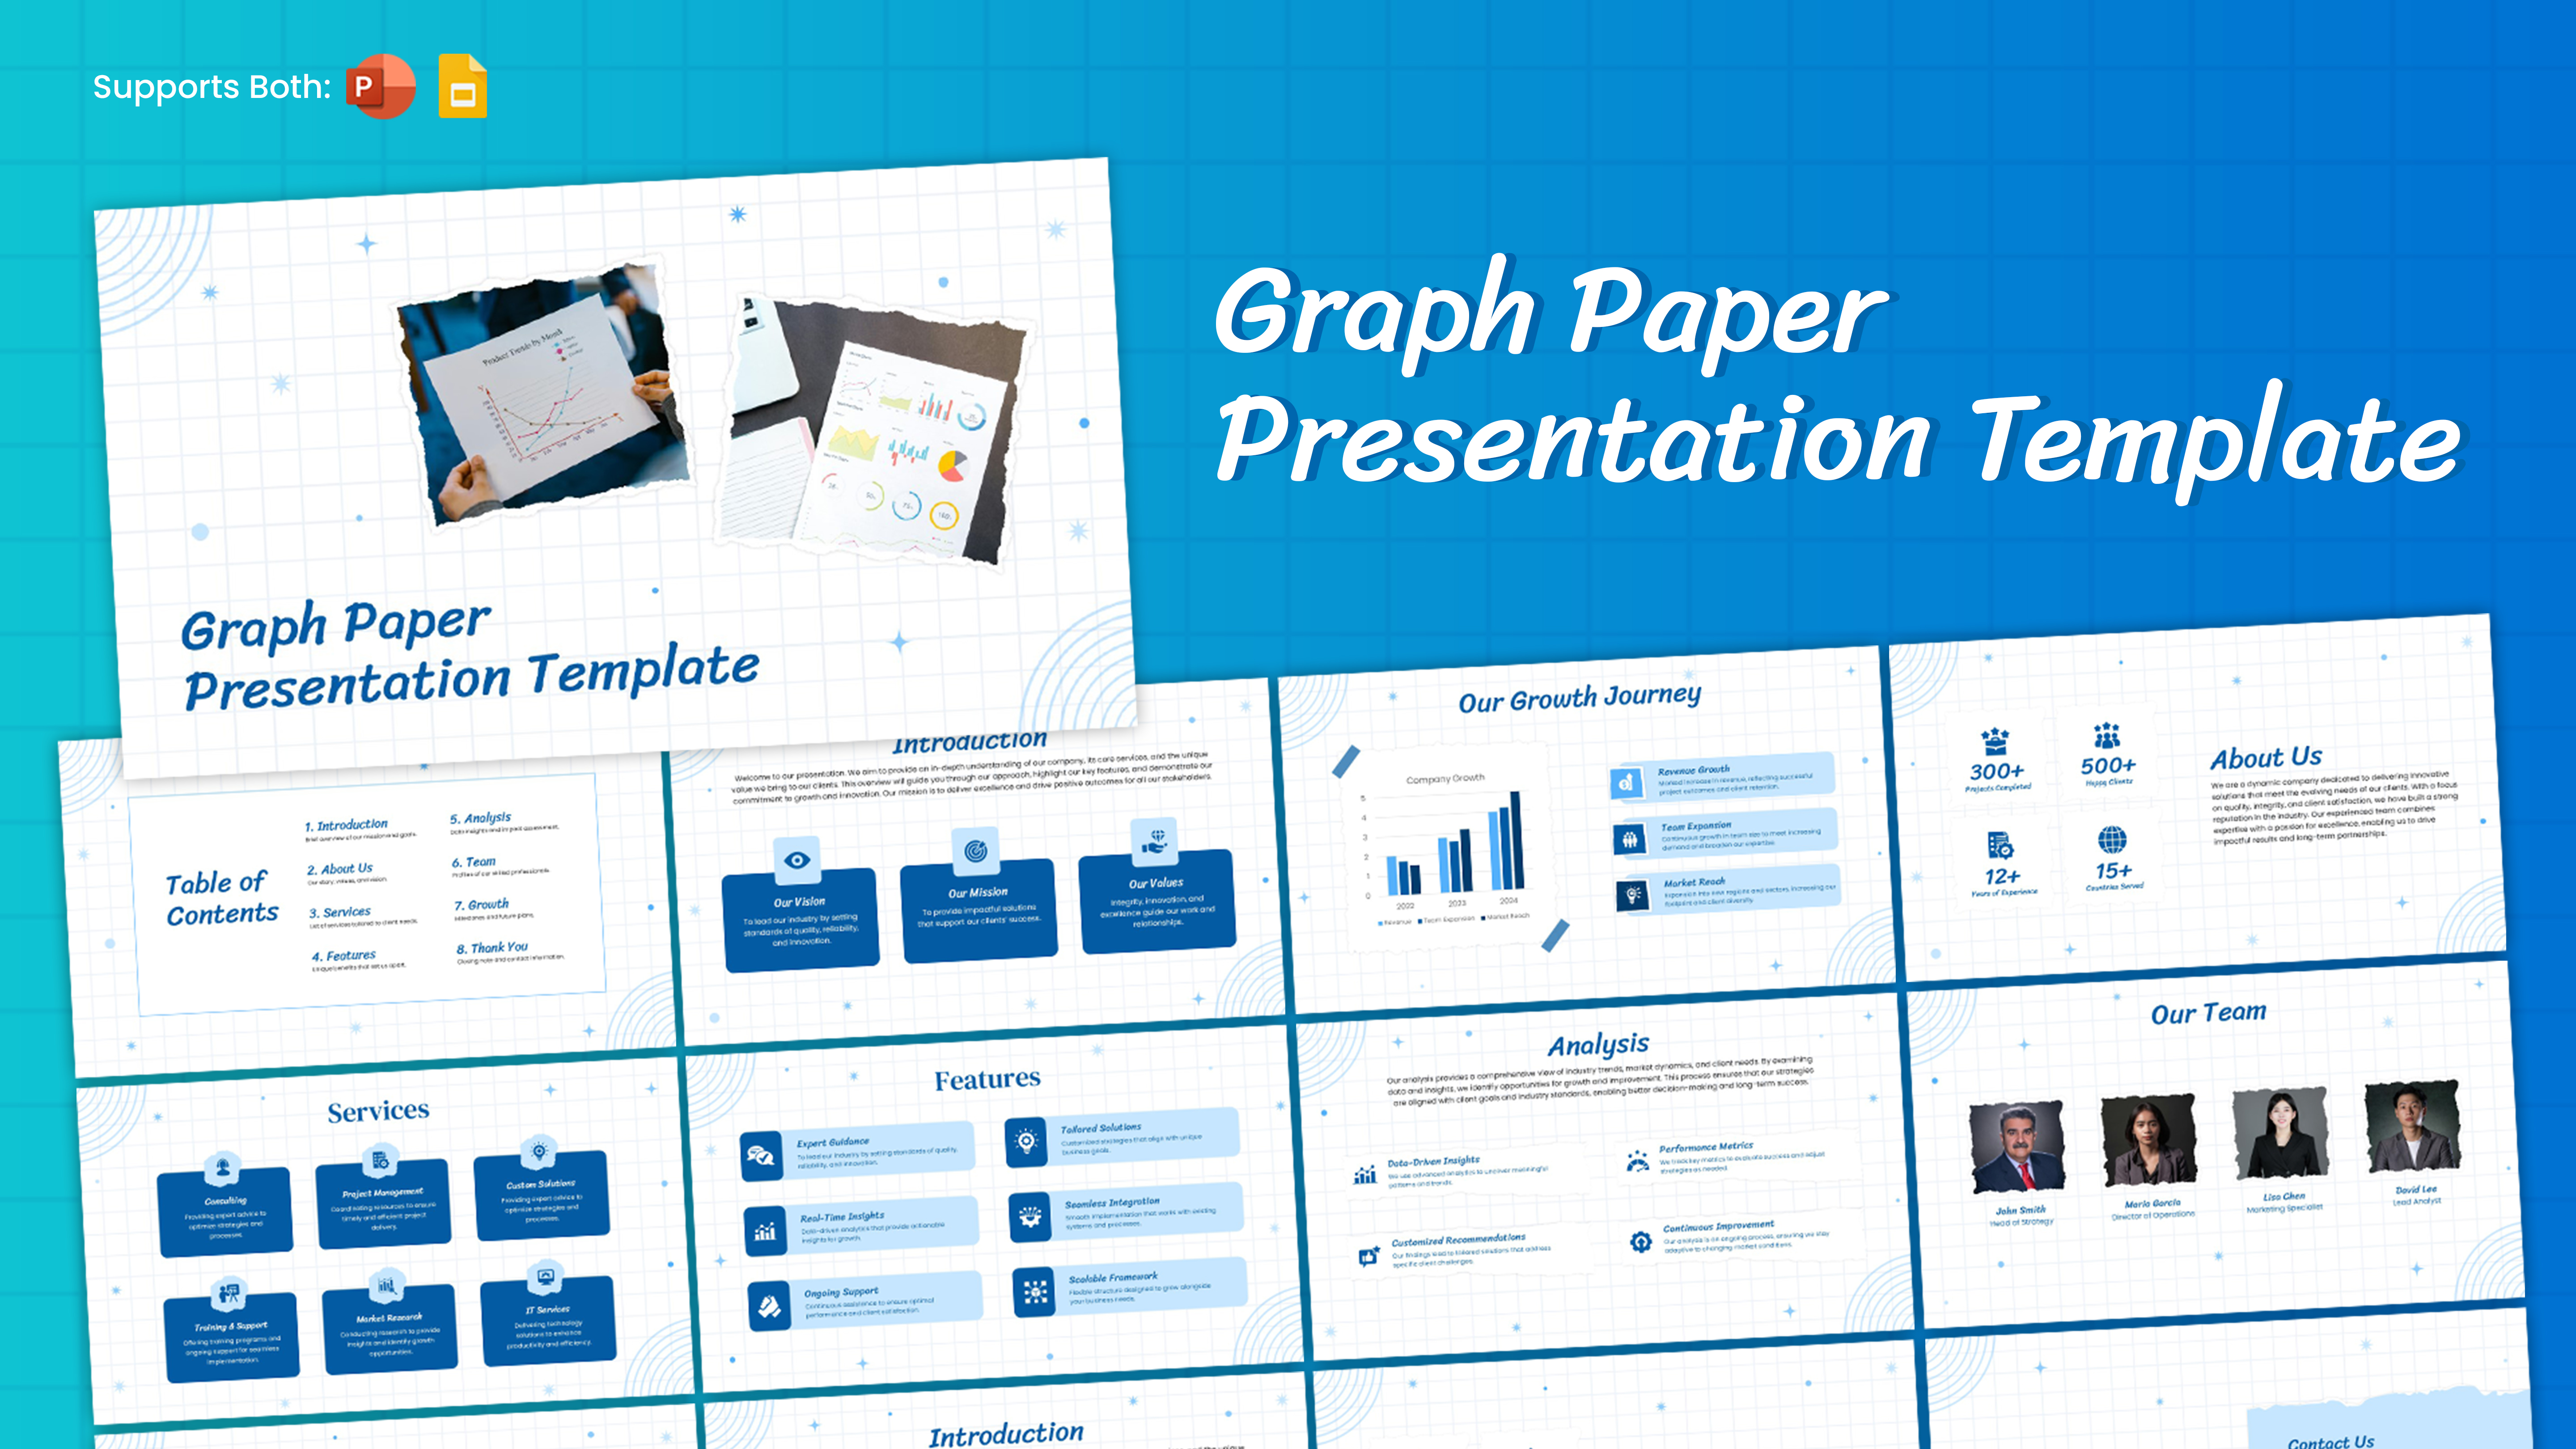
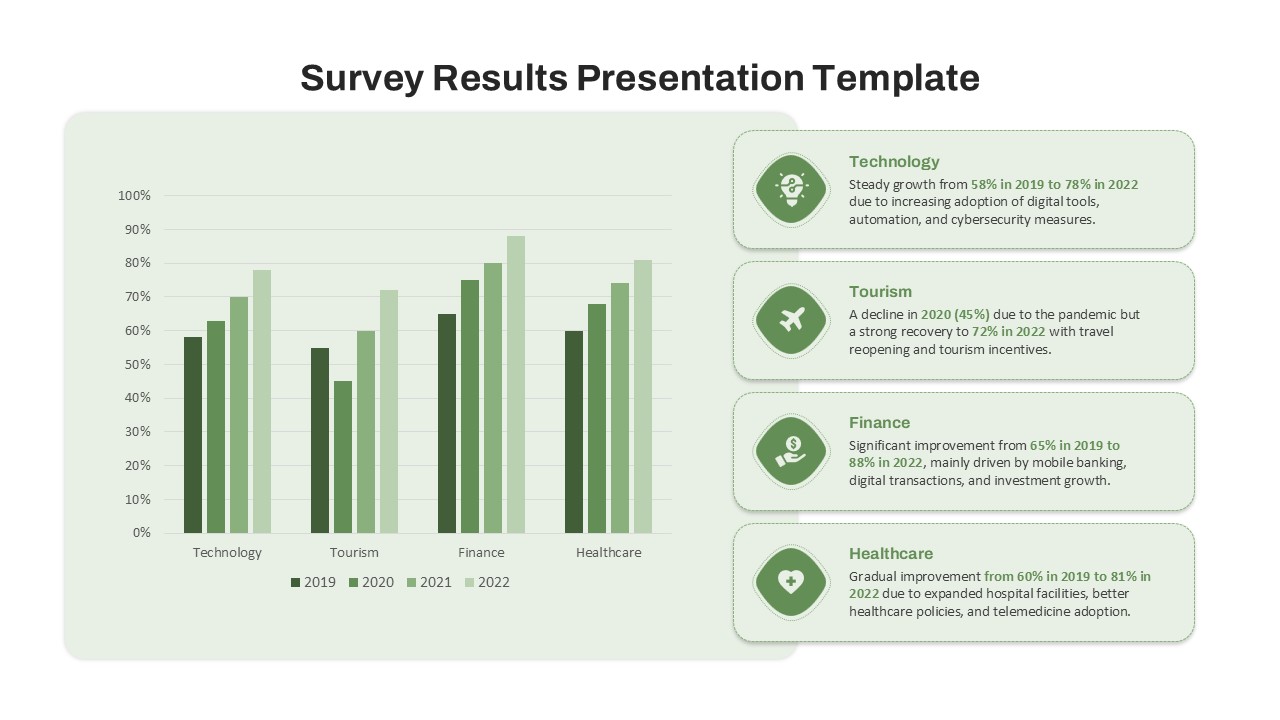
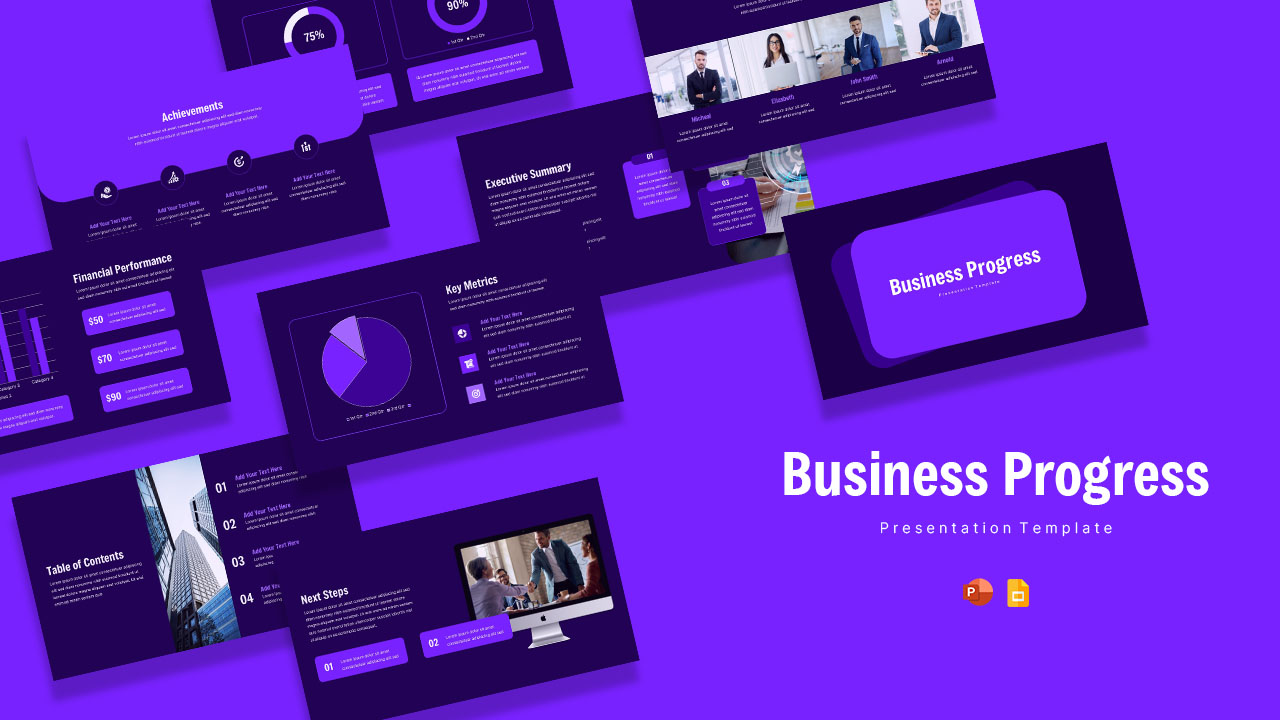
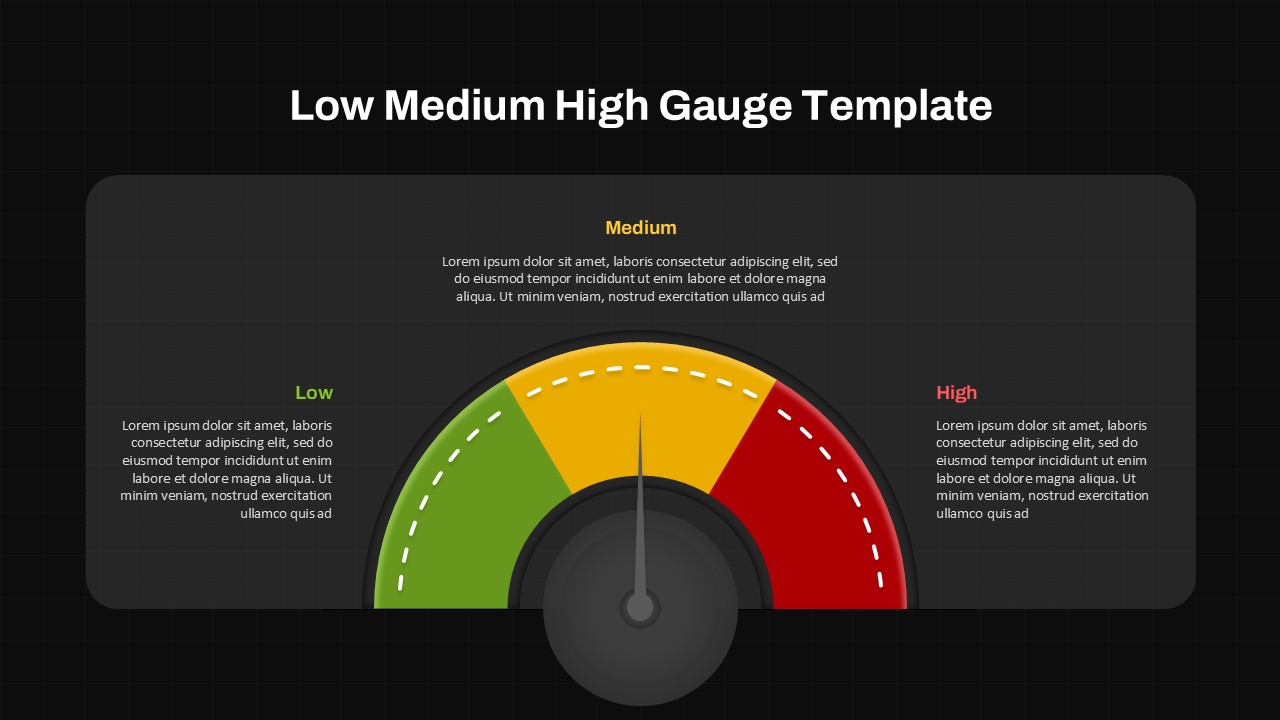
The Jira Dashboard Presentation Template is an essential tool for displaying key project data, metrics, and progress in a visually dynamic and organized manner. Designed for professionals and teams utilizing Jira, this template integrates various data visualization techniques, including progress bars, pie charts, bar graphs, and circular gauges. Each section is tailored to accommodate project statistics, performance data, and tracking, making it ideal for reporting on tasks, milestones, and overall project health.
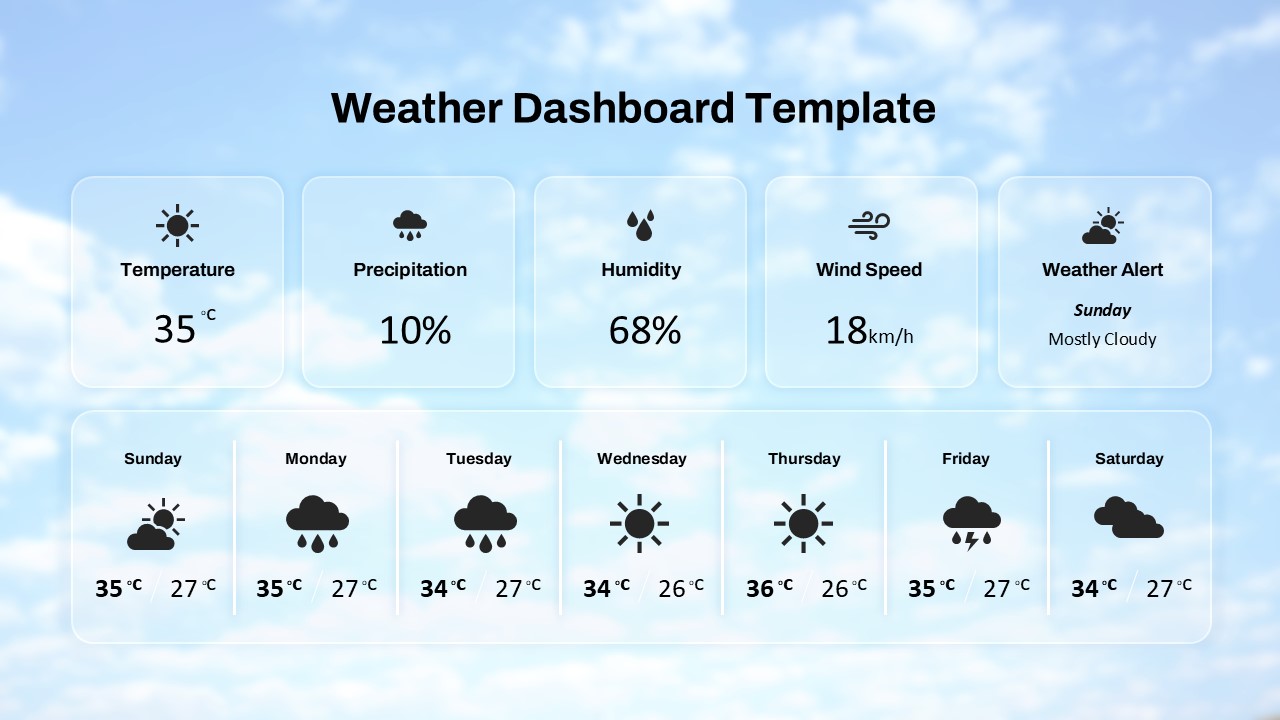
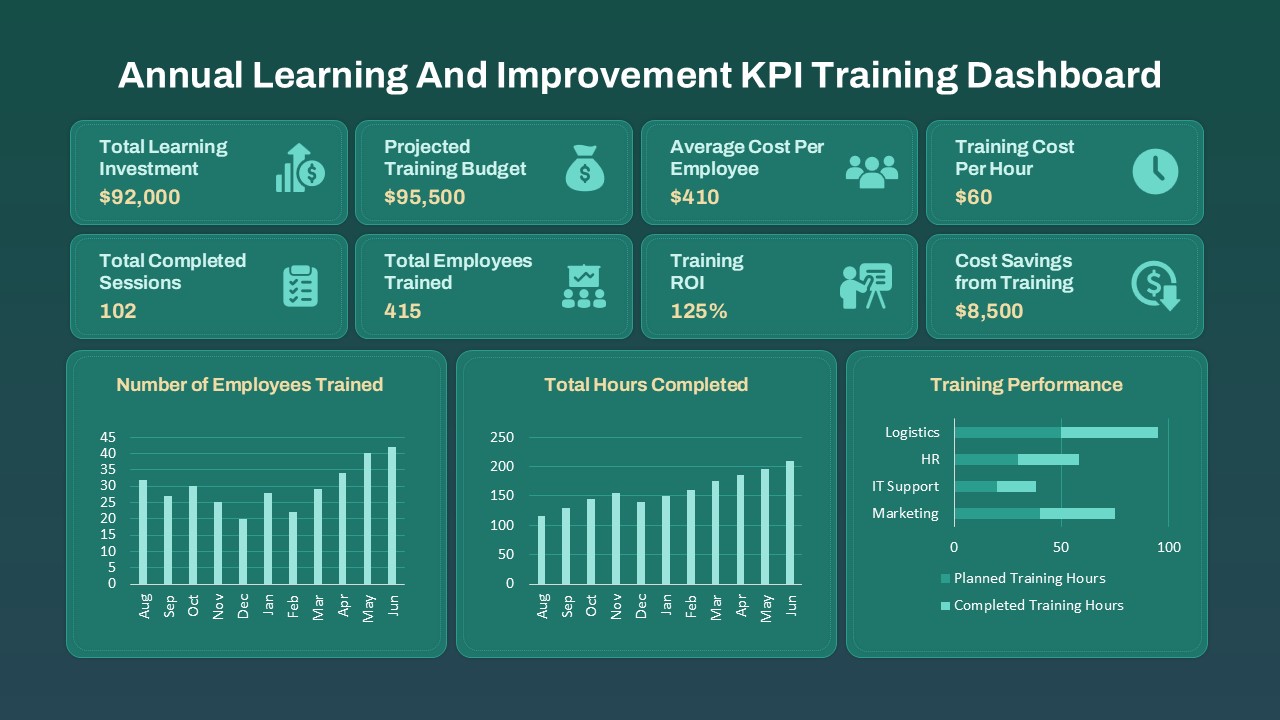
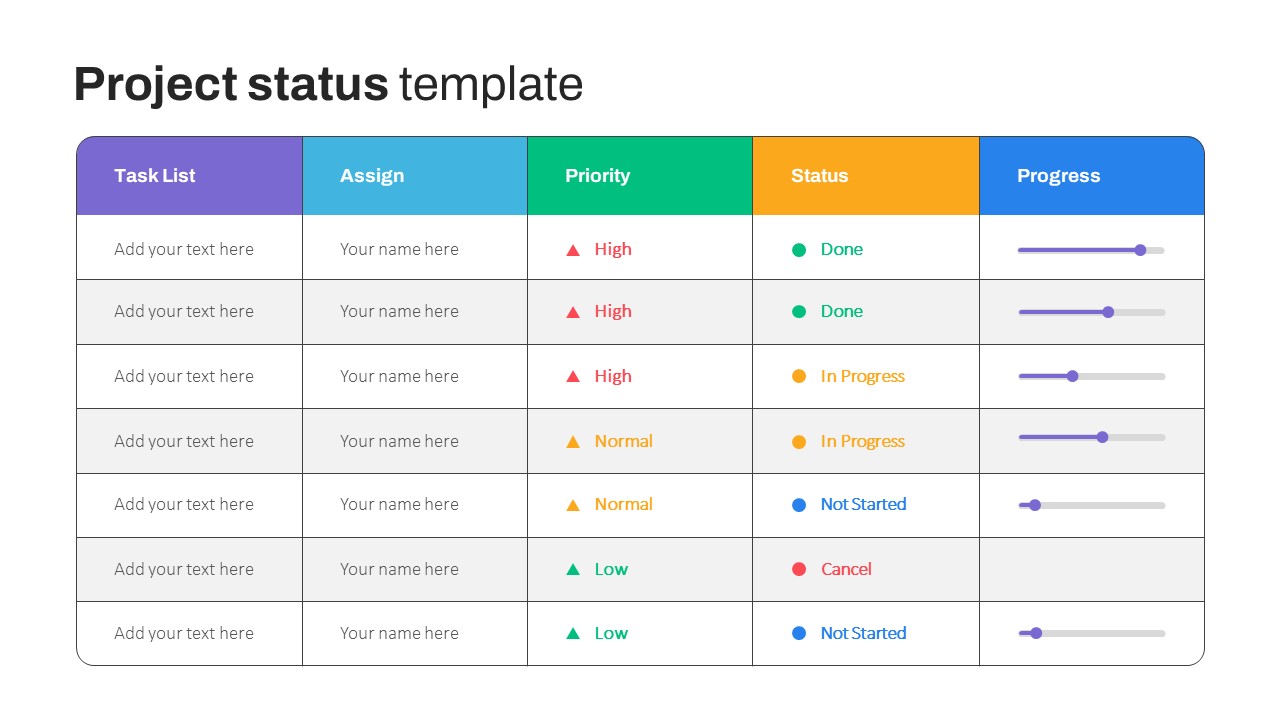
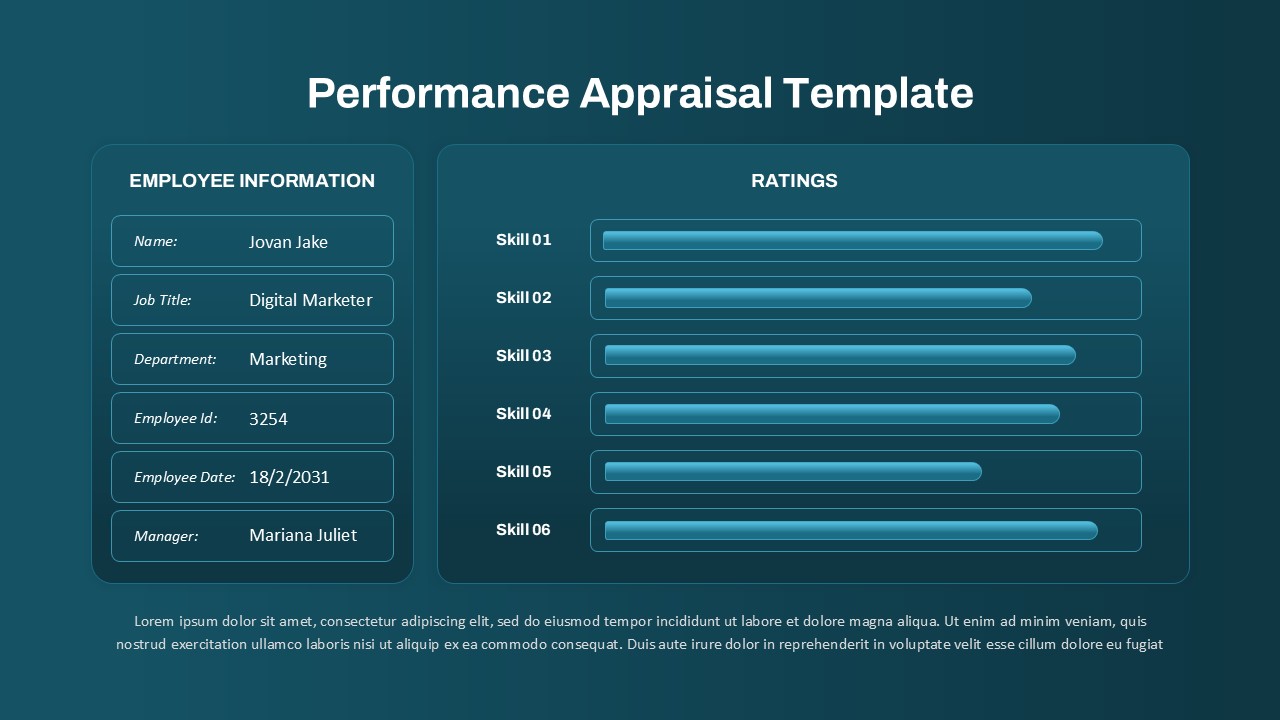
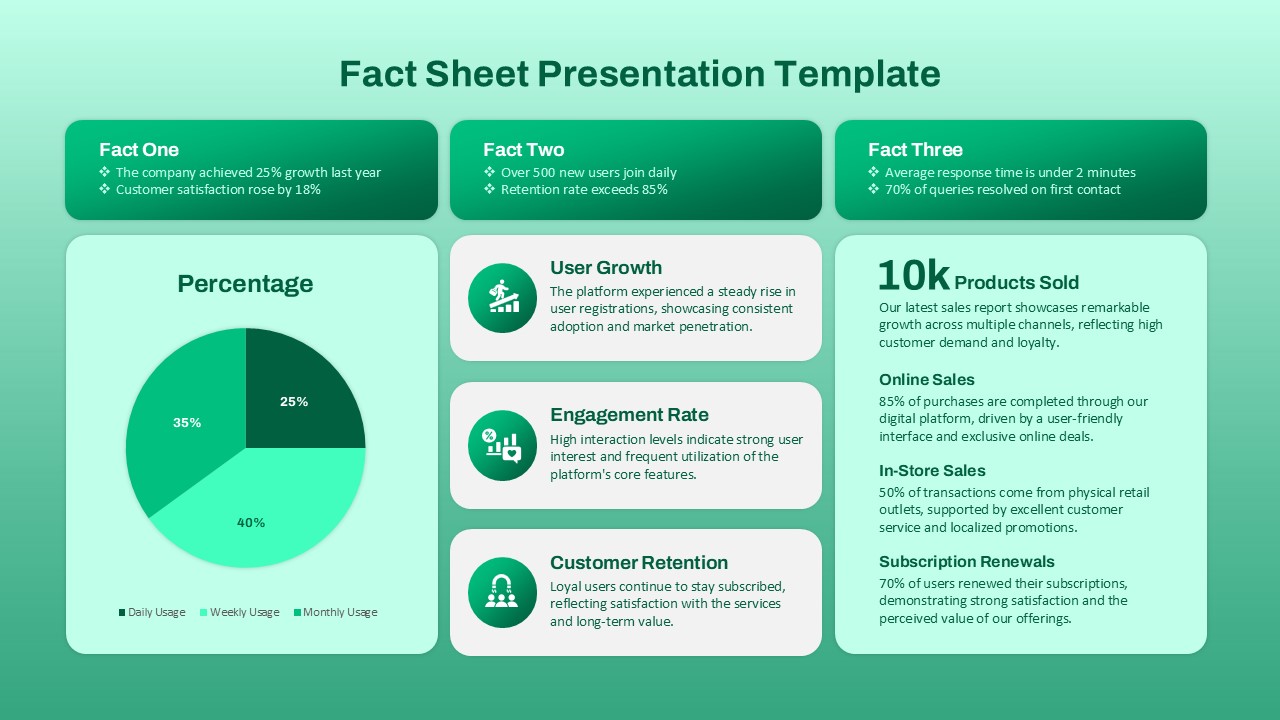
This template is perfect for teams looking to present their Jira dashboard data in a clean and engaging format. The layout includes dedicated sections for highlighting metrics such as project completion percentage, task distribution across categories, and progress toward key performance indicators. The design uses clear, contrasting colors and organized spaces to enhance readability and ensure that your audience can easily absorb the information.
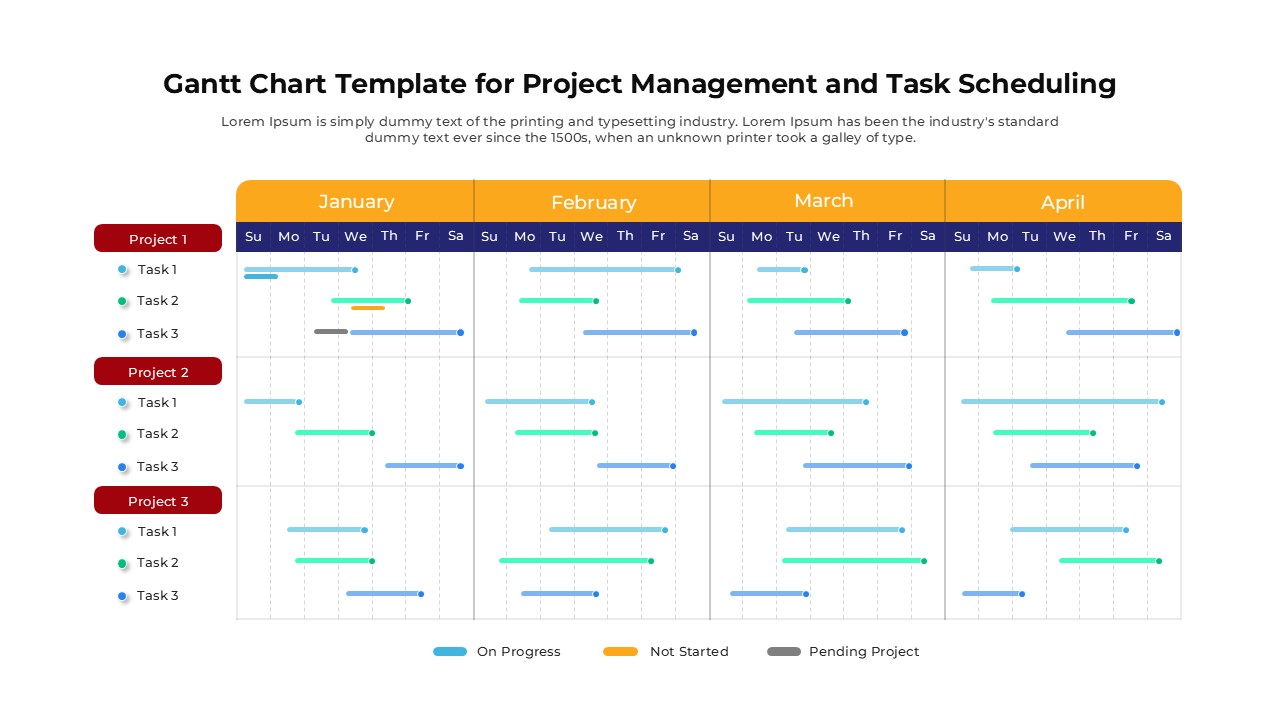
With the flexibility to add custom titles, labels, and data, this template allows you to present detailed project reports, monitor KPIs, and display data trends effectively. Whether for internal team updates, client presentations, or executive briefings, this Jira Dashboard template provides an efficient and visually compelling way to communicate important project insights.
It is fully editable in both PowerPoint and Google Slides, ensuring compatibility and ease of use across platforms.
See more

Aspect Ratio
16:9Item ID
SKT03726
Features of this template
Other User Cases of the Template:
Project reporting, team performance tracking, executive presentations, task management updates, KPI monitoring, client project status reports, milestone tracking, progress presentations, data analysis, agile project management.FAQs
You May Also Like These Presentation Templates


- Free
- Free
- Free

- Free

- Free

- Free
- Free

- Free