Customer Feedback Analysis Dashboard Template for PowerPoint & Google Slides
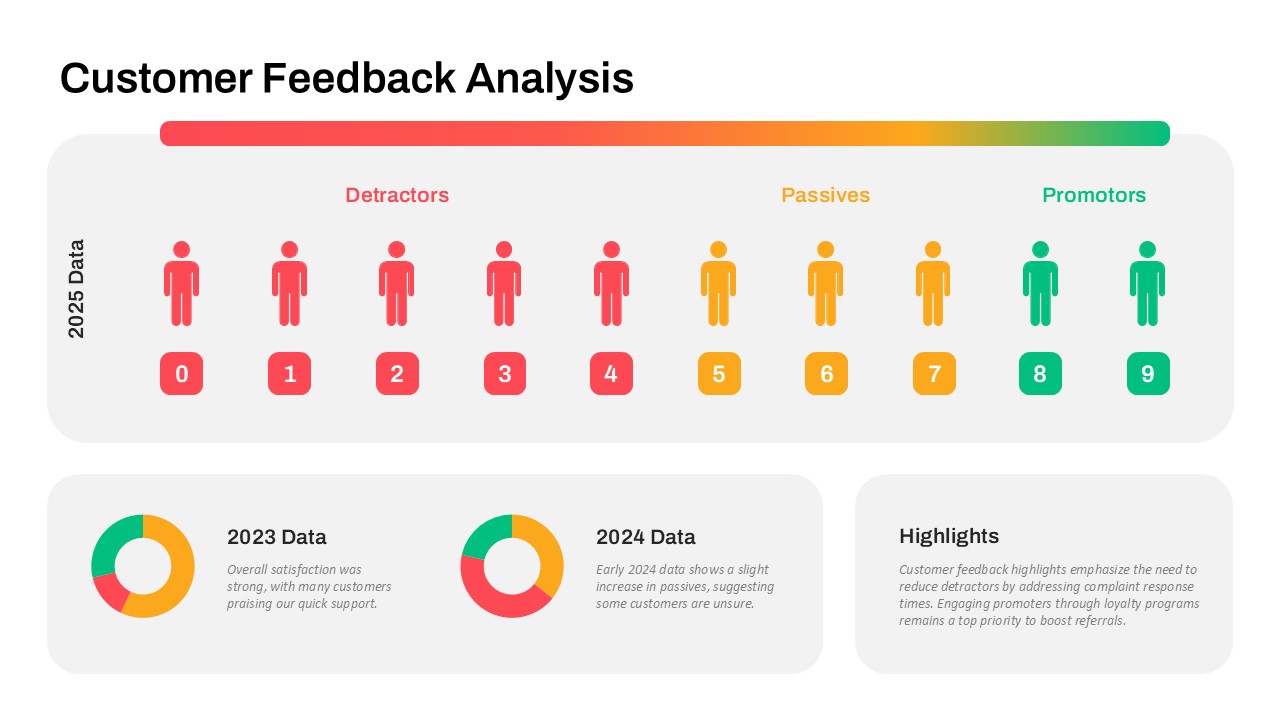
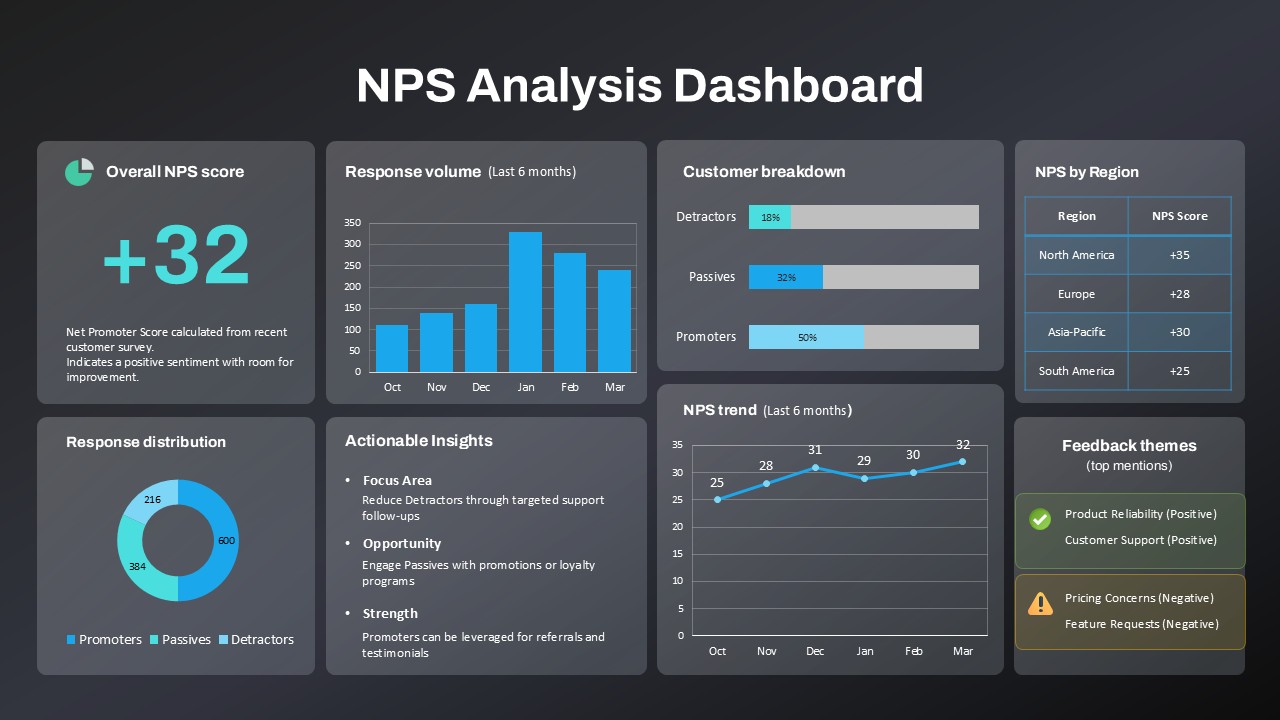
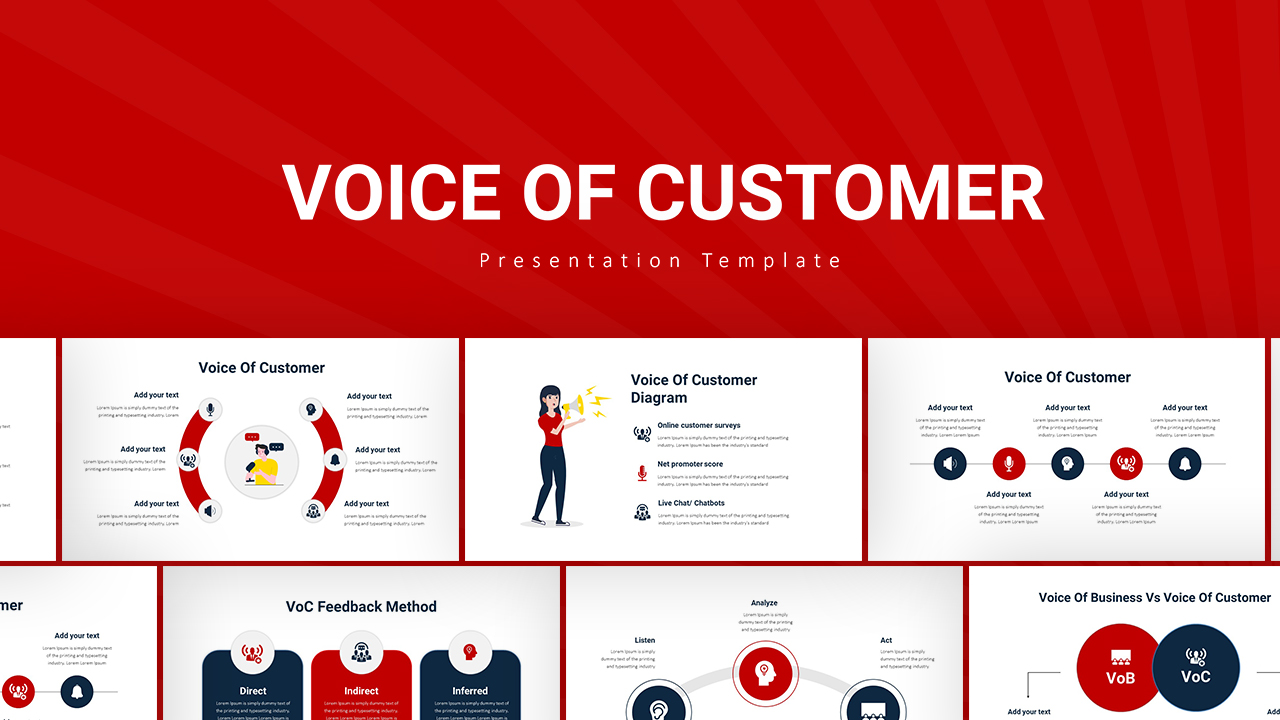
The Customer Feedback Analysis Dashboard PowerPoint Template is a dynamic and data-driven tool designed to present customer satisfaction insights with clarity and precision. This template visually breaks down customer feedback into key categories—Detractors, Passives, and Promoters—using engaging color-coded visuals that make it easy to track and analyze sentiment across multiple years.
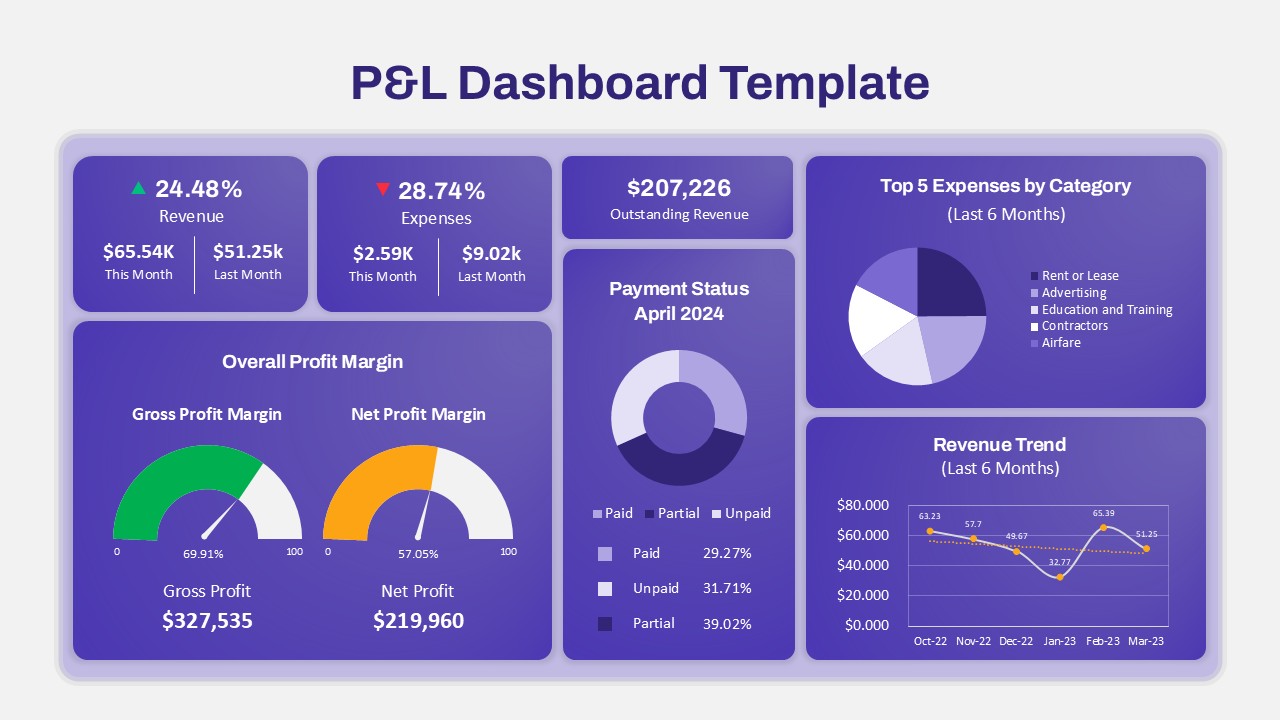
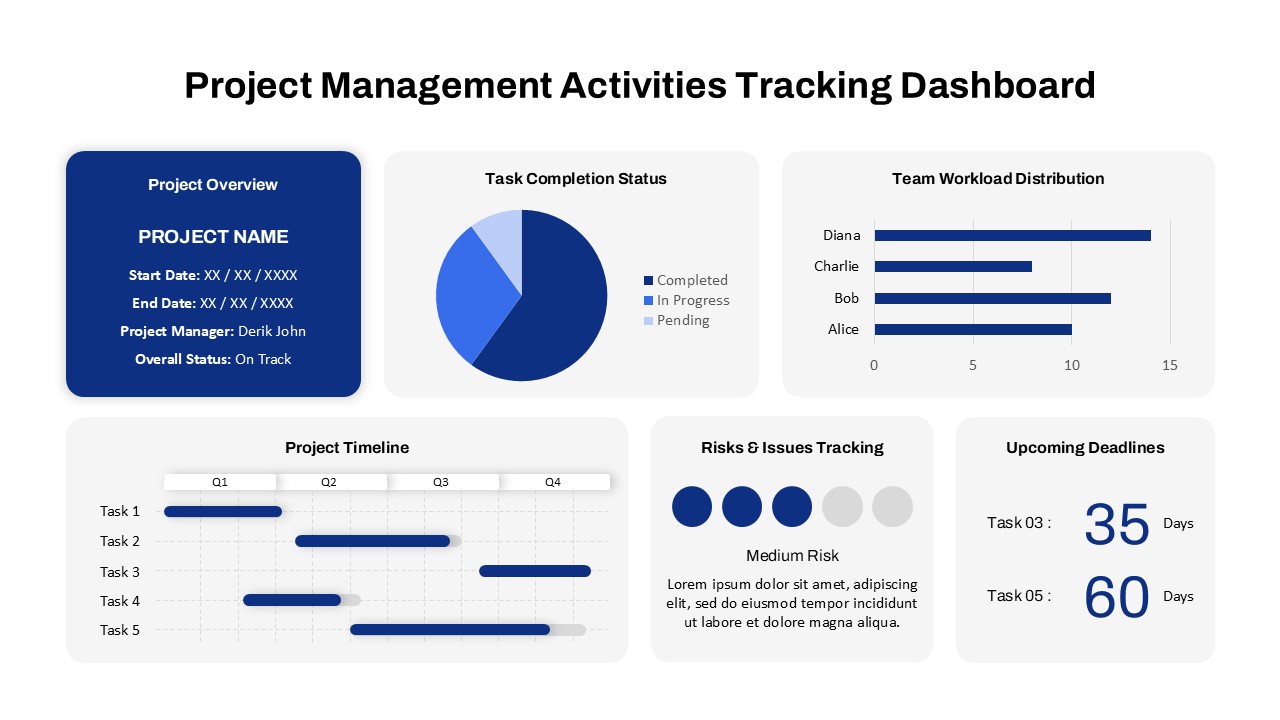
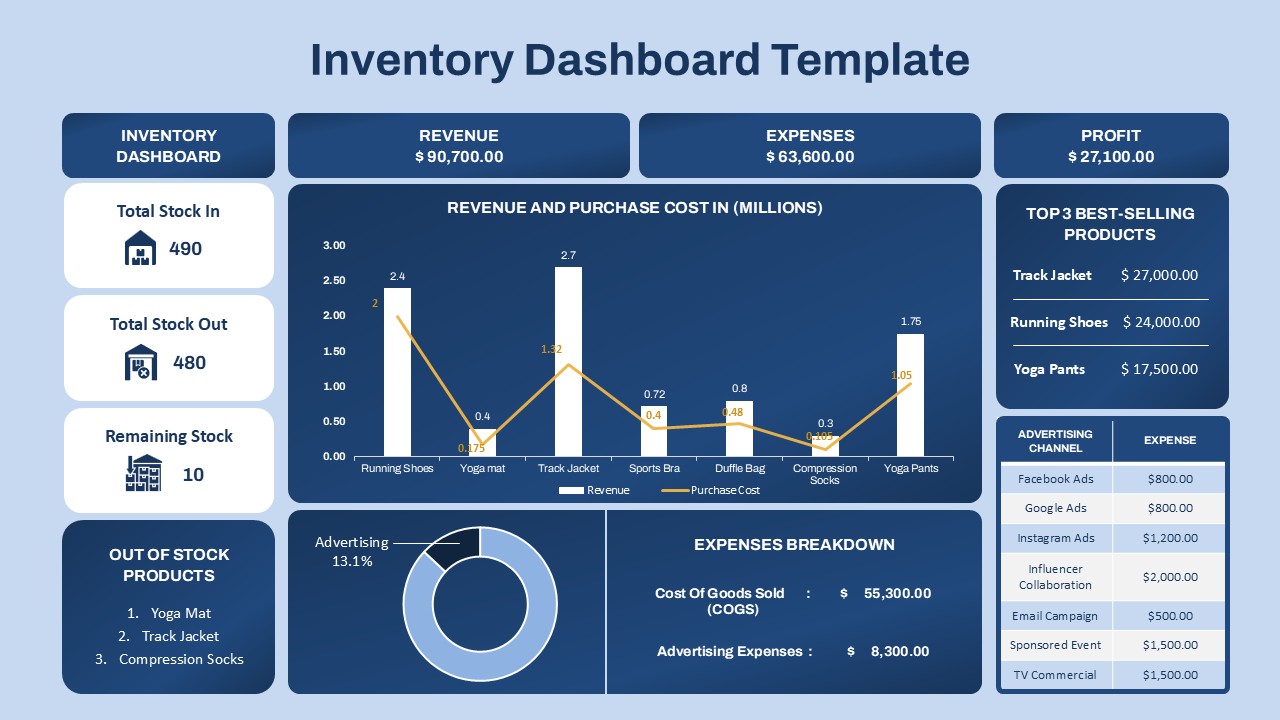
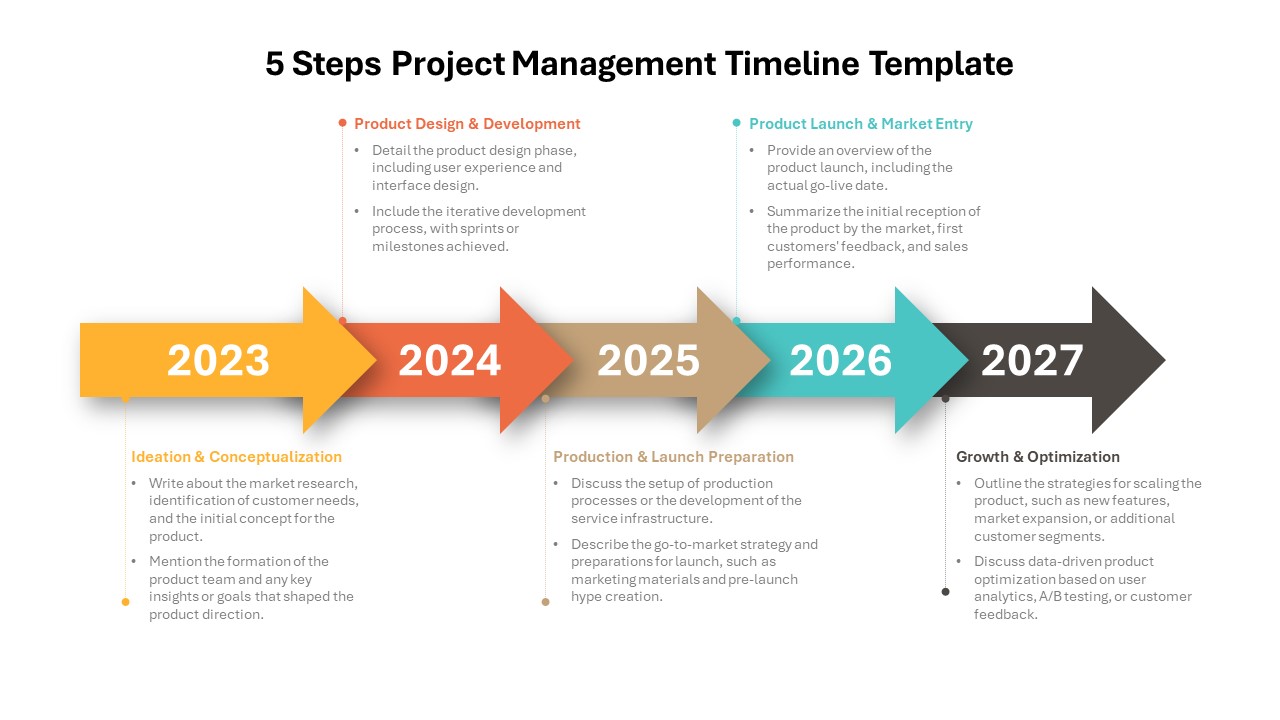
The template highlights data from three key years: 2023, 2024, and 2025, providing a historical perspective and helping identify trends in customer satisfaction. This visual breakdown enables businesses to assess how well they’re doing in terms of customer loyalty and identify areas needing improvement. The pie charts and user-friendly infographics allow for a clear comparison of how many customers fall into each category and what that means for business performance.
This template is perfect for marketing managers, customer experience specialists, and business analysts who need to present detailed feedback reports or strategic recommendations based on customer data. It allows for easy customization in both PowerPoint and Google Slides, ensuring accessibility and flexibility for any presentation setting.
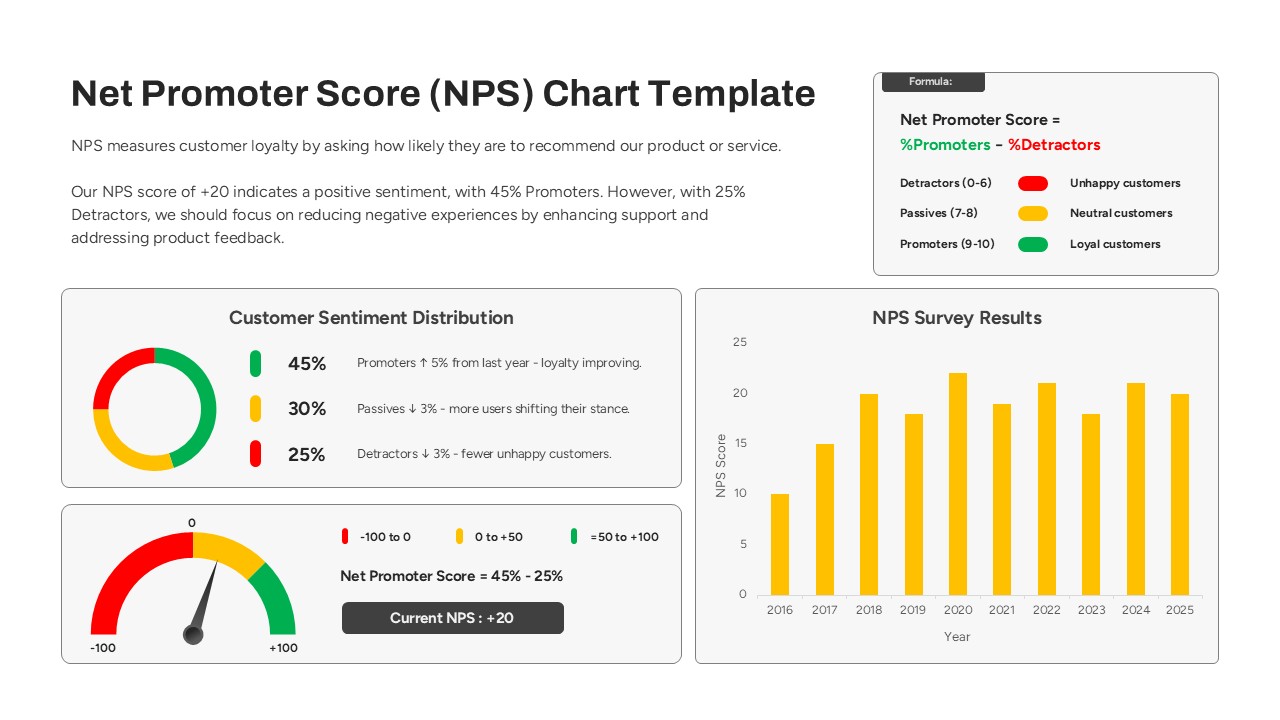
Whether you’re evaluating your customer service performance, analyzing NPS (Net Promoter Score), or reporting on yearly changes in customer satisfaction, this template serves as a professional and effective tool to communicate insights and guide decision-making.
See more

Aspect Ratio
16:9Item ID
SKT04042
Features of this template
FAQs
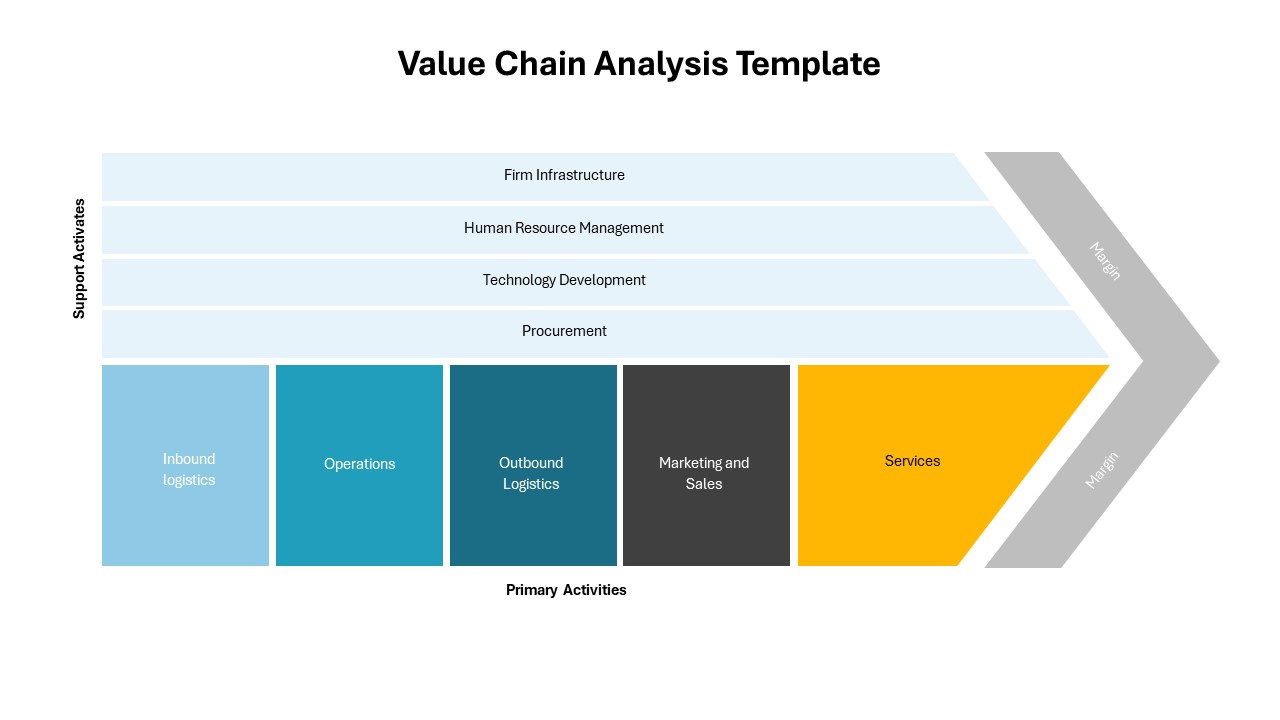
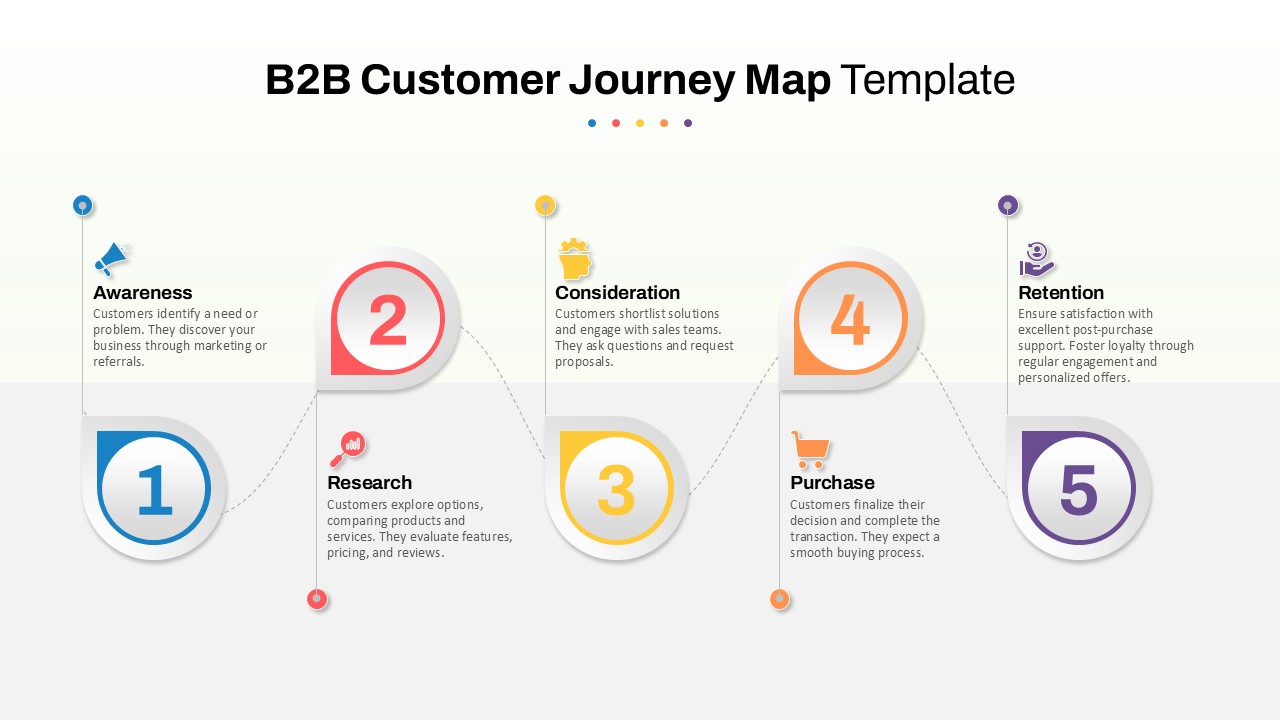
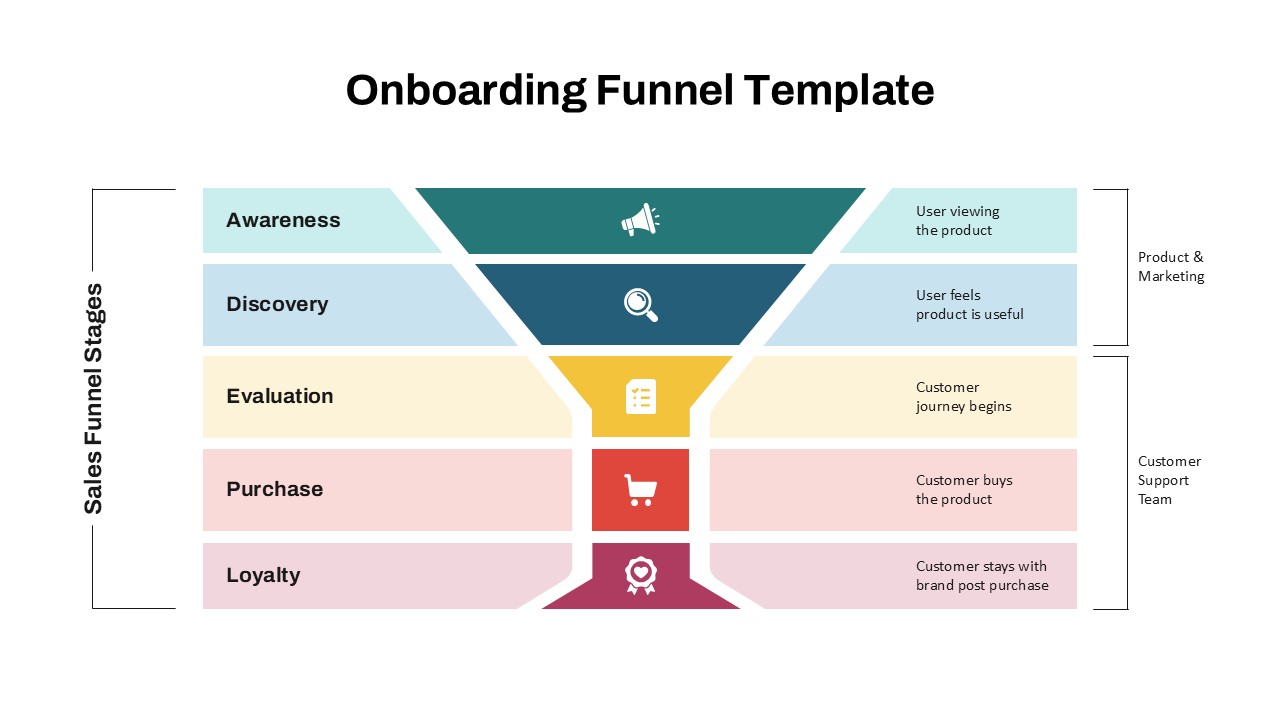
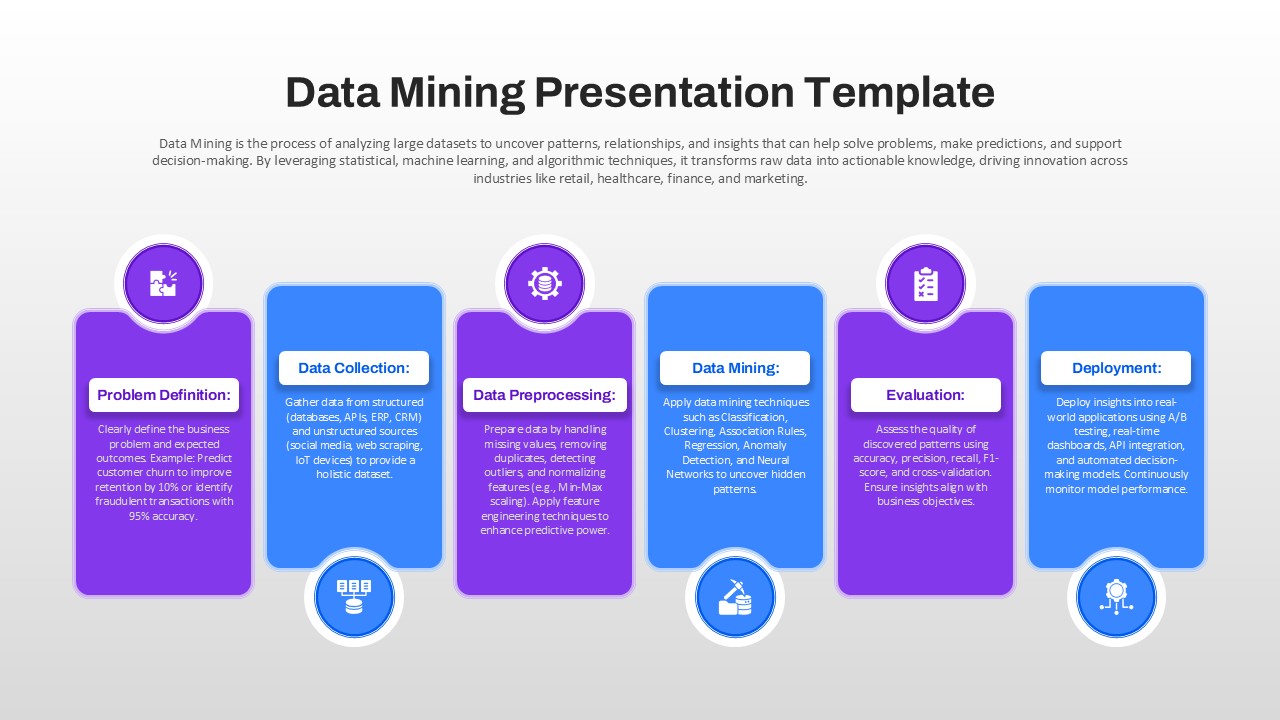
You May Also Like These Presentation Templates


- Free

- Free
- Free
- Free


- Free
- Free