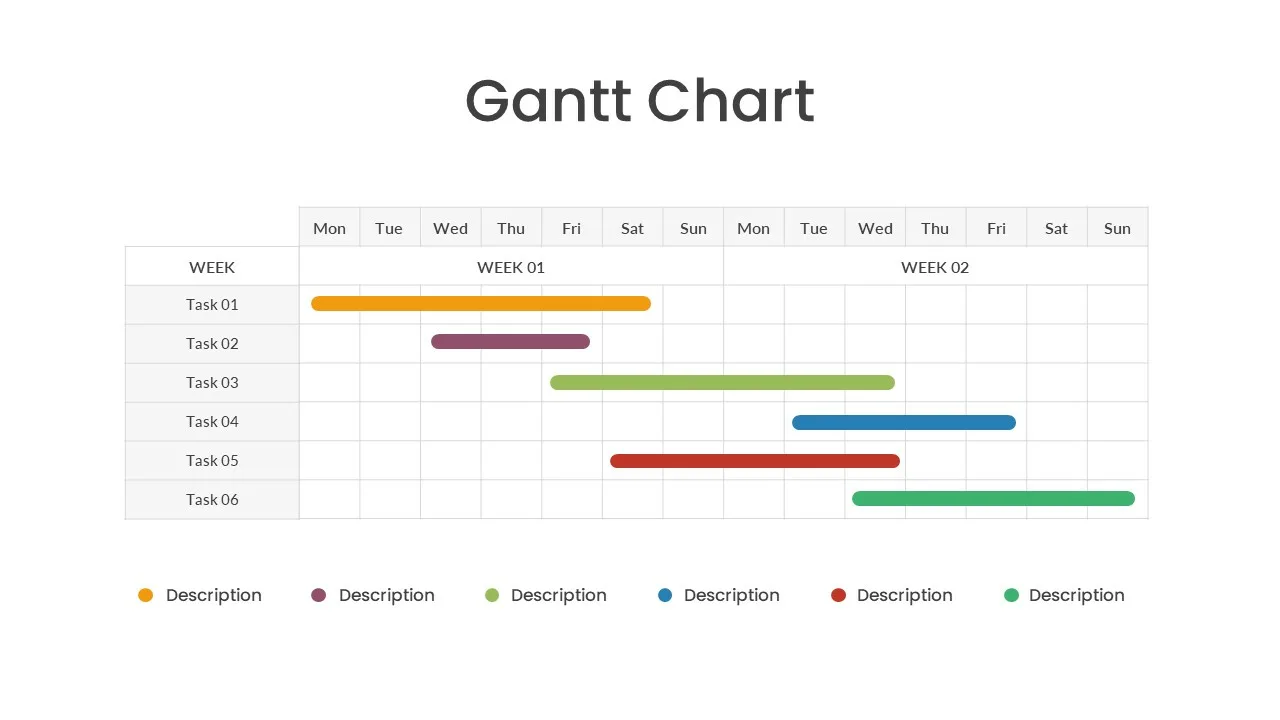
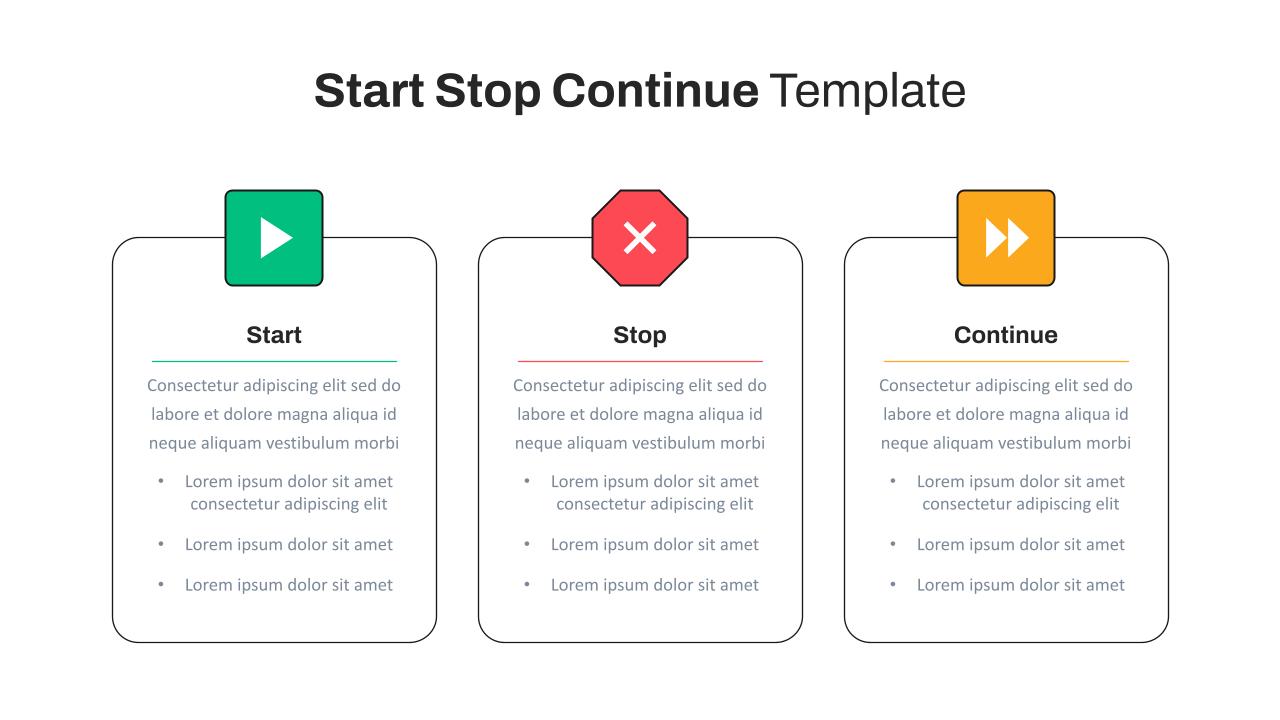
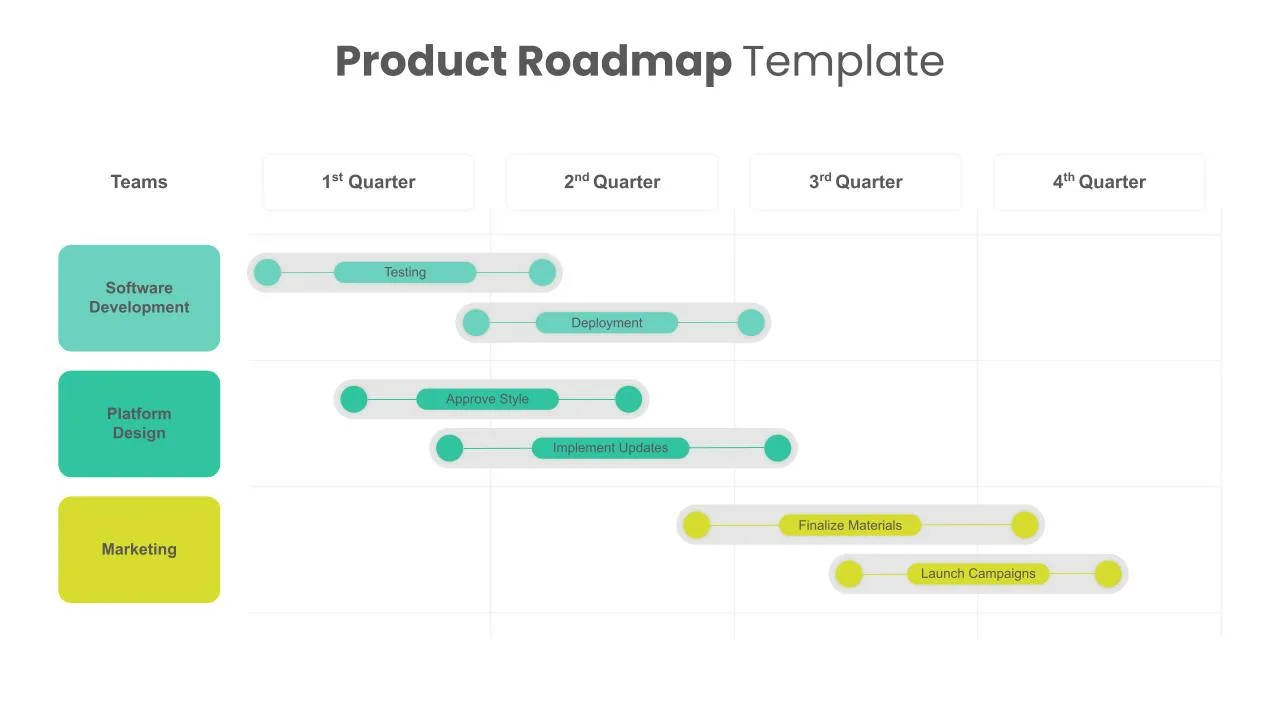
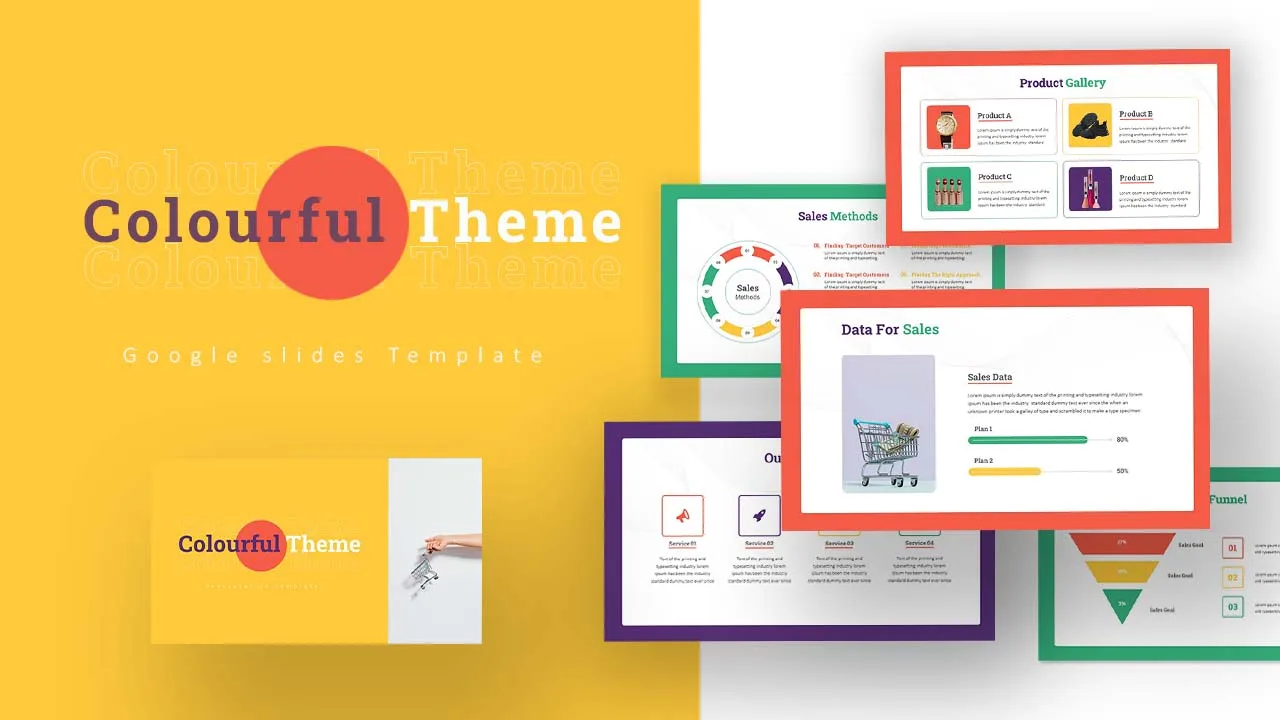
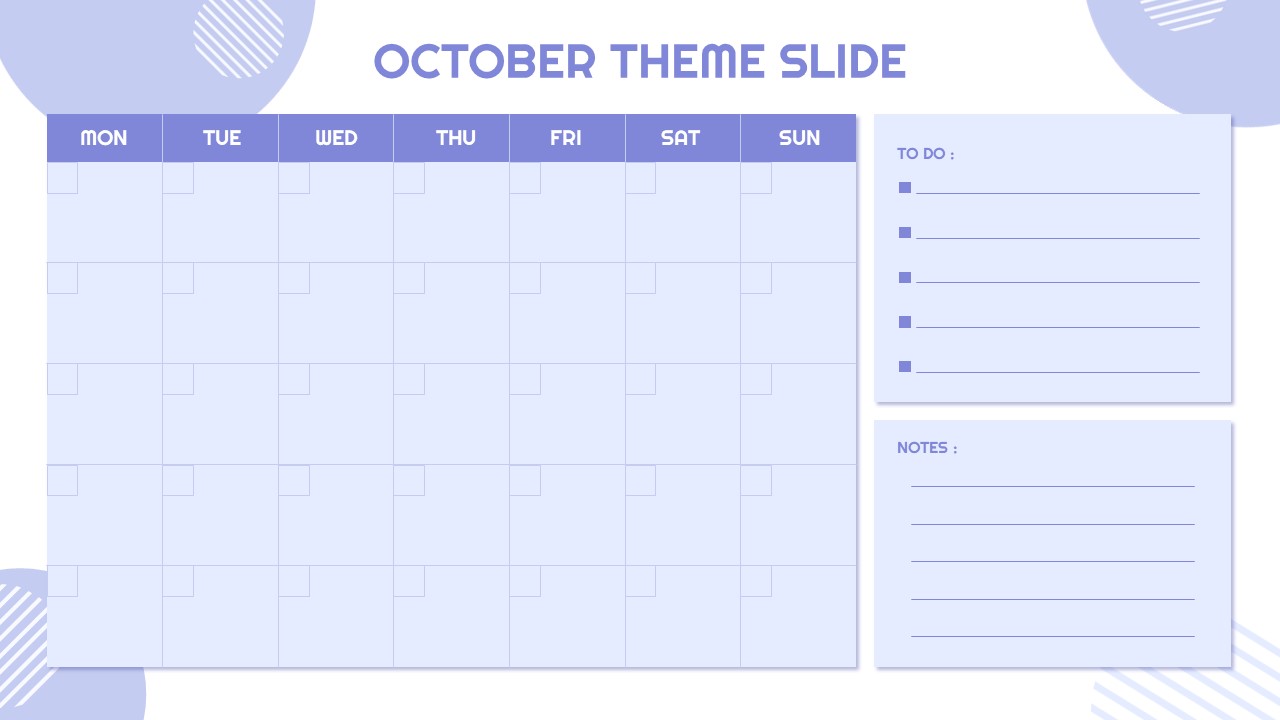
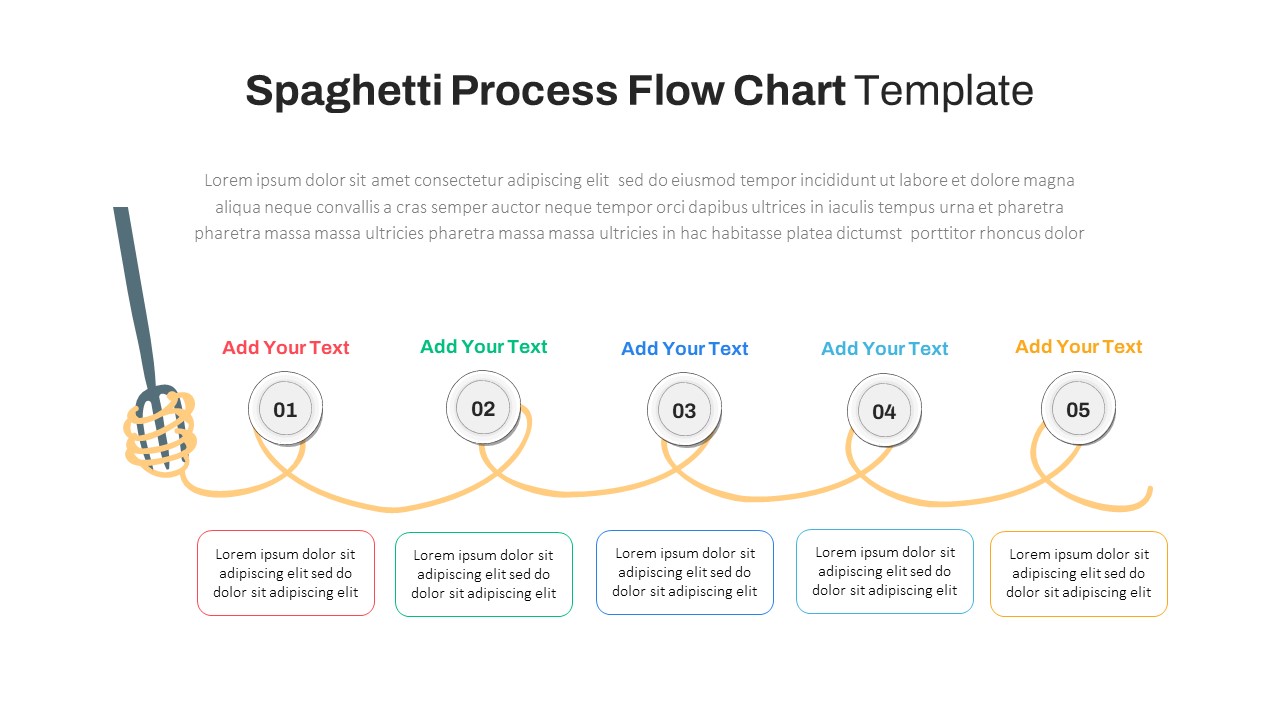
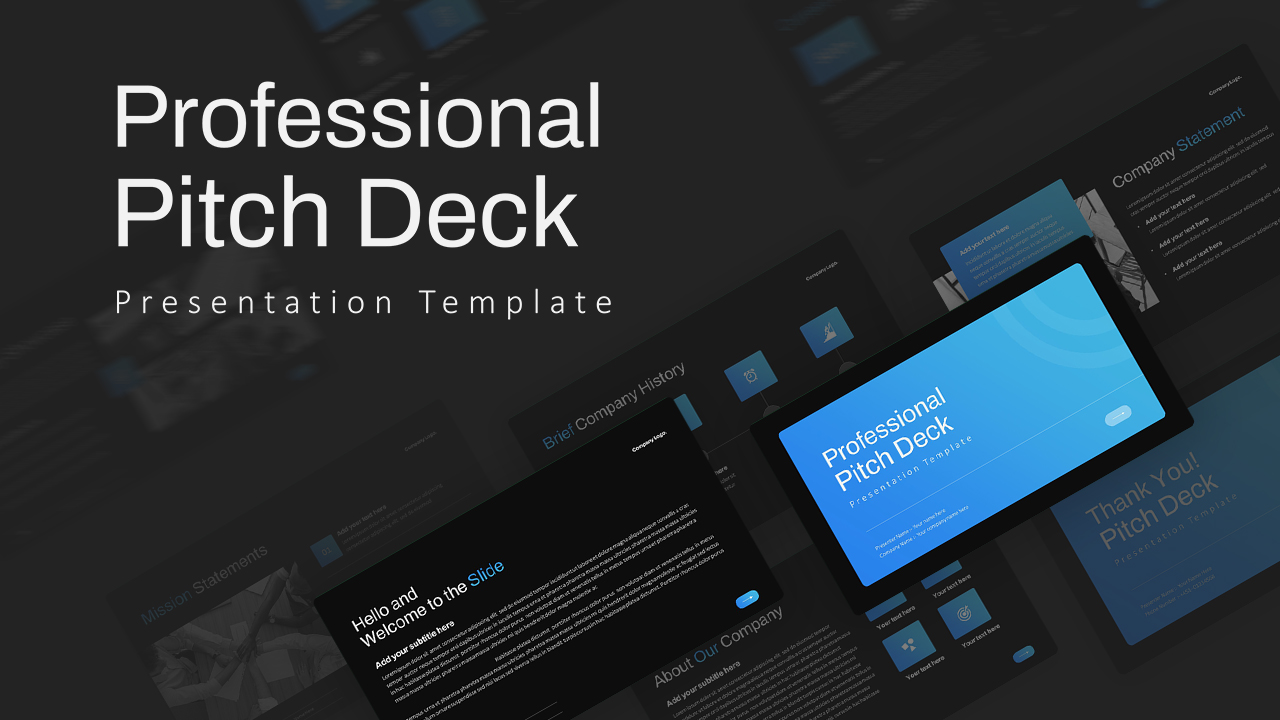
Weekly Gantt Chart Template

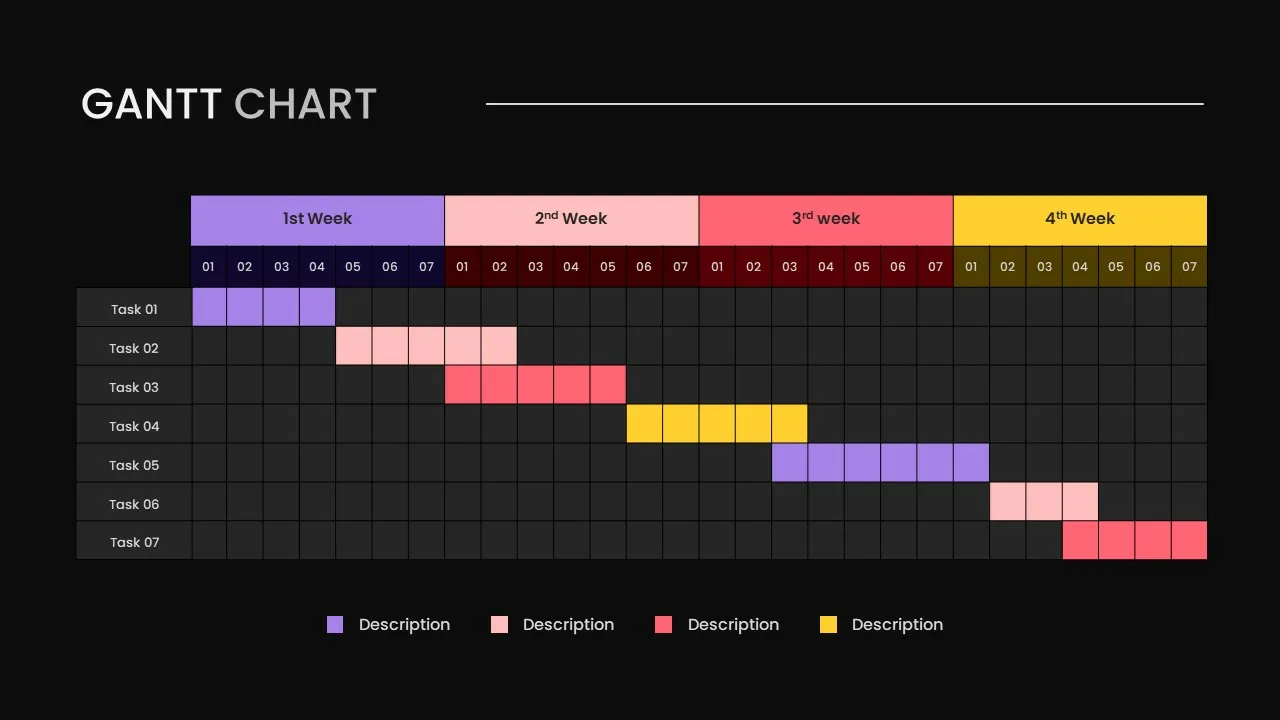
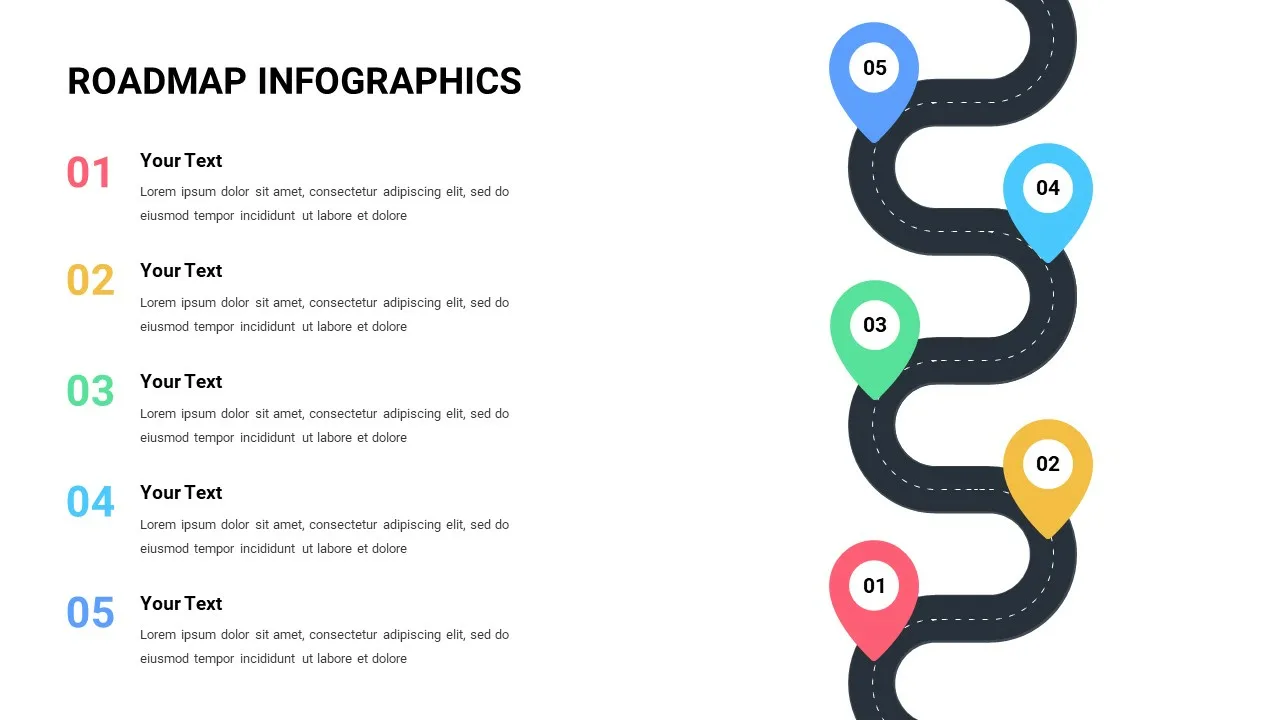
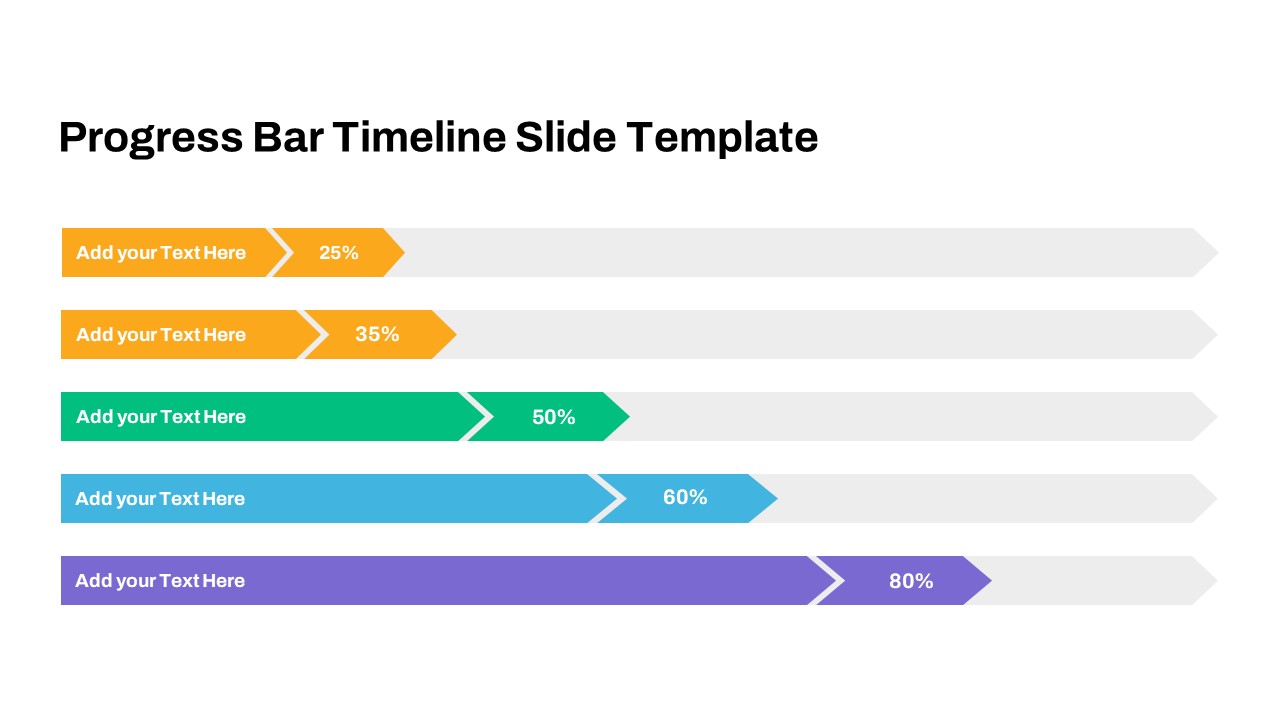
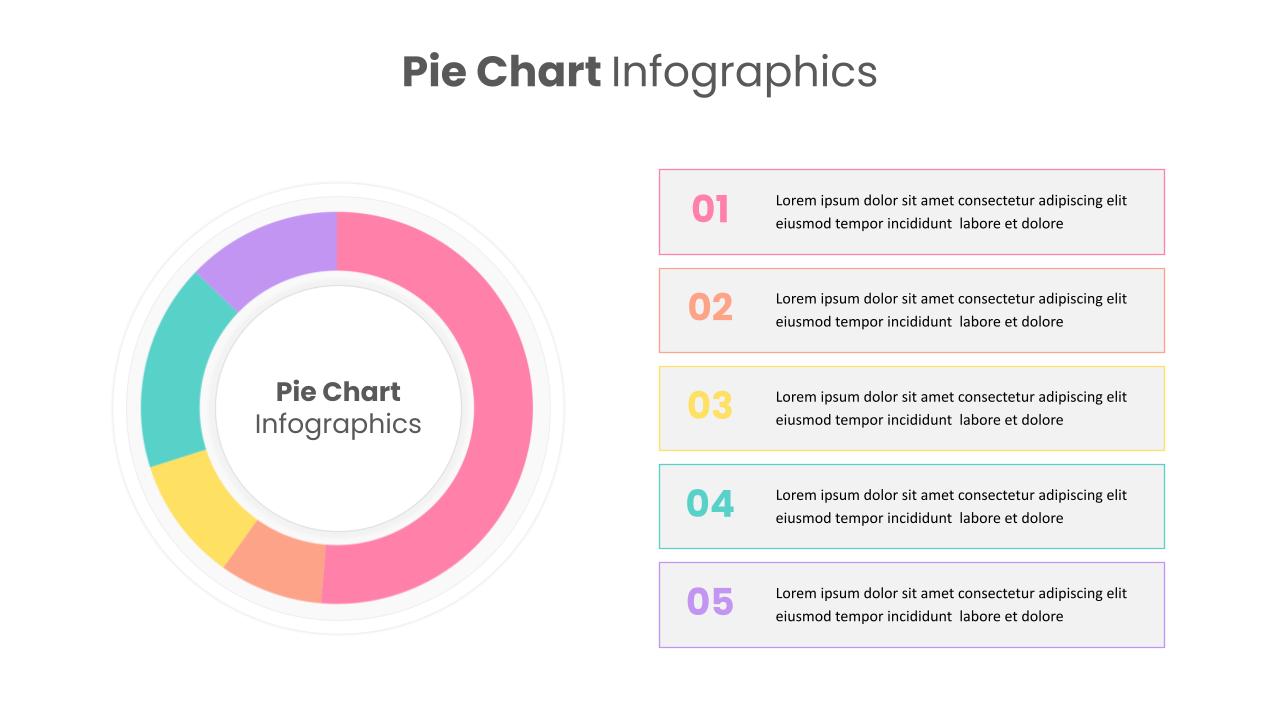
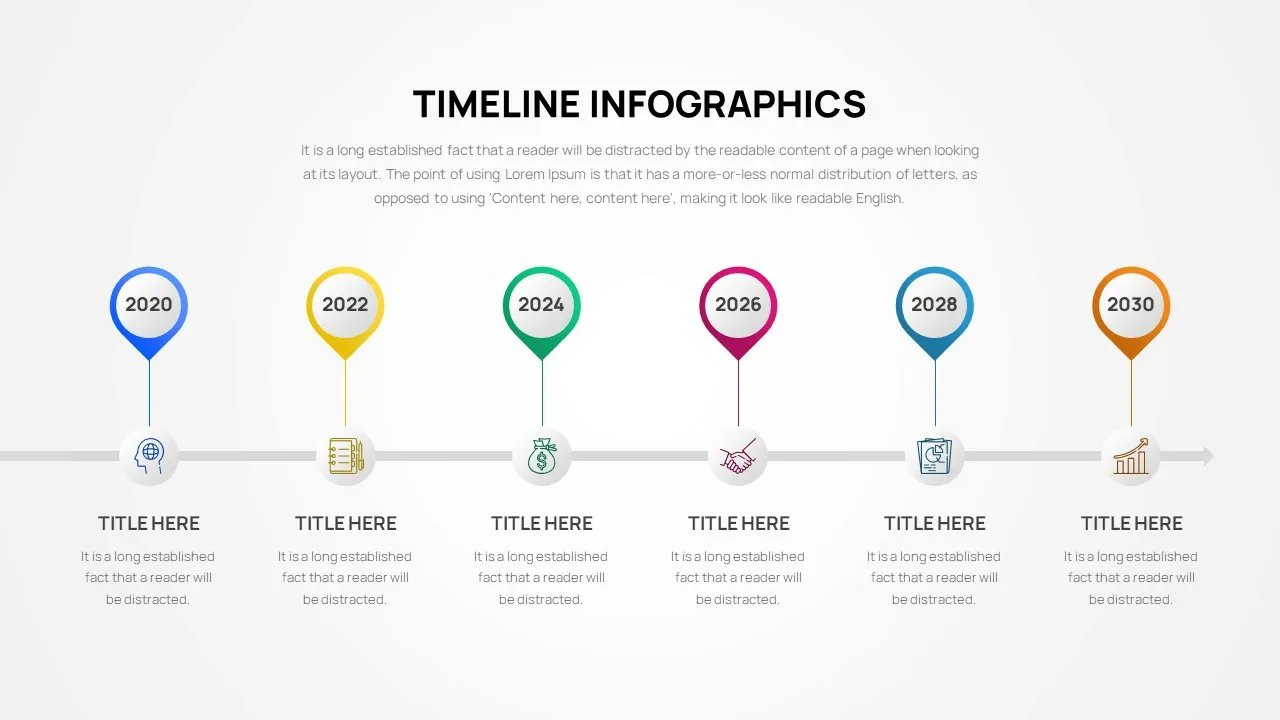
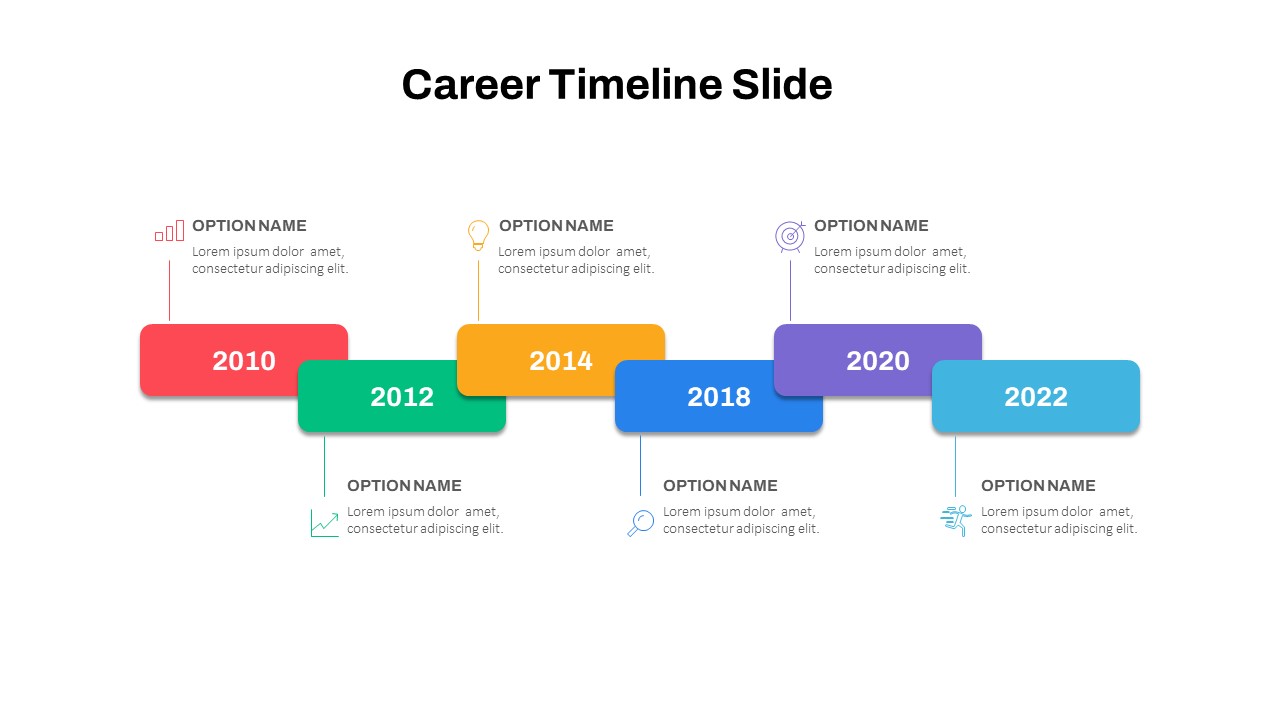
The presentation infographics slides for gantt chart google slides contain striking color schemes to catch the utmost audience’s attention. Gantt charts are best for making project management, project planning, and personal planning presentation in a visually appealing chart design. It shows compilations of tasks and time within the chart structure. The upper part of the Gannt chart represents months, and the main body comprises tasks pointing to different colors. On the bottom side, you can see the color indications. The dark and white variations help in selecting the appropriate one according to the needs and requirements. Download the Gantt chart presentation templates now!
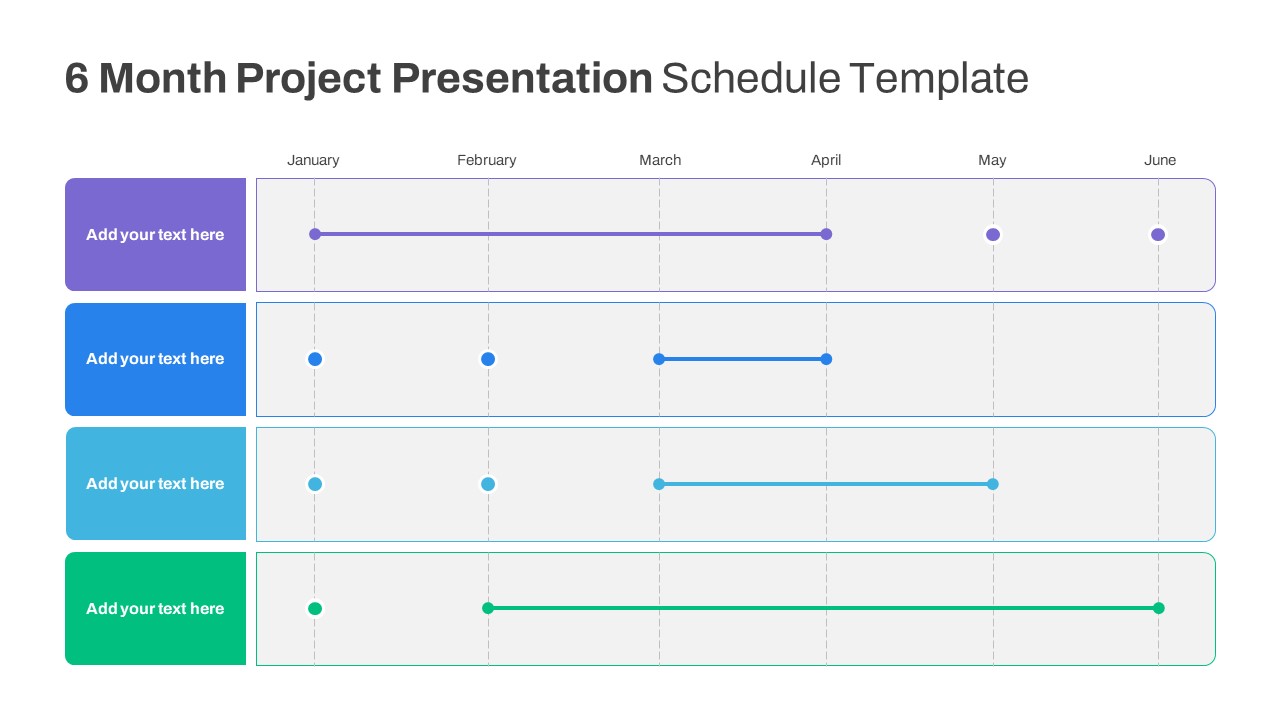
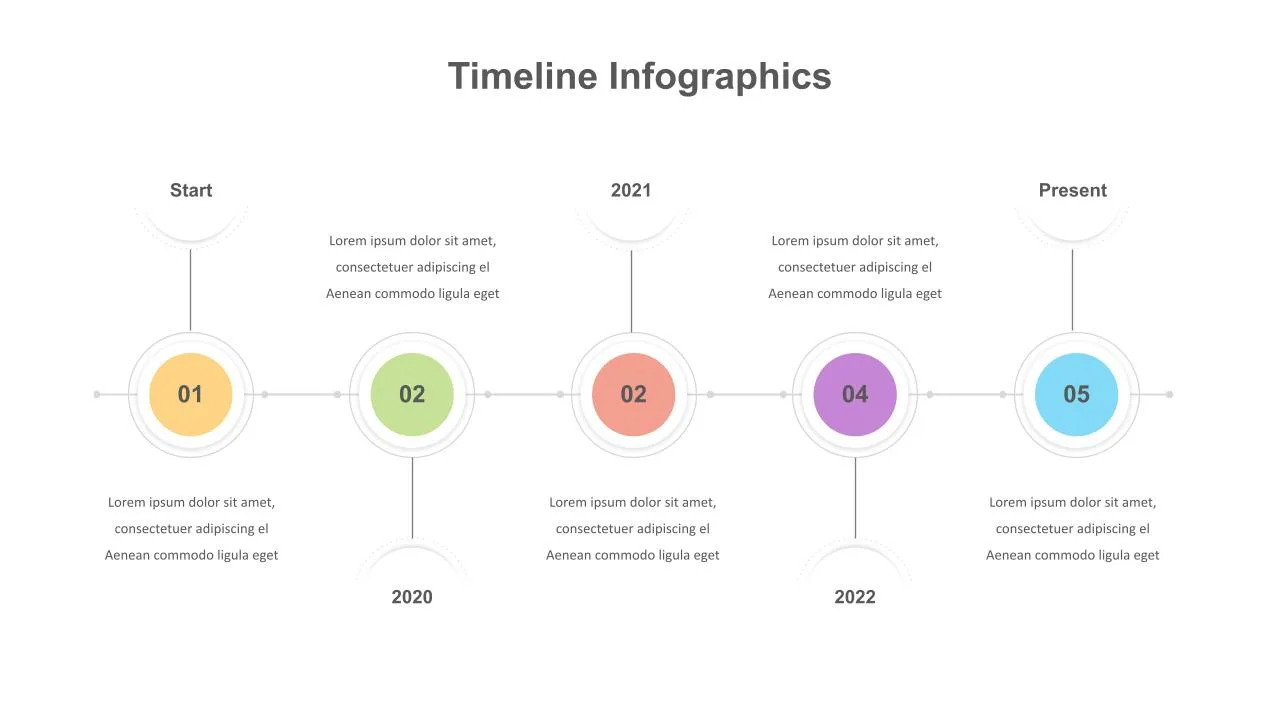
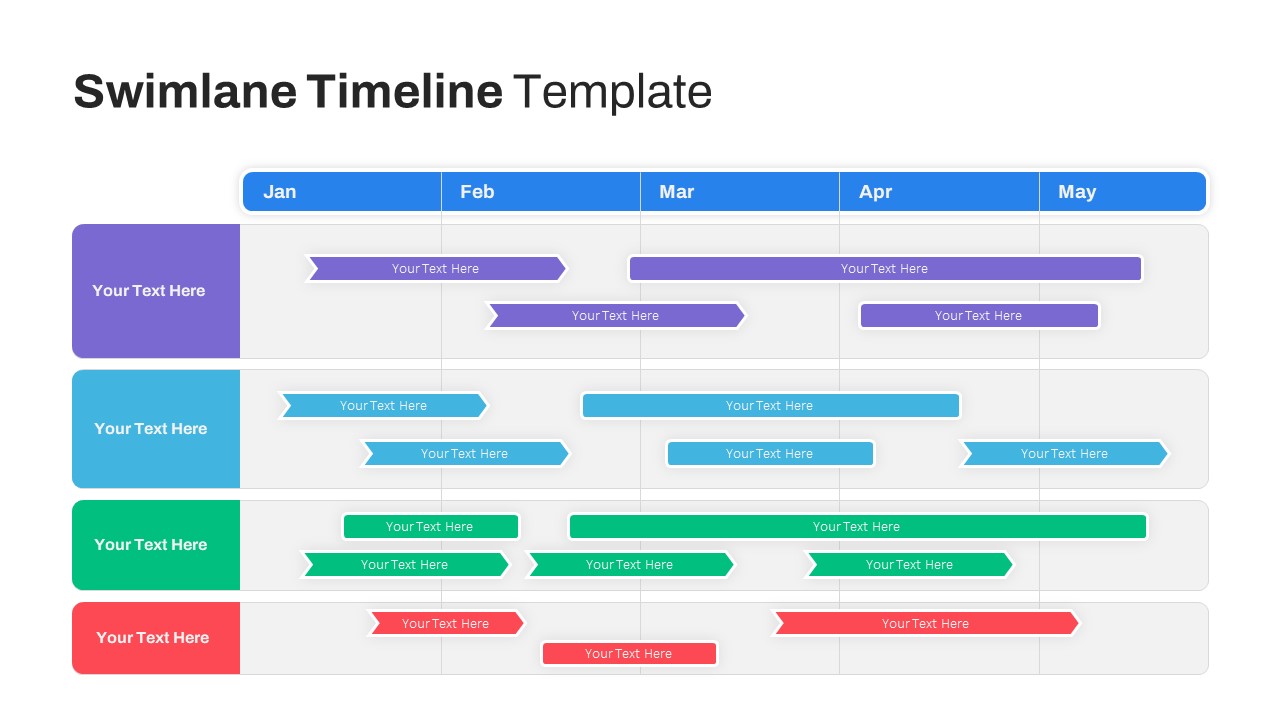
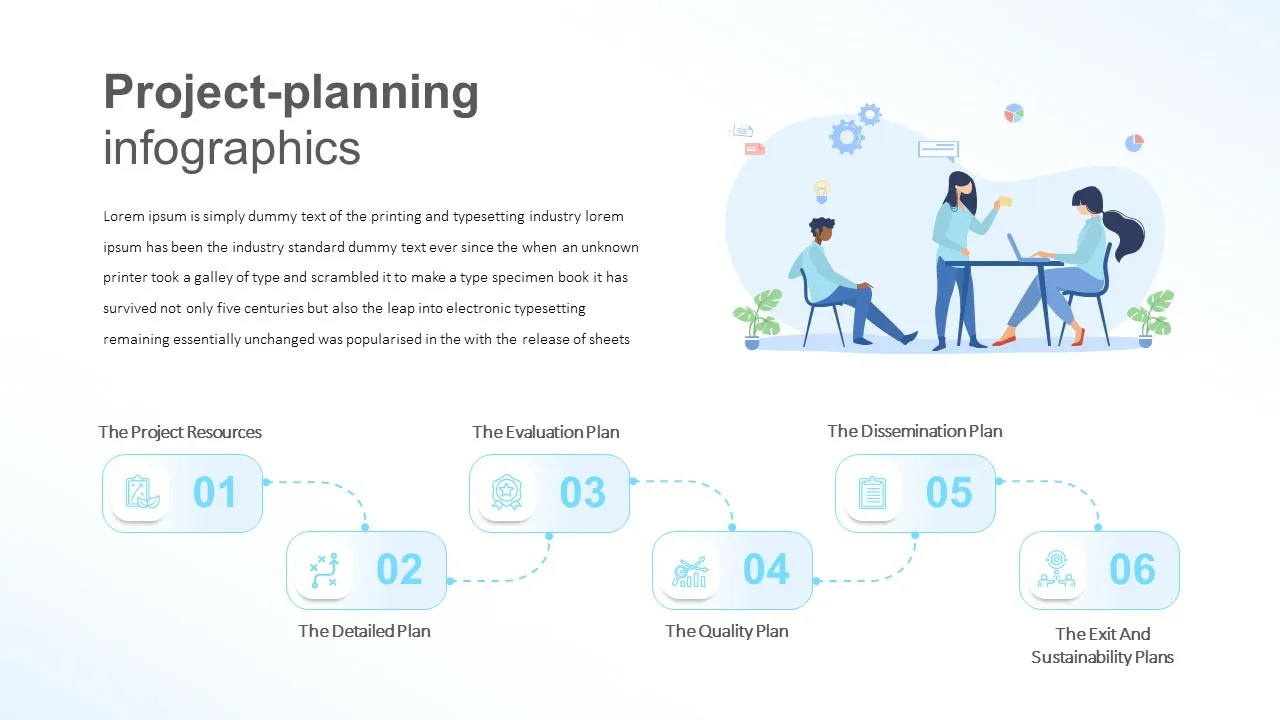
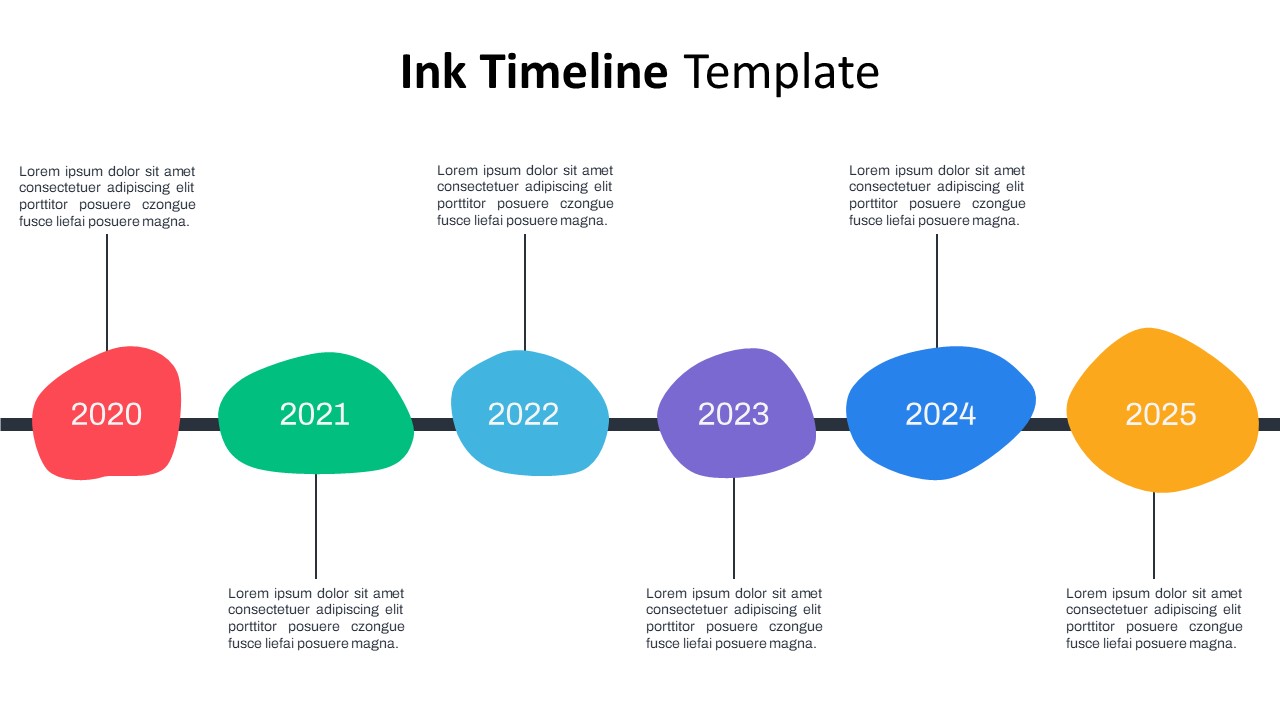
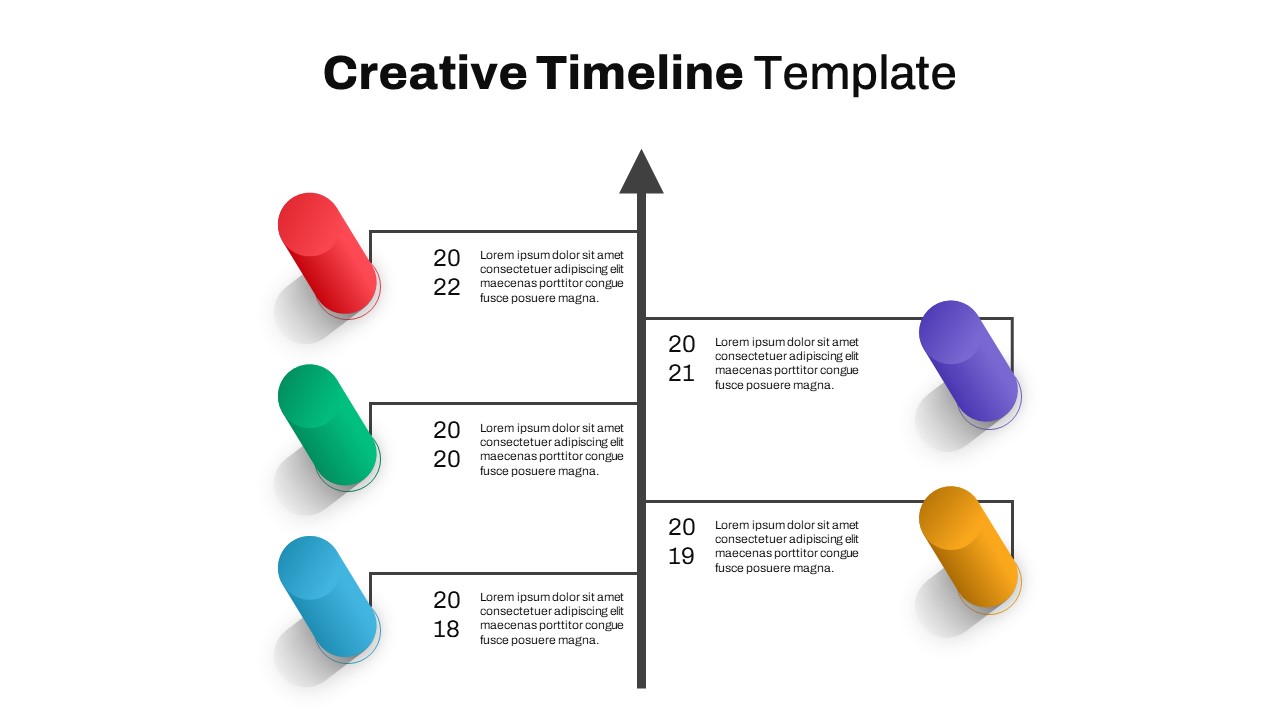
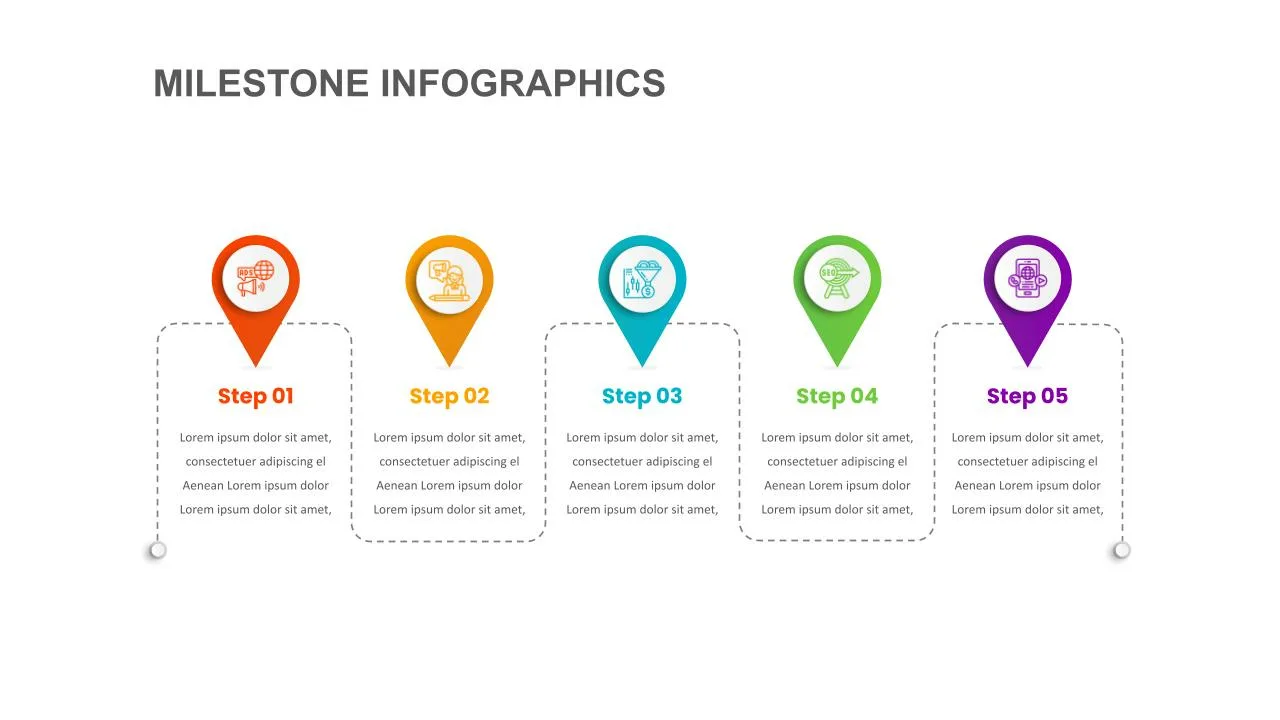
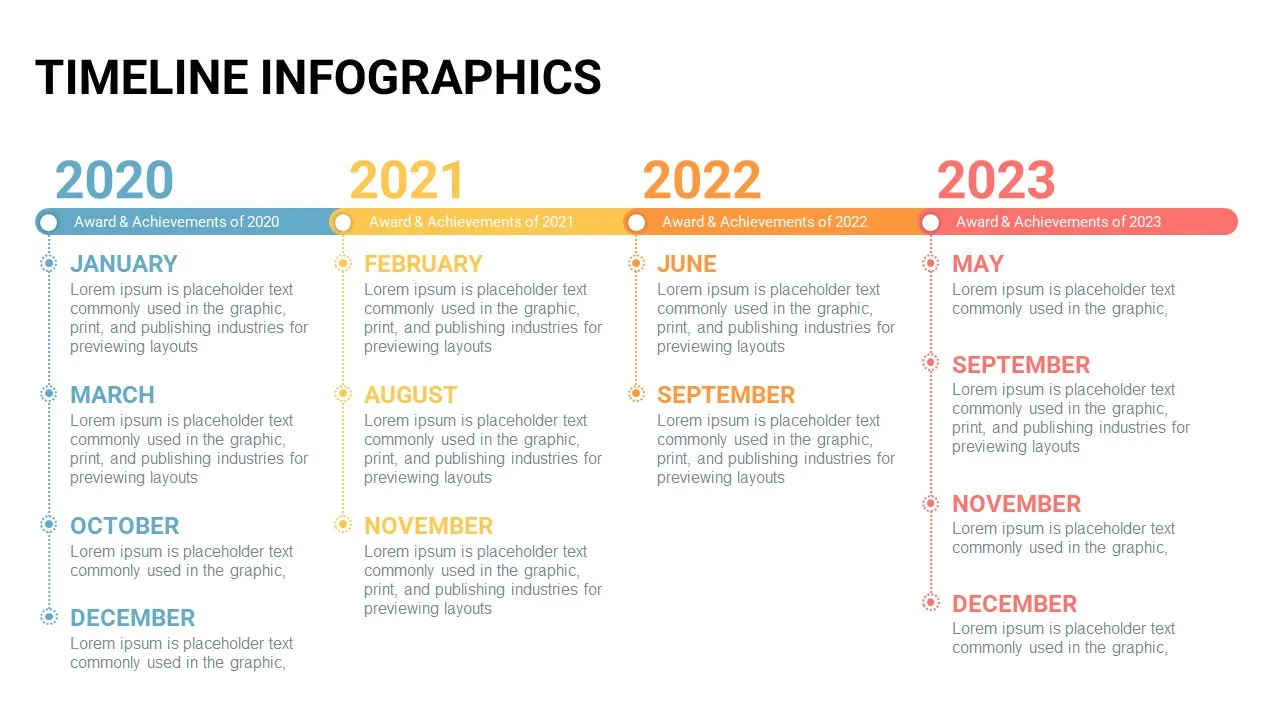
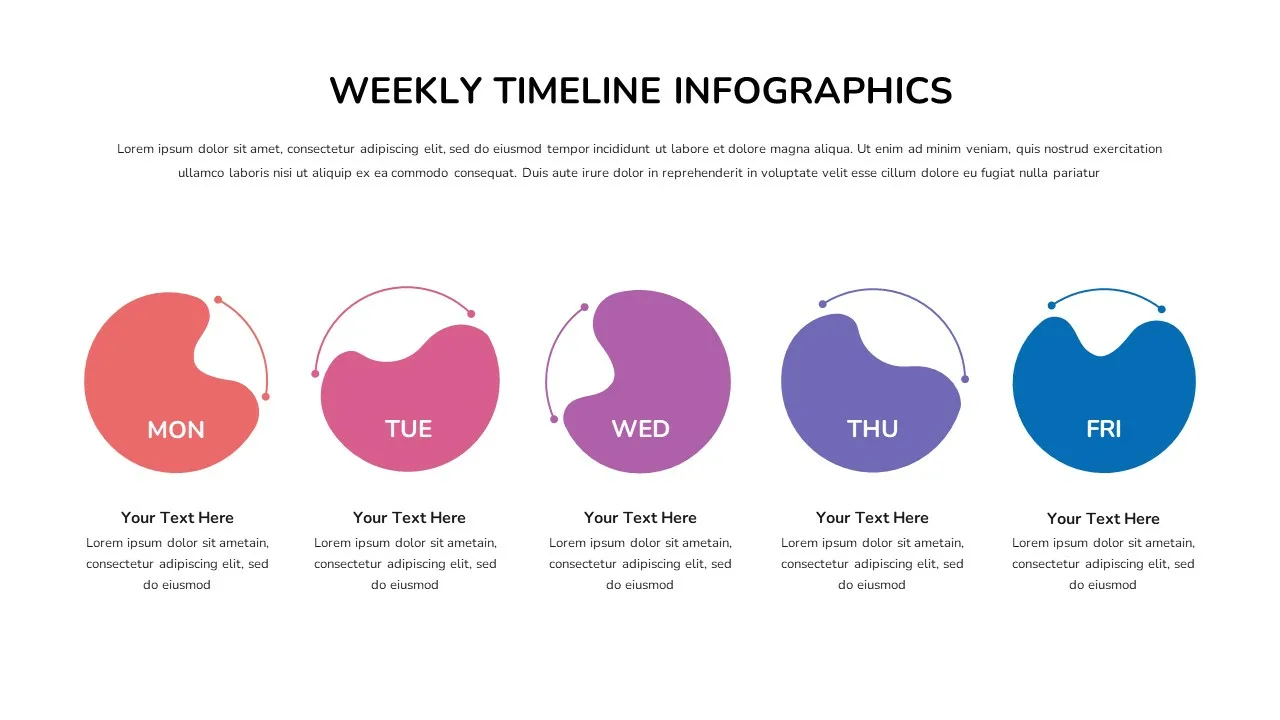
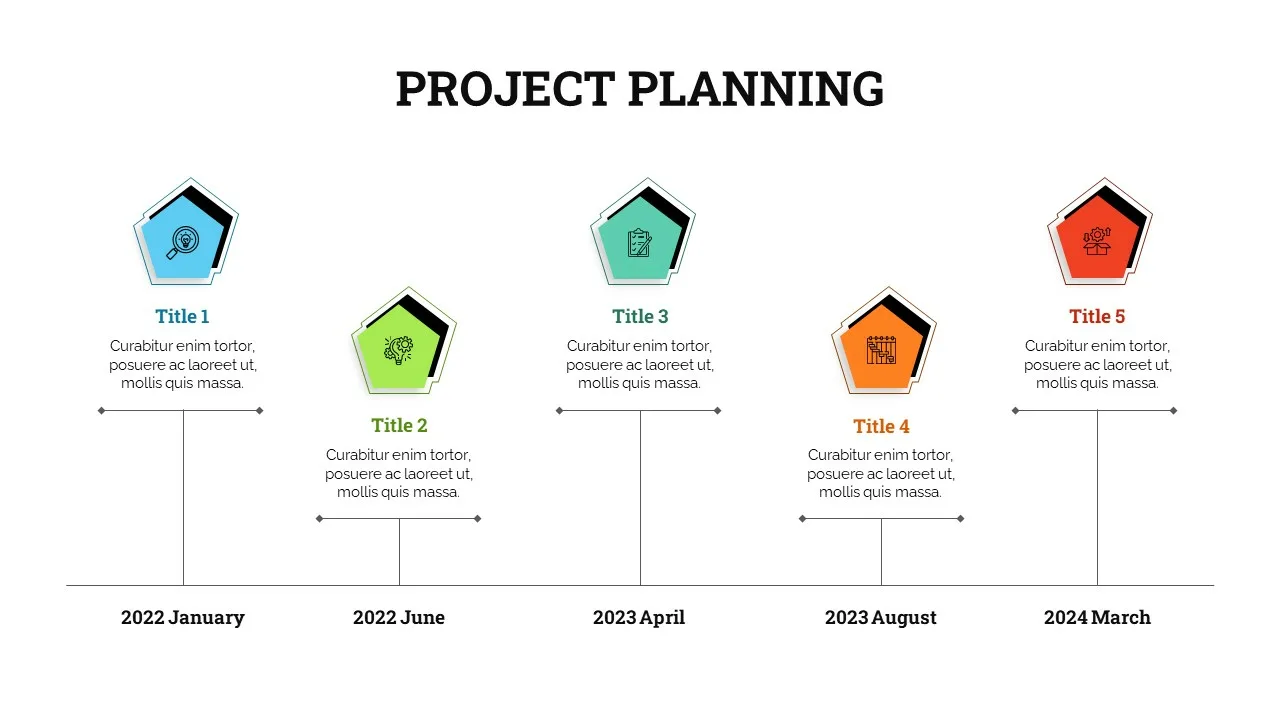
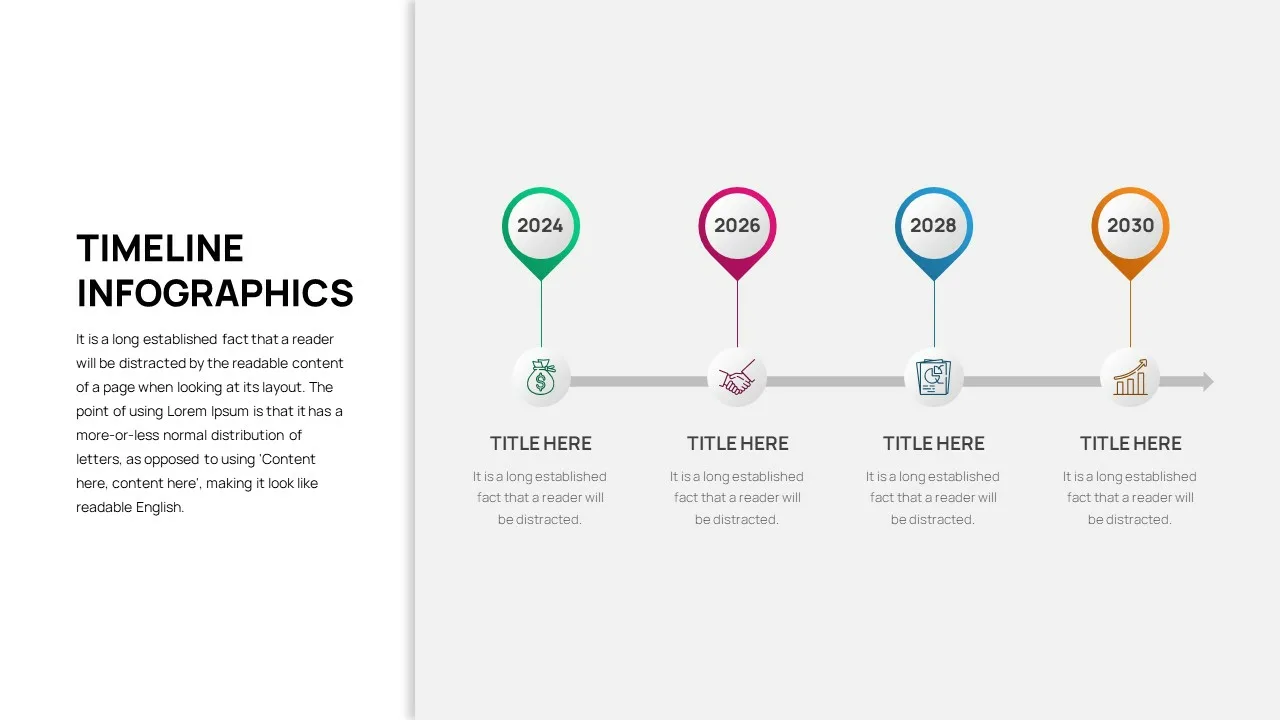
For even more visual tools to illustrate project timelines, consider using our google slide timeline templates. These templates offer a user-friendly and eye-catching way to showcase project milestones, deadlines, and progress. By combining both the Gantt chart Google Slides and Google Slide timeline templates, you can create comprehensive presentations that effectively communicate project plans and schedules while captivating your audience with visually appealing charts and timelines
See more

Aspect Ratio
16:9Item ID
SKT00324
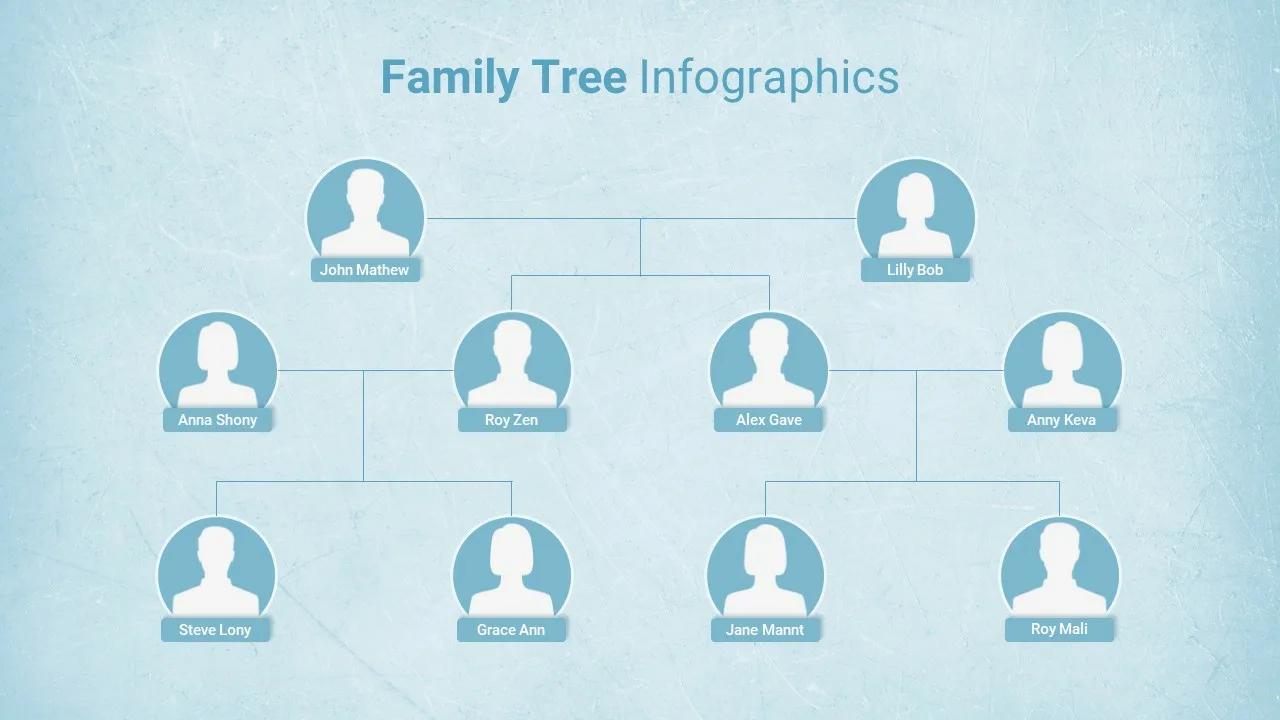
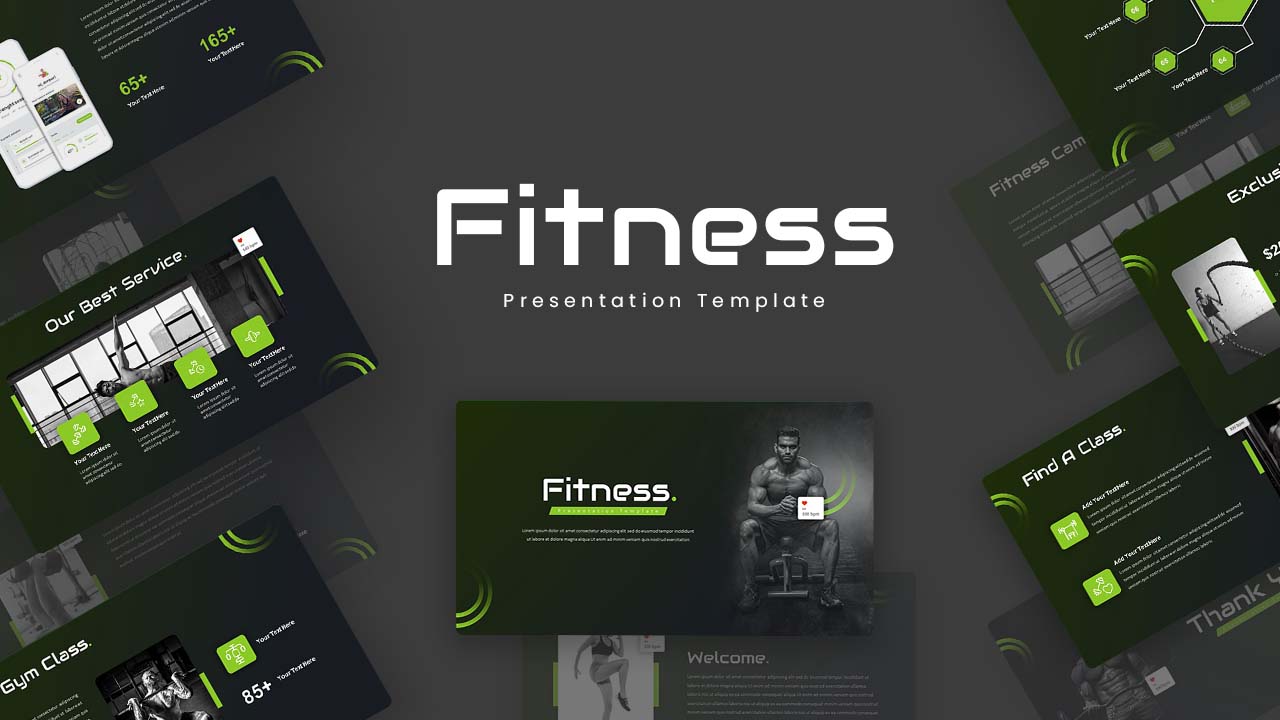
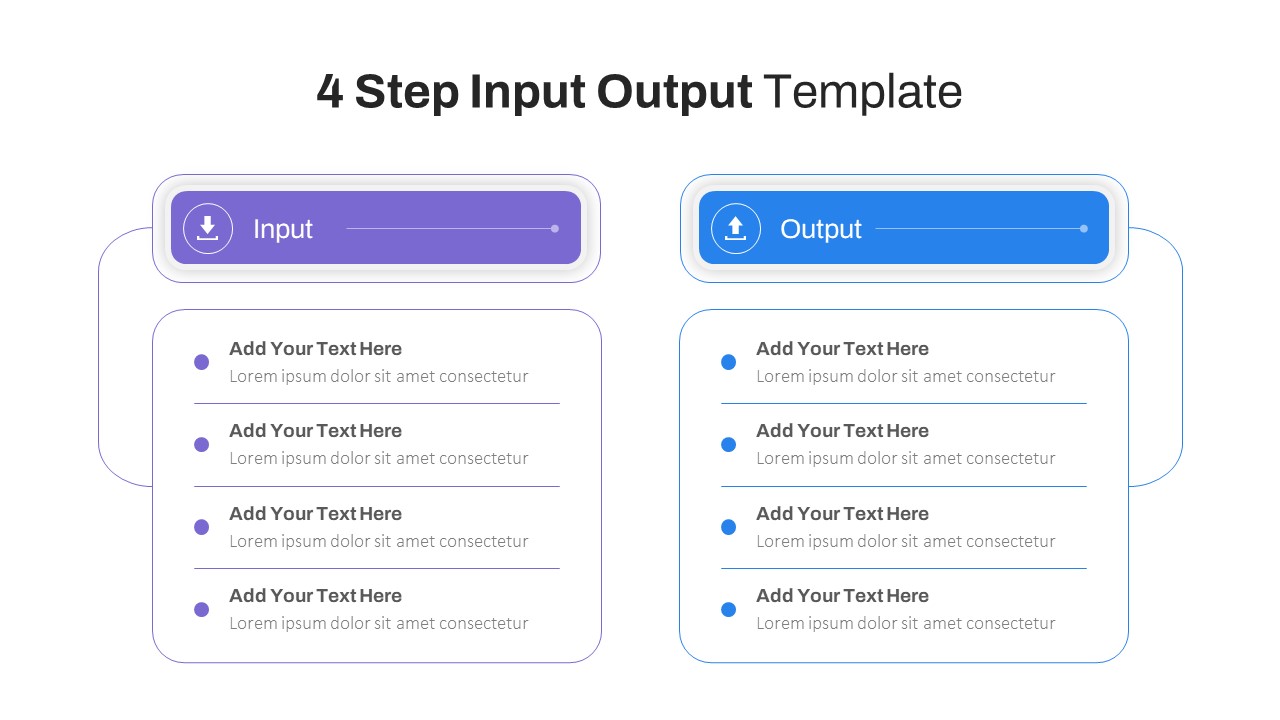
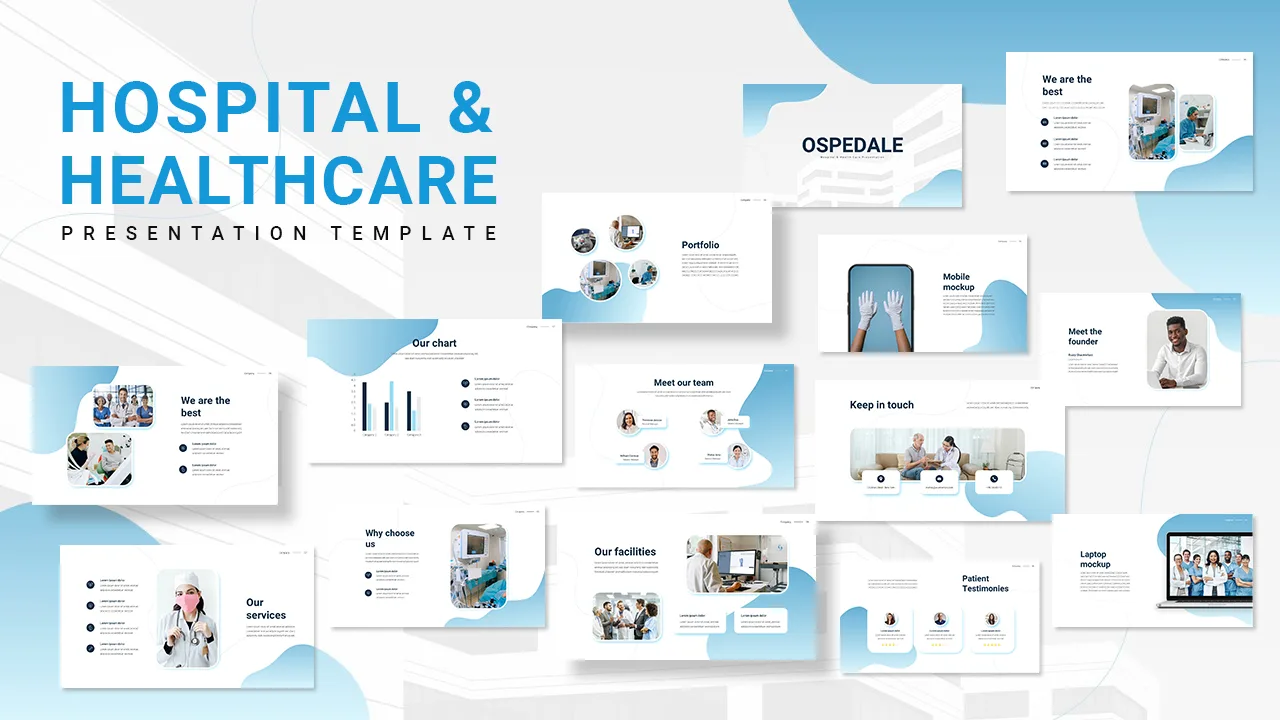
You May Also Like These Presentation Templates

- Free

- Free

- Free
- Free
- Free
- Free
- Free
- Free