Quarterly Sales Chart for PowerPoint Presentation
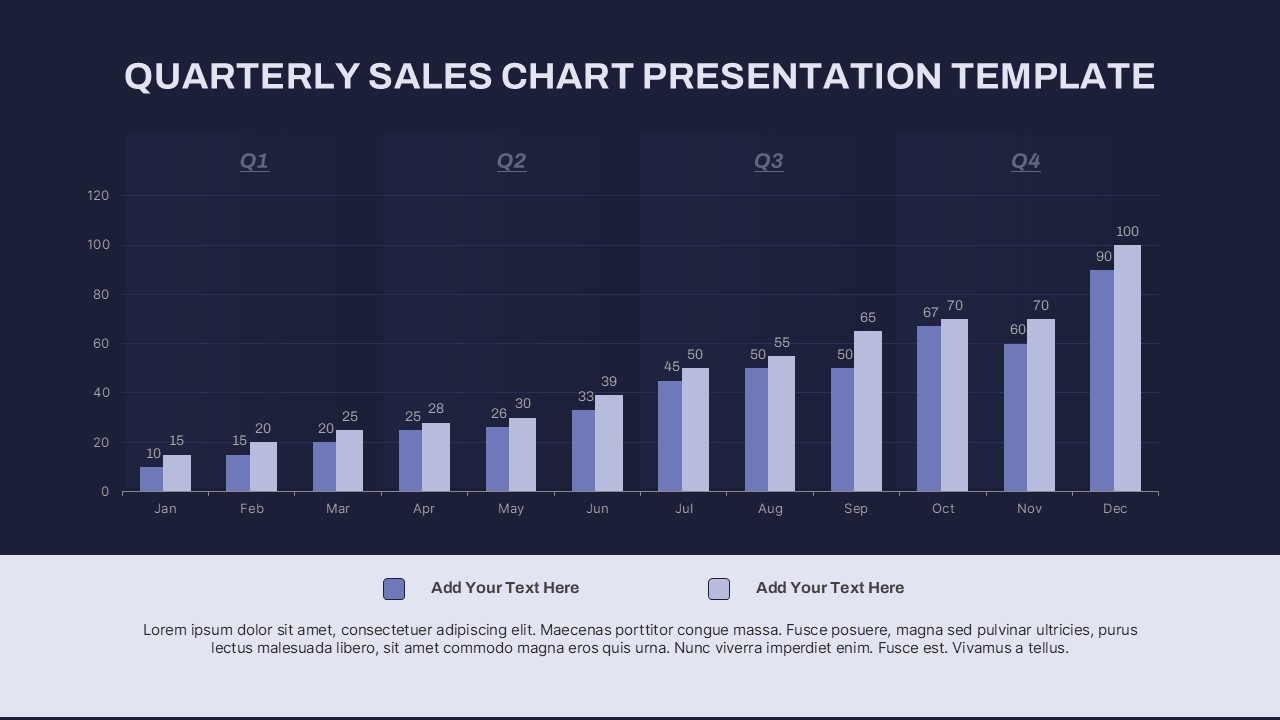
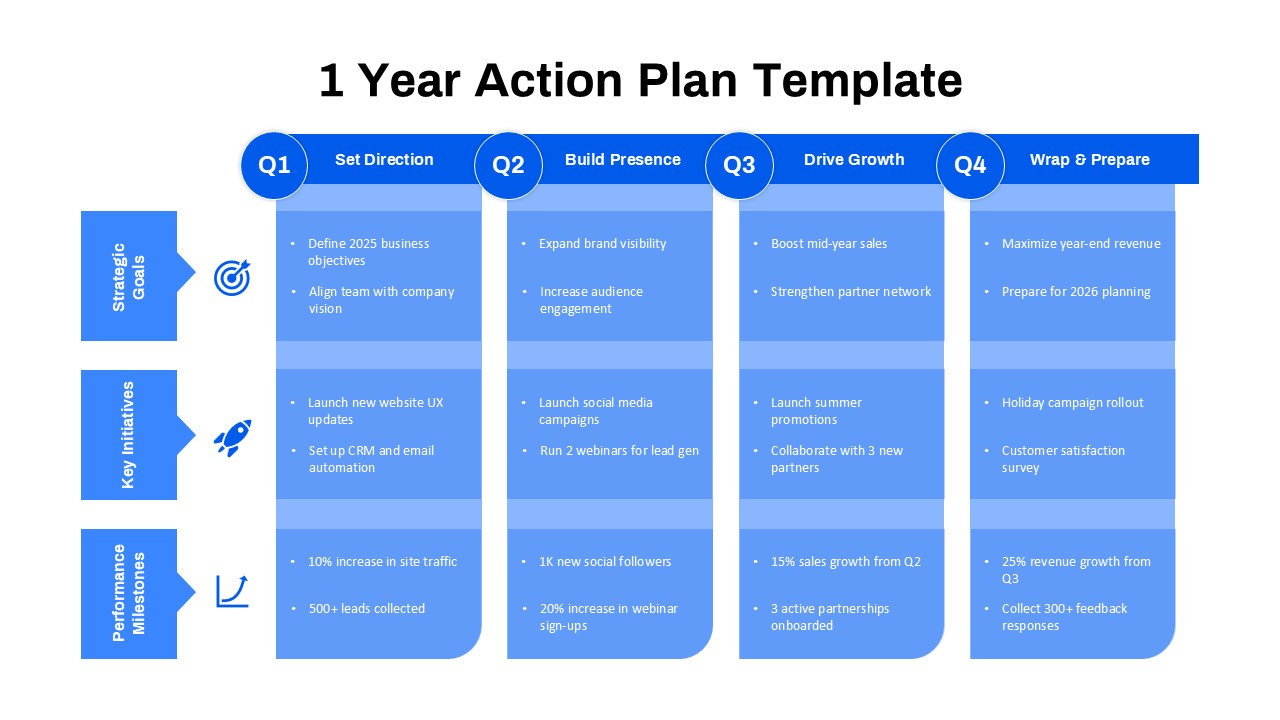
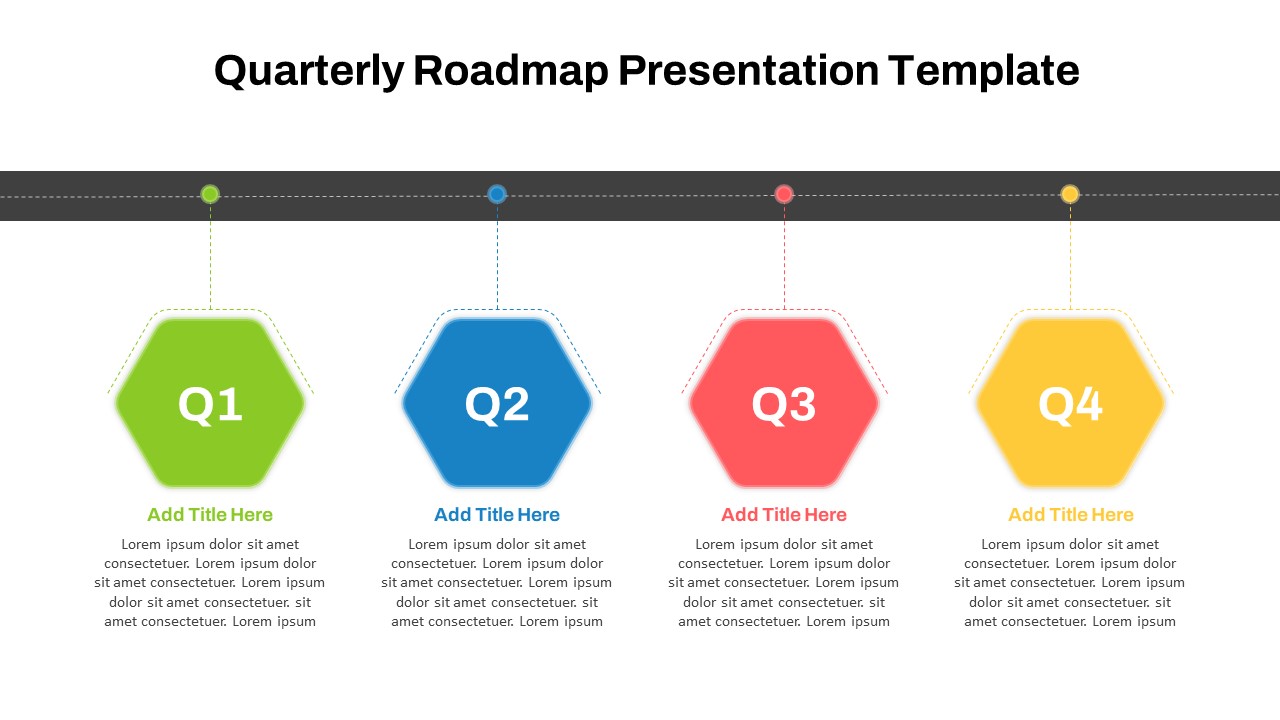
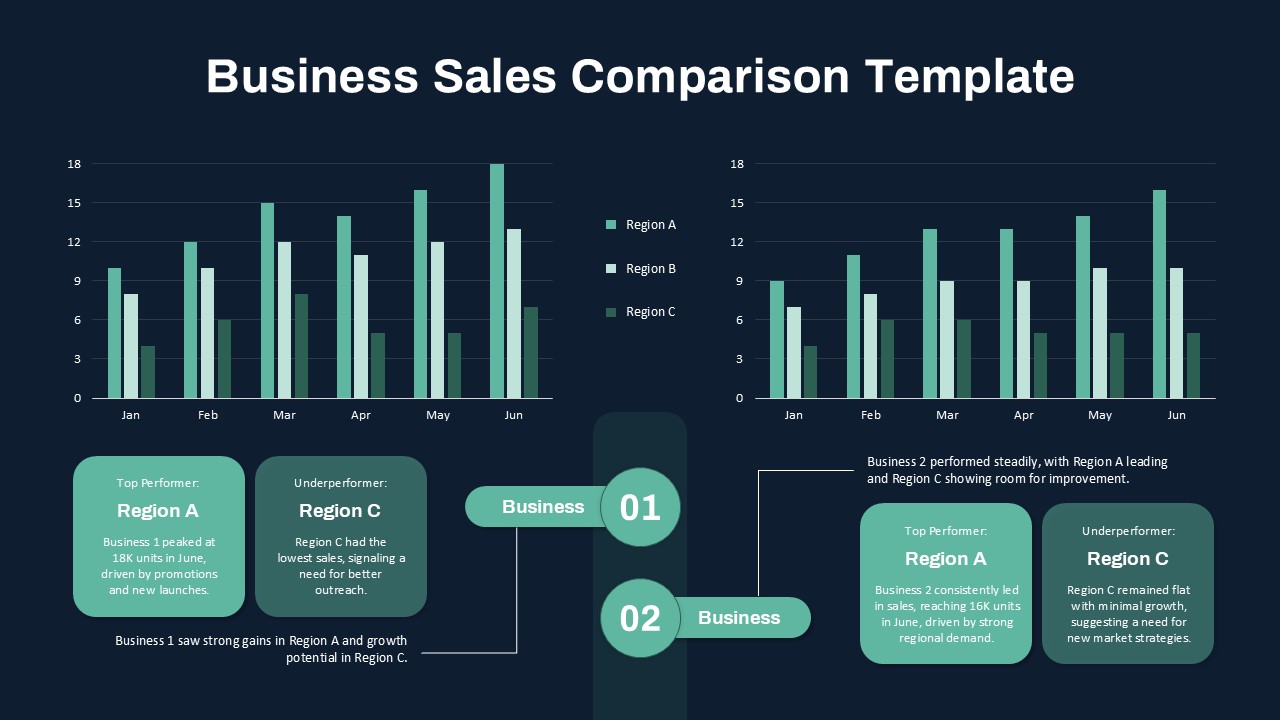
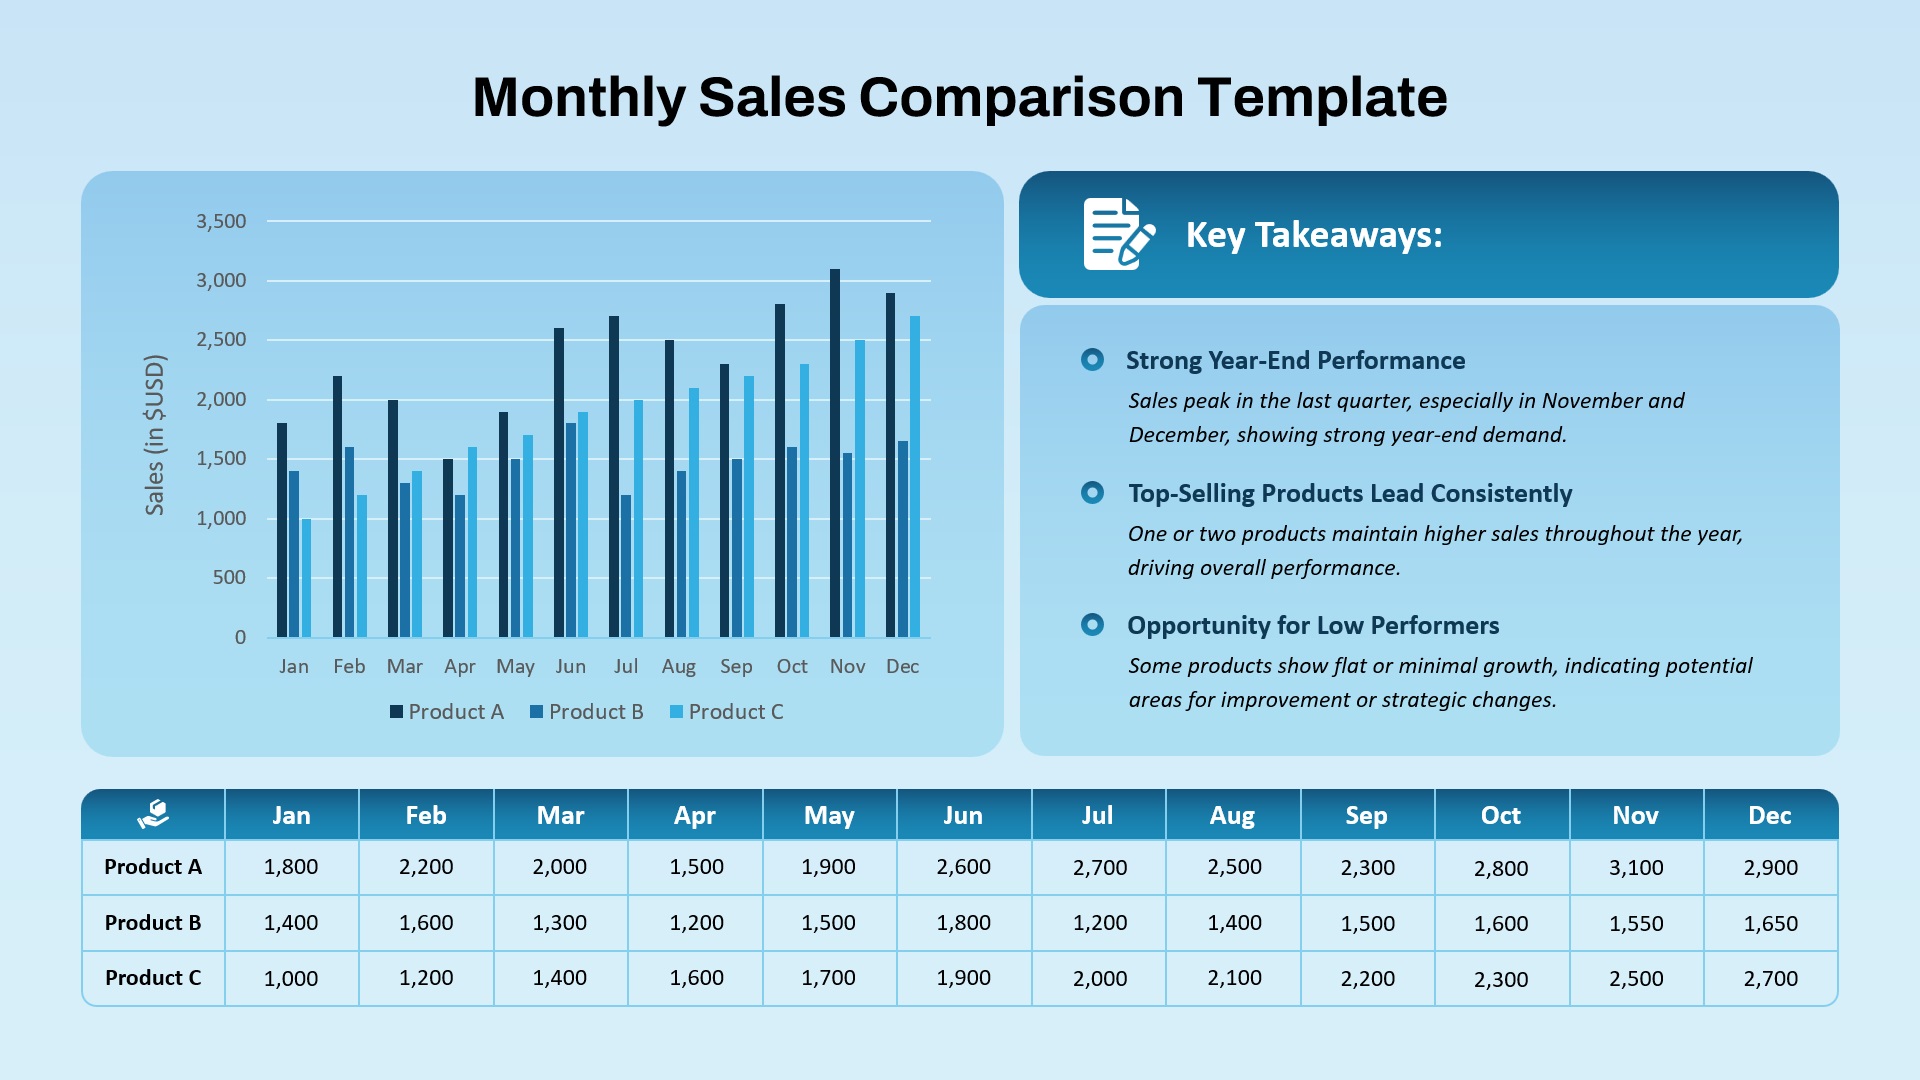
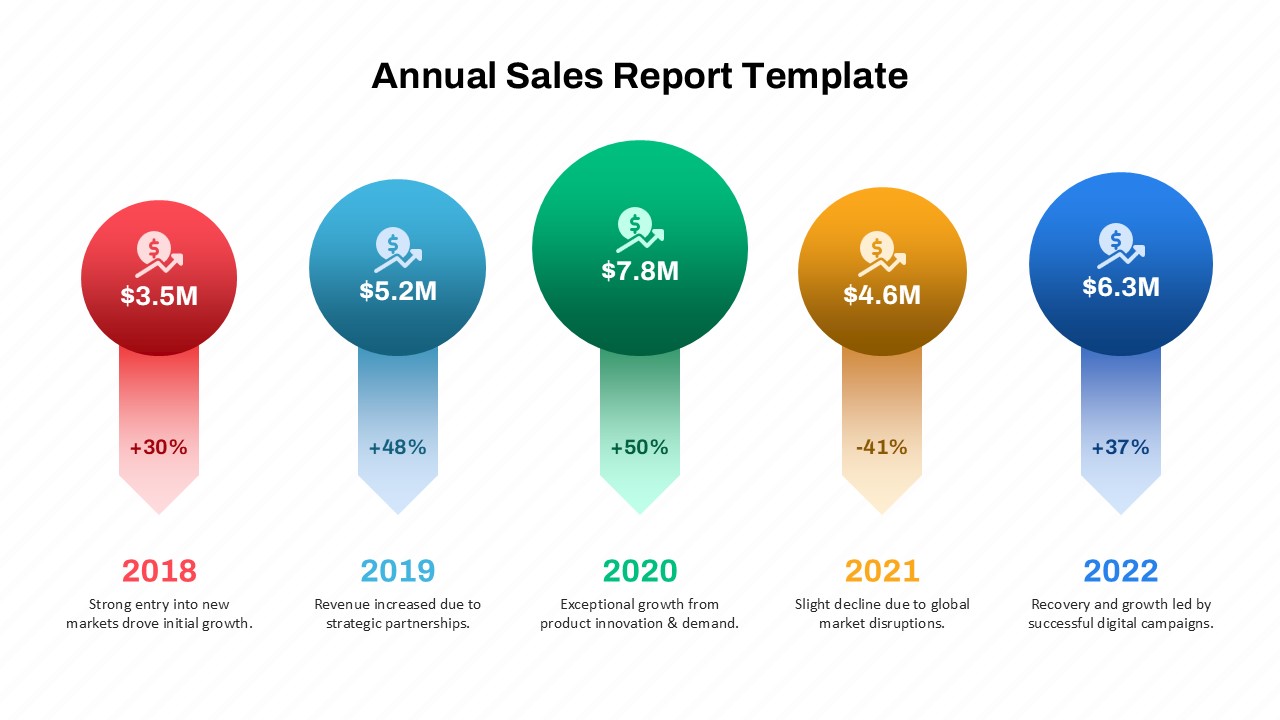
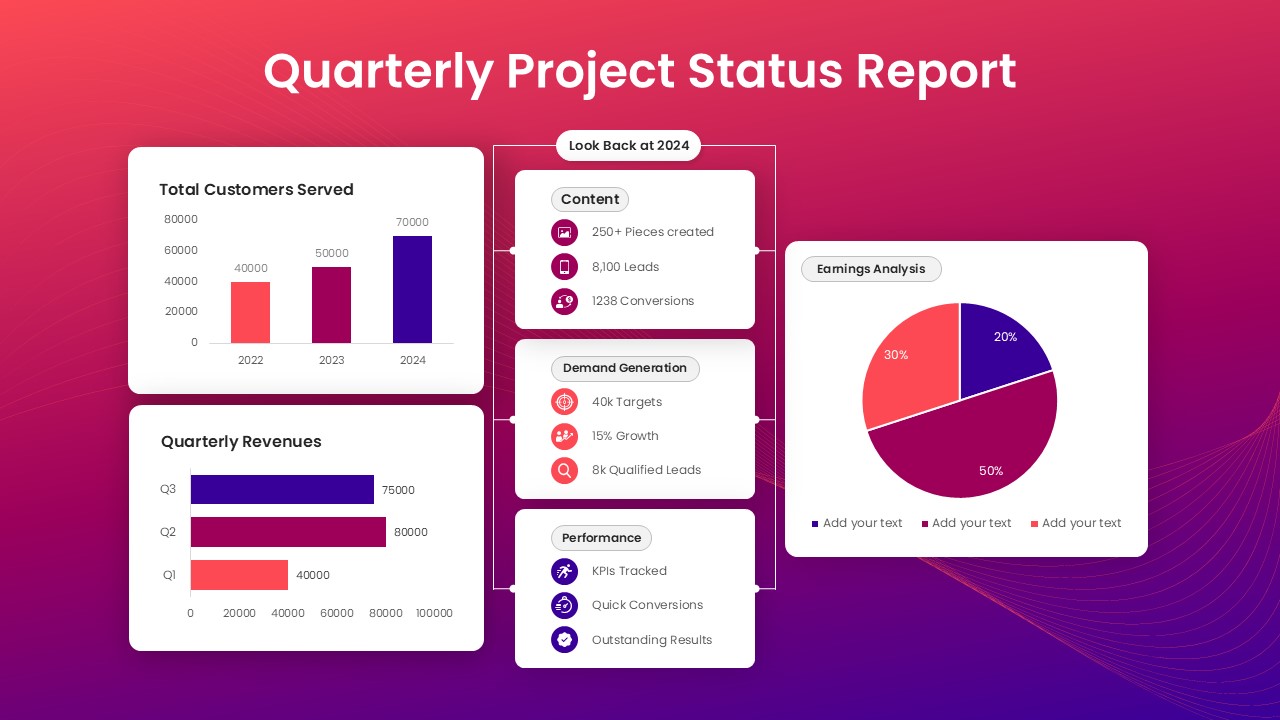
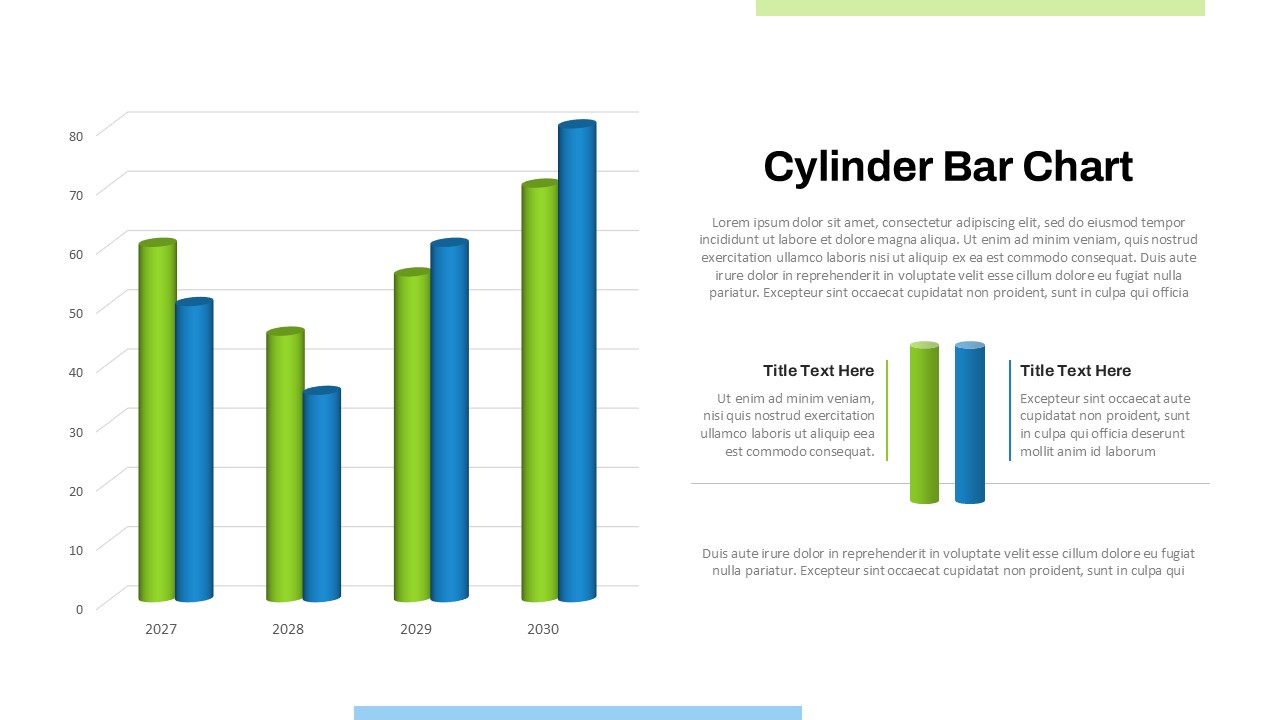
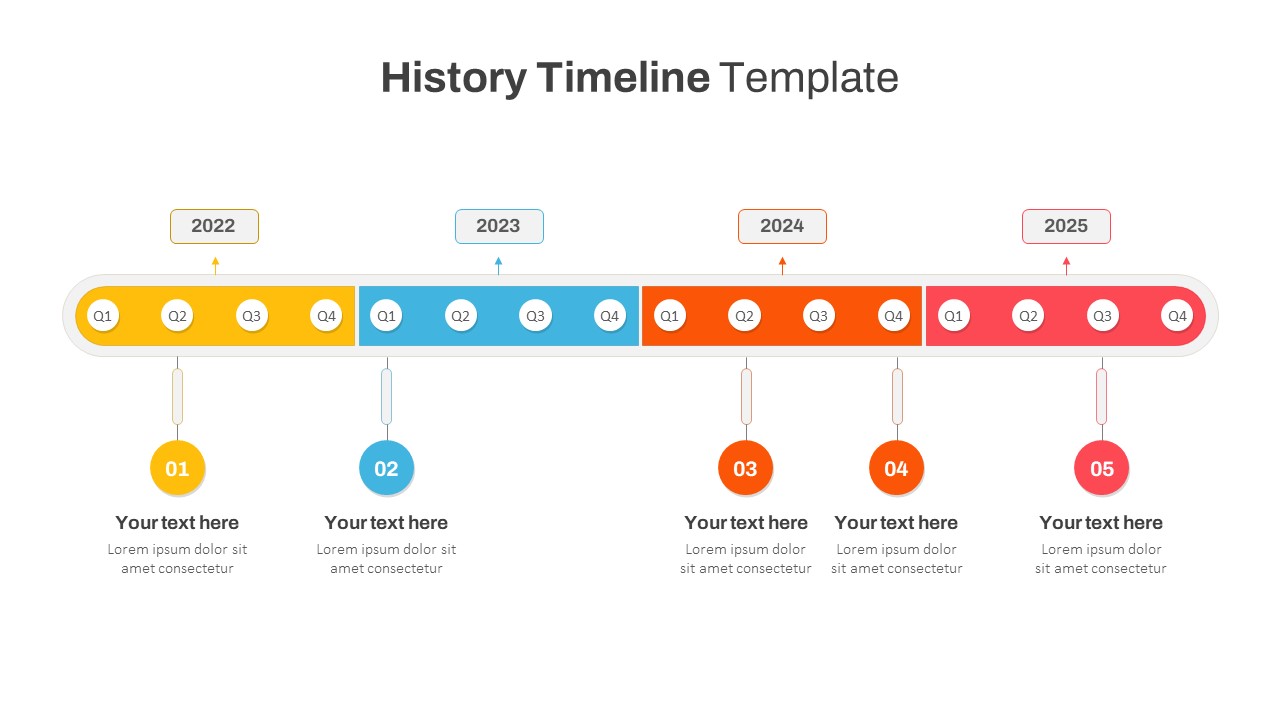
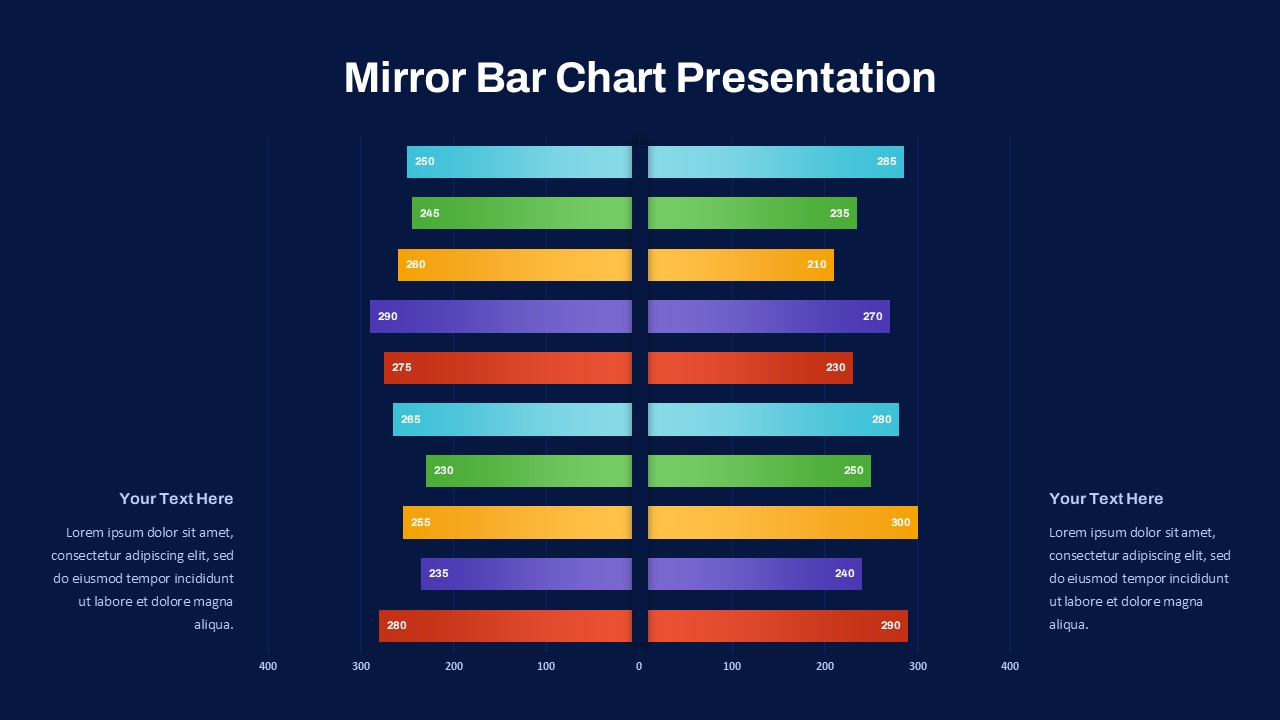
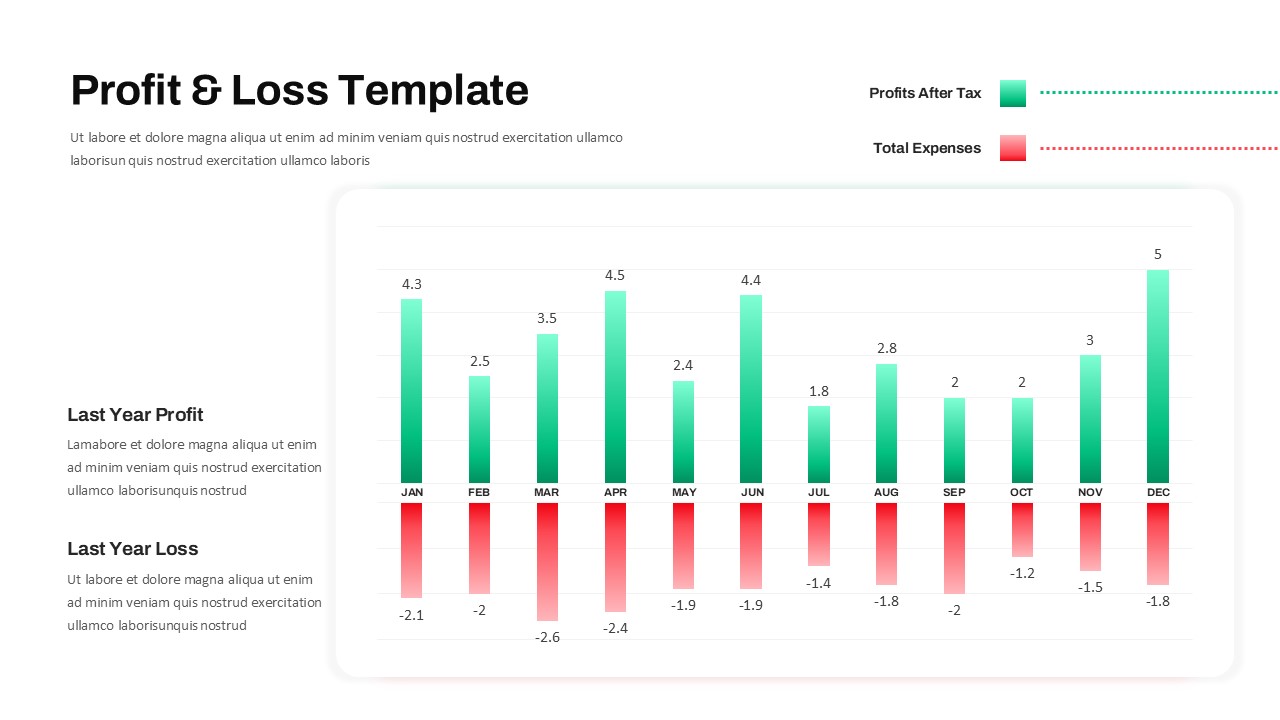
The Quarterly Sales Chart PowerPoint Template is designed for professionals who need to present sales data over the course of a year. This clean and modern template focuses on visually representing key sales trends, making it perfect for quarterly business reviews or financial presentations. The bar chart is divided by quarter, from Q1 to Q4, with monthly breakdowns for each quarter. This easy-to-understand layout helps emphasize the growth and patterns of sales over time, allowing your audience to quickly grasp key insights.
Whether you are presenting to stakeholders, clients, or team members, this chart ppt template provides a professional and polished way to showcase performance. You can effortlessly input your data into the chart and customize the text sections to fit your specific message. The minimalist design ensures that the sales data stands out, while the dark background offers a sleek contrast to the light bar chart, making the information clear and impactful.
This versatile template can be adapted for various industries and business sectors, from retail and e-commerce to service-based companies. If you are looking for a compelling way to showcase your company’s performance across quarters, this template is an ideal tool to visually communicate success and growth.
See more

Aspect Ratio
16:9Item ID
SKT03524
Features of this template
Other User Cases of the Template
Business performance review, quarterly performance report, sales analysis presentation, marketing strategy report, financial presentation, business growth presentation, sales forecast presentation, quarterly results analysis, executive sales report, team performance review
FAQs
You May Also Like These Presentation Templates


- Free
- Free

- Free

- Free
- Free
- Free

- Free
- Free
- Free
- Free
- Free
- Free