Half Pie Chart PowerPoint and Google Slides

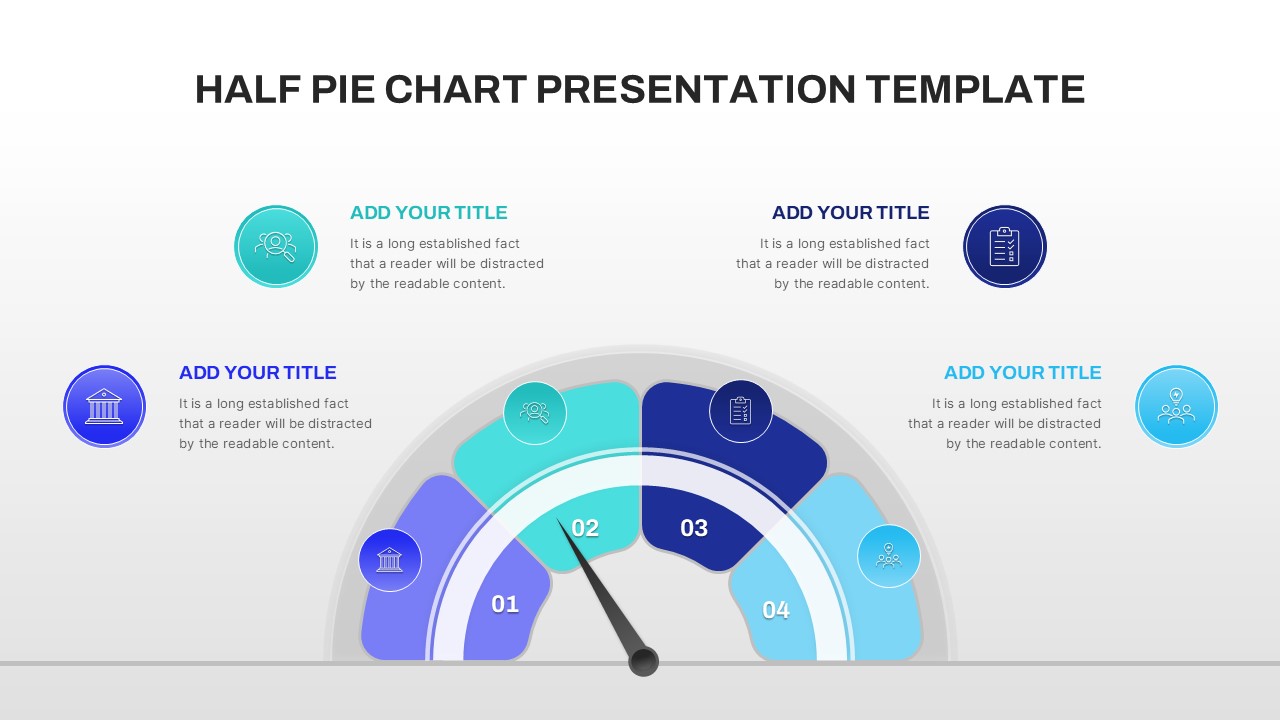
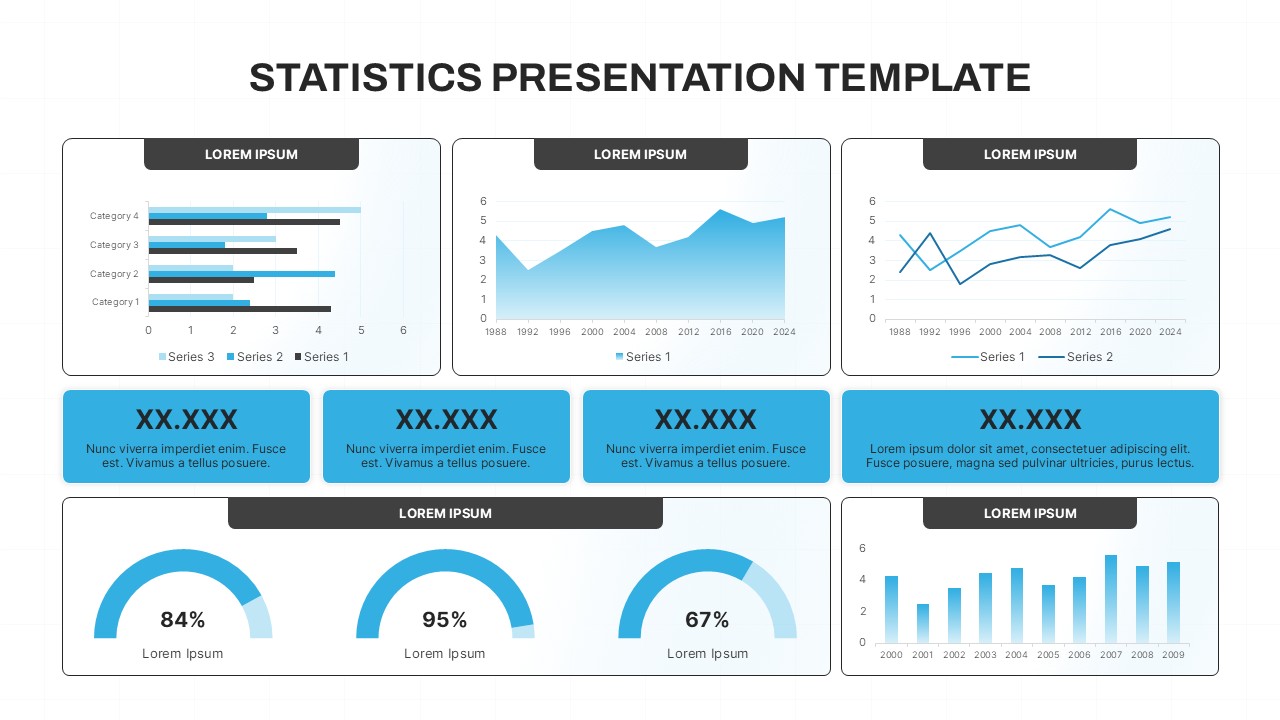
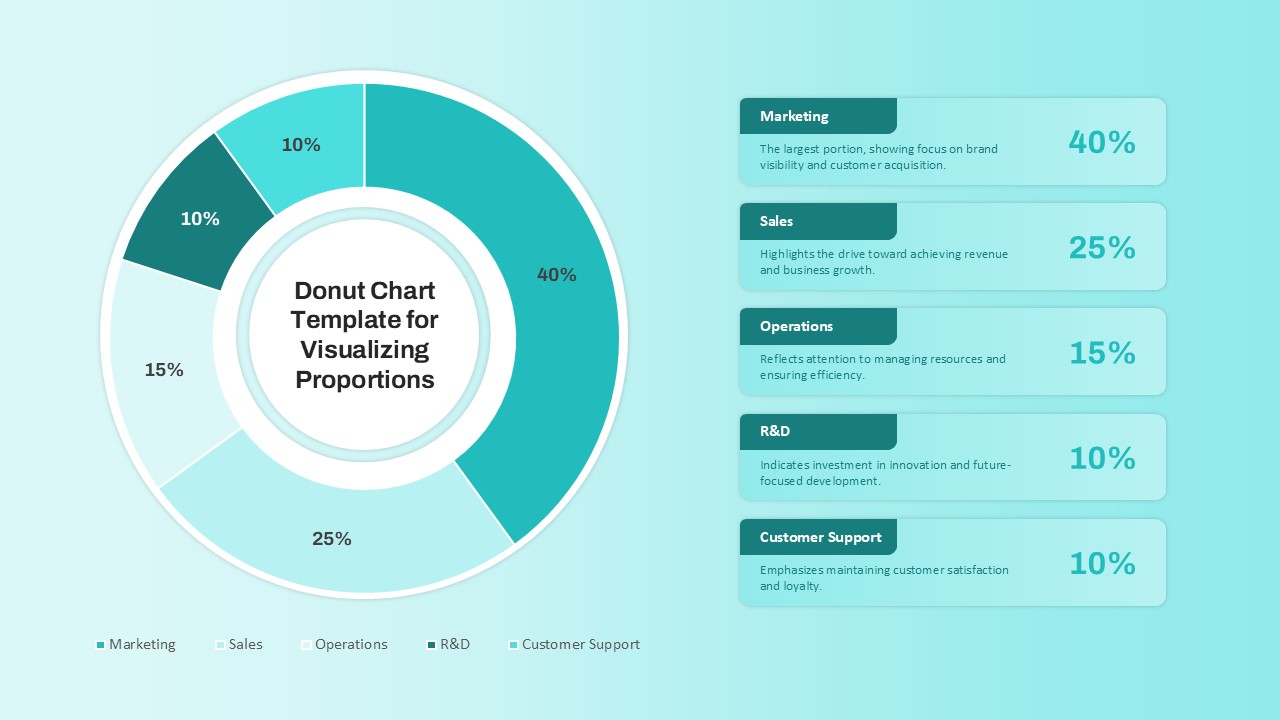
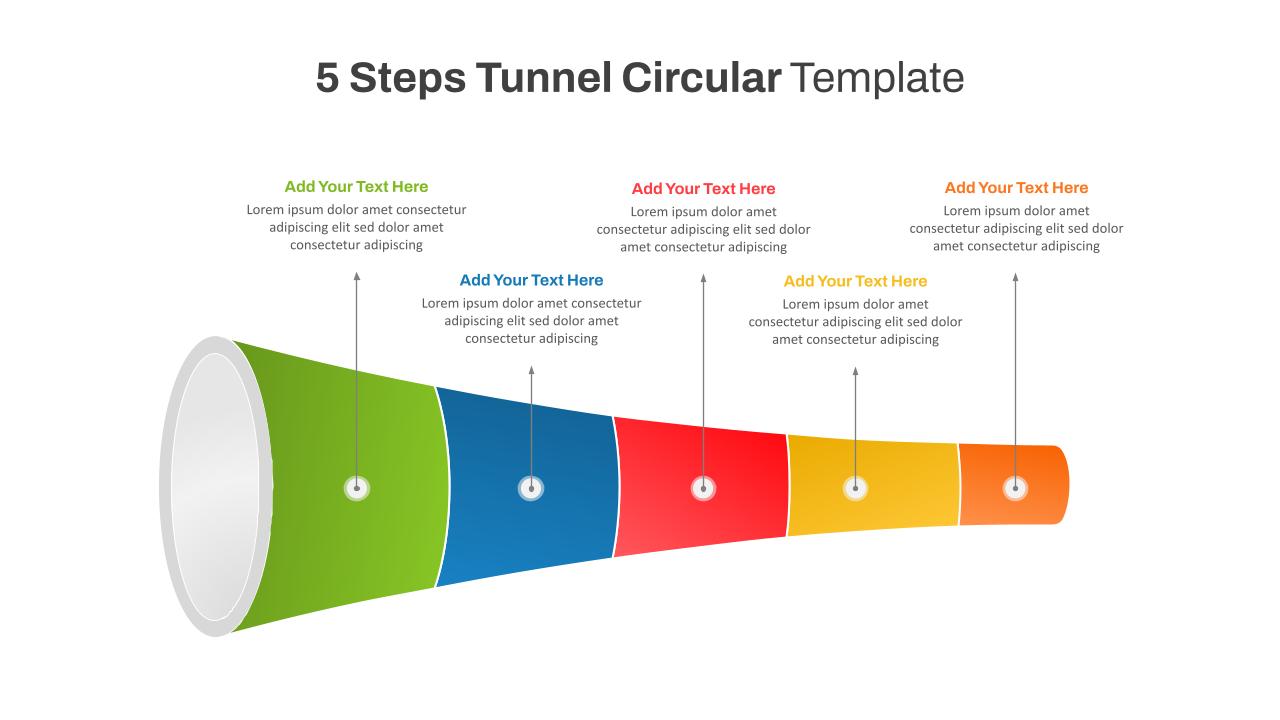
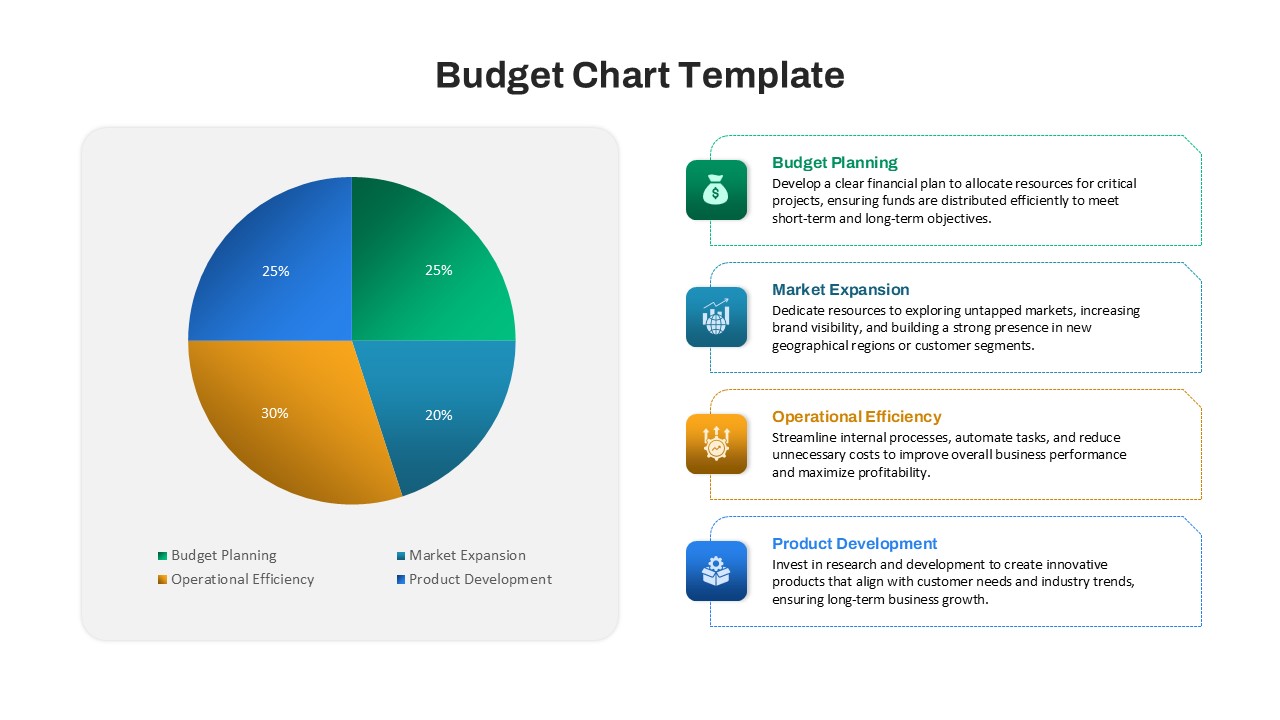
The half pie chart powerpoint template is a dynamic and modern slide design ideal for presenting data comparisons, performance metrics, or proportional distributions in a visually digestible format. This template features a clean, semi-circular pie chart divided into three distinct segments—each labeled with a percentage (30%, 50%, 40%) and matched with corresponding icons and text areas for contextual explanations.
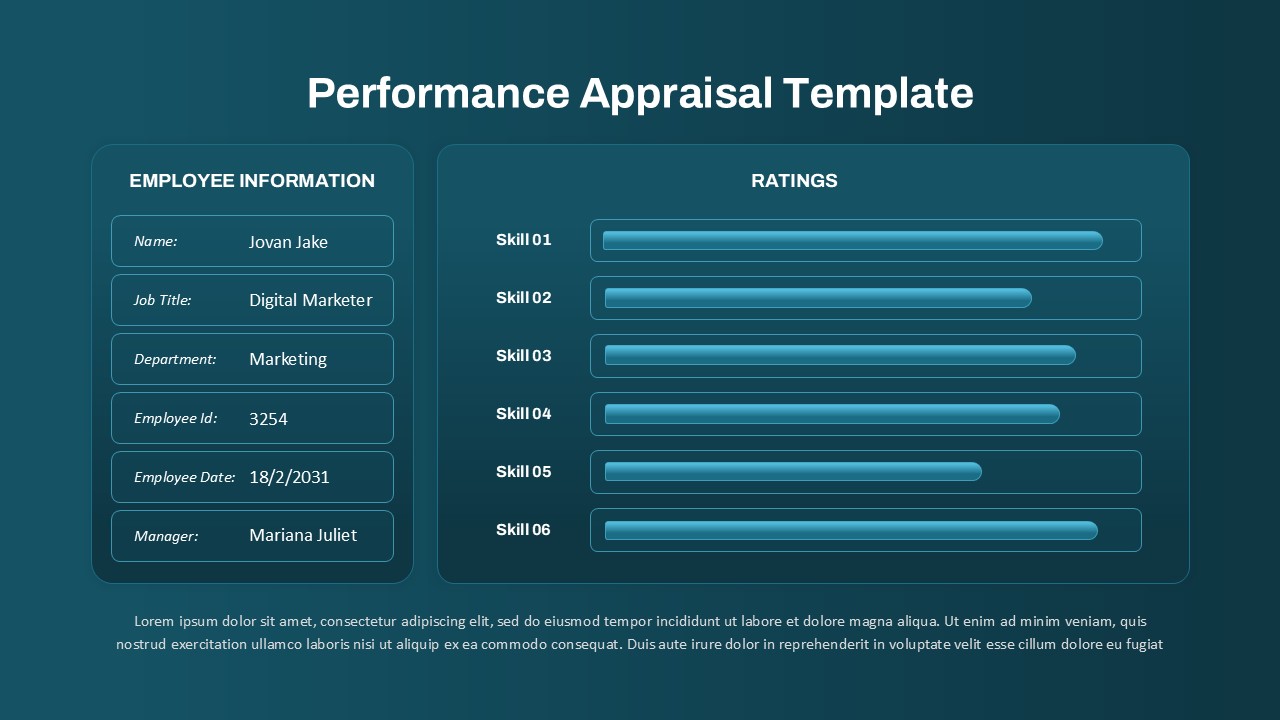
This pie chart slides is designed to simplify complex data while keeping your presentation sleek and professional. Its semi-circular layout on the left naturally draws attention to key statistics, while the right-hand section provides ample space for elaboration, contextual insights, or related commentary. Each section is color-coded and marked with clean icons to aid in visual hierarchy and audience engagement.
The pie diagram in ppt is particularly effective when you need to emphasize parts of a whole without overwhelming the viewer with too many segments. It’s perfect for marketing performance breakdowns, business strategy analysis, project status updates, and stakeholder reporting. Whether you’re pitching ideas to clients, delivering internal reviews, or showcasing survey results, this template helps communicate information clearly and memorably.
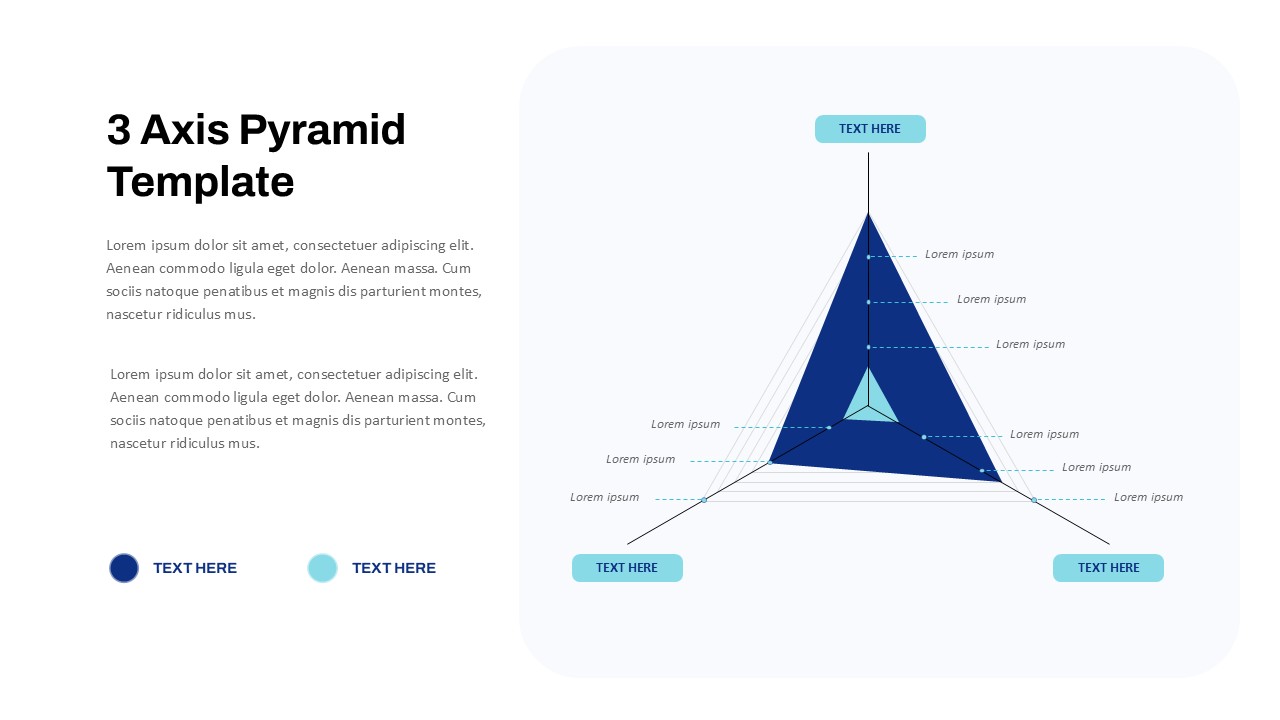
Compatible with both PowerPoint and Google Slides, the template is fully editable, allowing you to update values, change colors, or replace icons based on your branding or subject matter needs.
See more

Aspect Ratio
16:9Item ID
SKT03520
Features of this template
Other User Cases of the Template:
marketing performance reviews, project status updates, business metric comparisons, sales presentations, annual reports, strategy planning, stakeholder briefings, data storytelling, team performance analysis, budget distribution breakdowns
FAQs
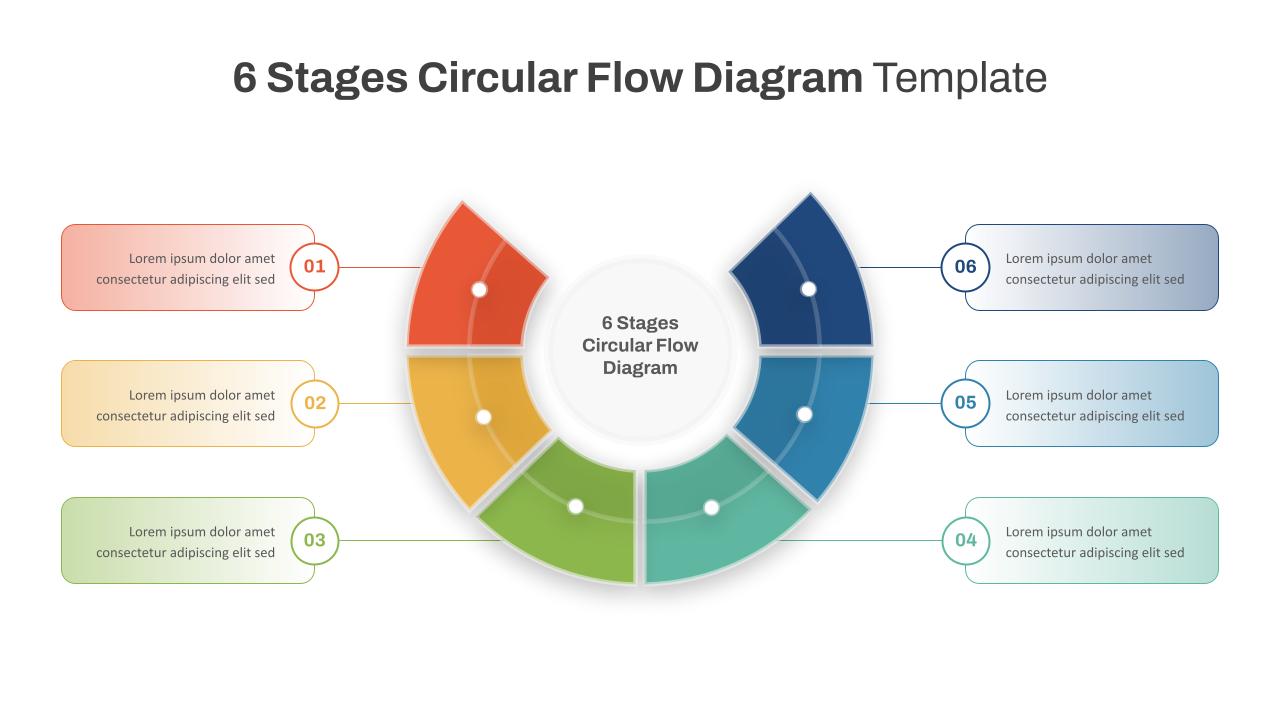
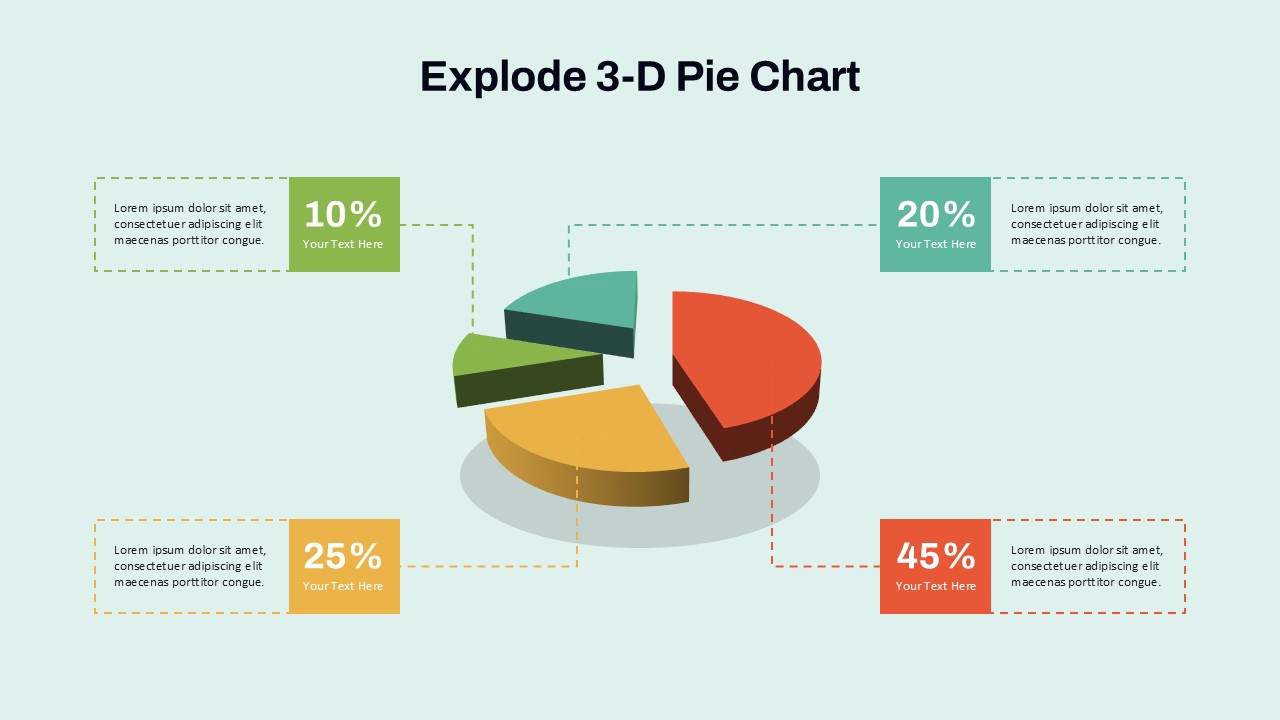
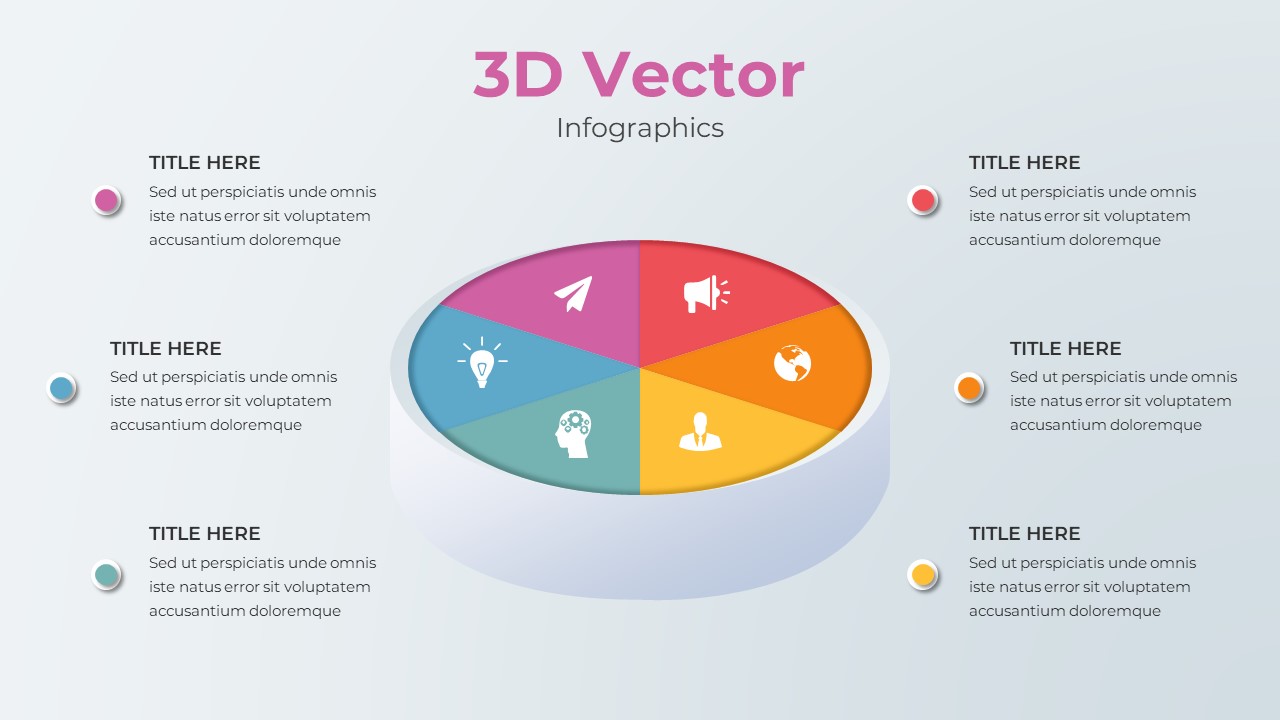
You May Also Like These Presentation Templates


- Free
- Free

- Free

- Free
- Free
- Free

- Free

- Free
- Free
- Free
- Free