Gap Analysis Diagram PowerPoint Template
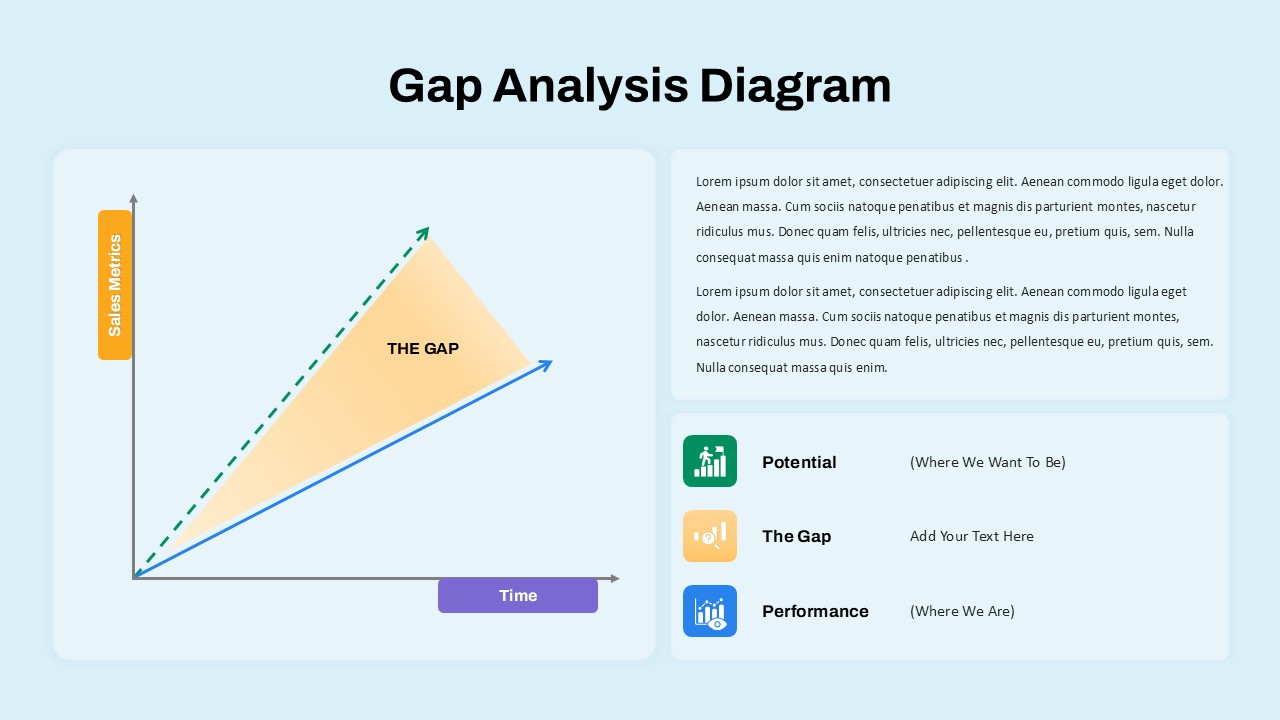
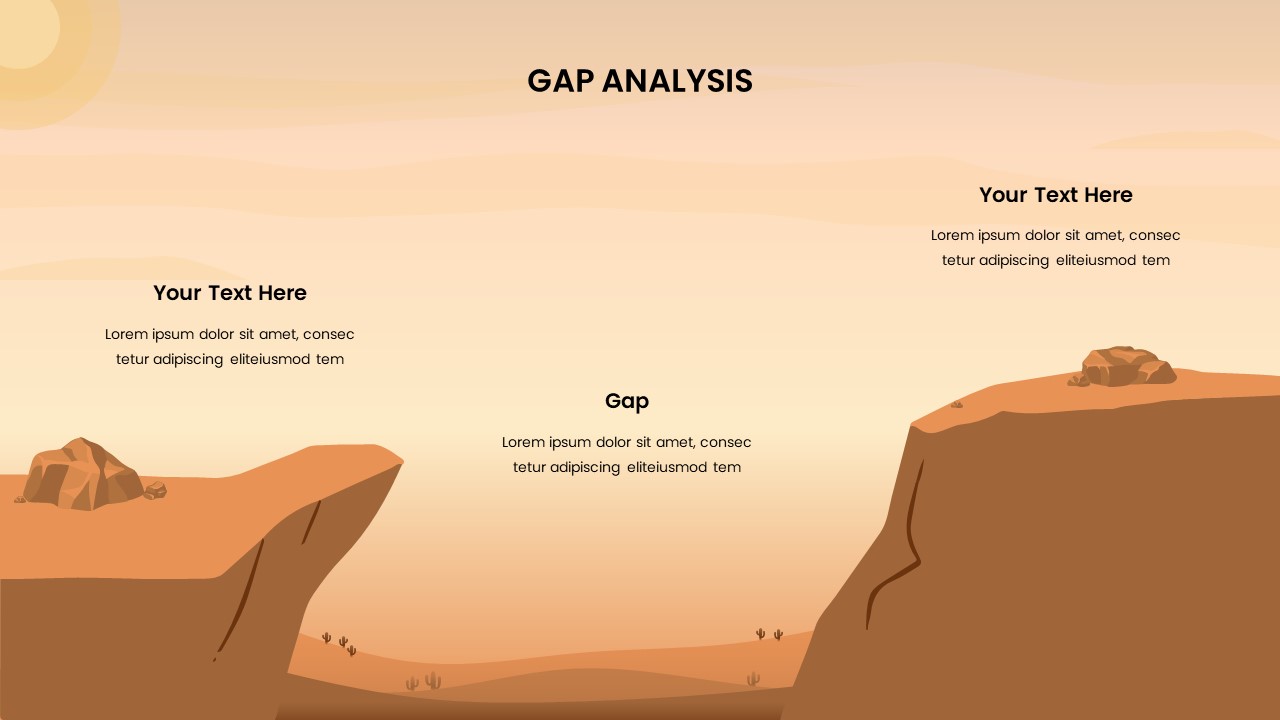
The Gap Analysis PowerPoint Template is a strategic visual tool designed to help businesses and teams identify and analyze the difference between current performance and desired potential outcomes. This clean, professional gap analysis slide features a simple yet effective graph that maps Sales Metrics against Time, clearly highlighting the ‘gap’—the area representing the difference between where an organization currently stands and where it aims to be. The gap analysis example diagram uses distinct lines to illustrate actual performance versus potential growth, providing a clear focal point for strategic discussions.
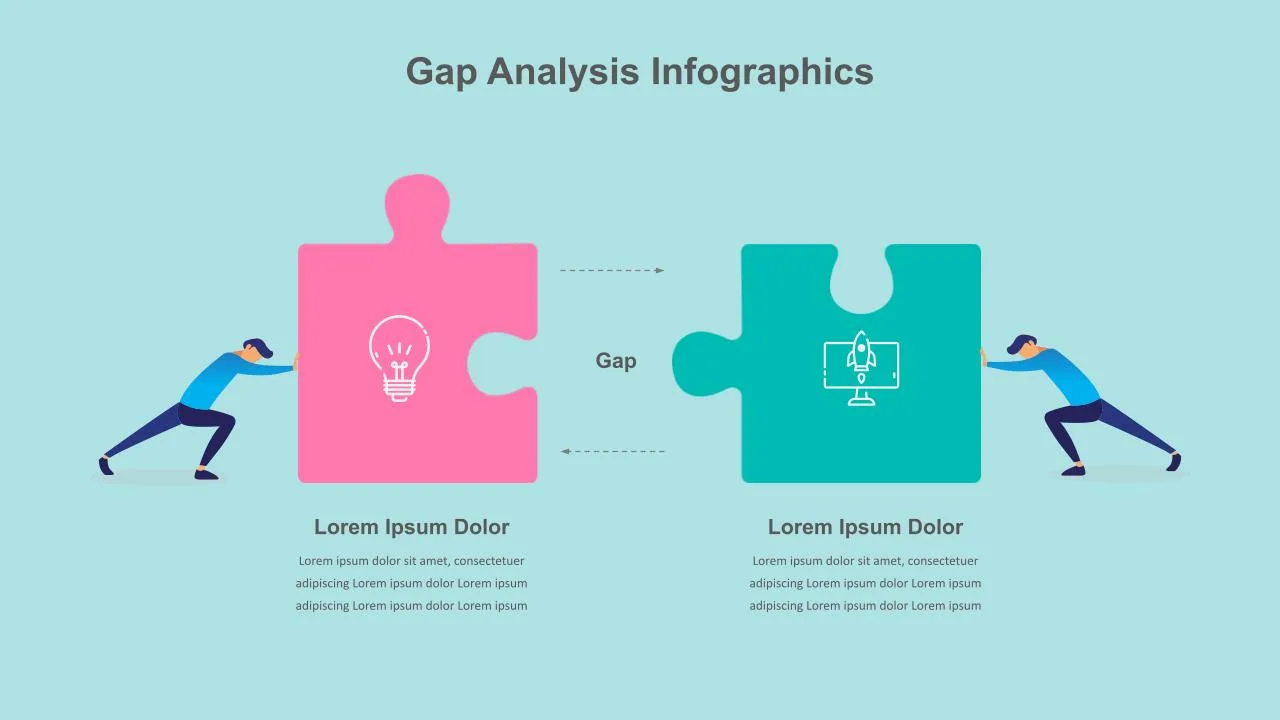
Accompanying the visual is a concise textual area where users can explain key insights or observations about the gap, making it ideal for presentations that require clear communication of performance shortfalls and growth opportunities. The template also includes an easy-to-understand legend, distinguishing between Potential (where the organization wants to be), Performance (current status), and the Gap (areas needing improvement). Its design balances simplicity with clarity, making it suitable for executives, managers, consultants, or teams aiming to perform SWOT analysis, set goals, or plan corrective actions.
The template’s adaptability for both PowerPoint and Google Slides allows users to customize content seamlessly, enhancing collaboration and presentation effectiveness across platforms. Whether used for business strategy sessions, project reviews, or performance evaluations, this gap analysis powerpoint template serves as a critical asset for visualizing and addressing performance gaps.
See more

Aspect Ratio
16:9Item ID
SKT03880
Features of this template
Other User Cases of the Template
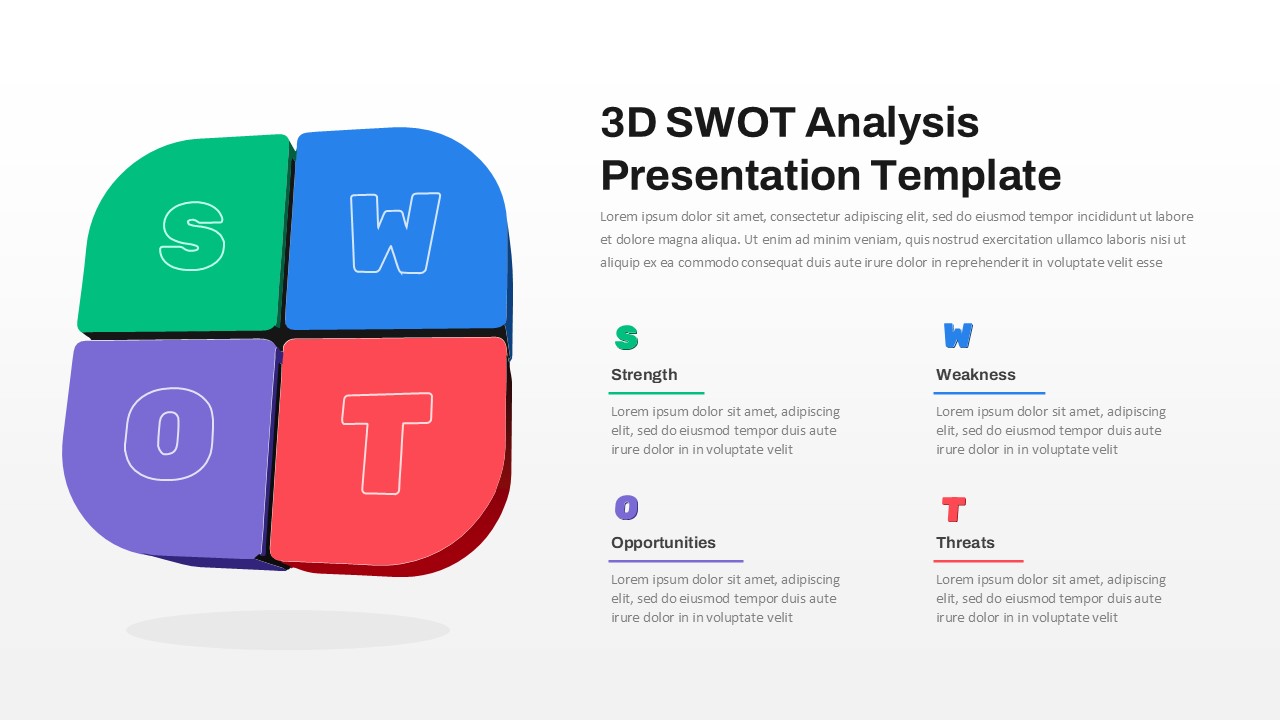
Business Strategy Planning, Performance Evaluation, Project Management, SWOT Analysis, Goal Setting, Process Improvement, Market Analysis, Resource Allocation, Change Management, Risk Assessment
FAQs
You May Also Like These Presentation Templates


- Free
- Free

- Free
- Free
- Free