5 Segments Radial Gauge Chart PowerPoint Template
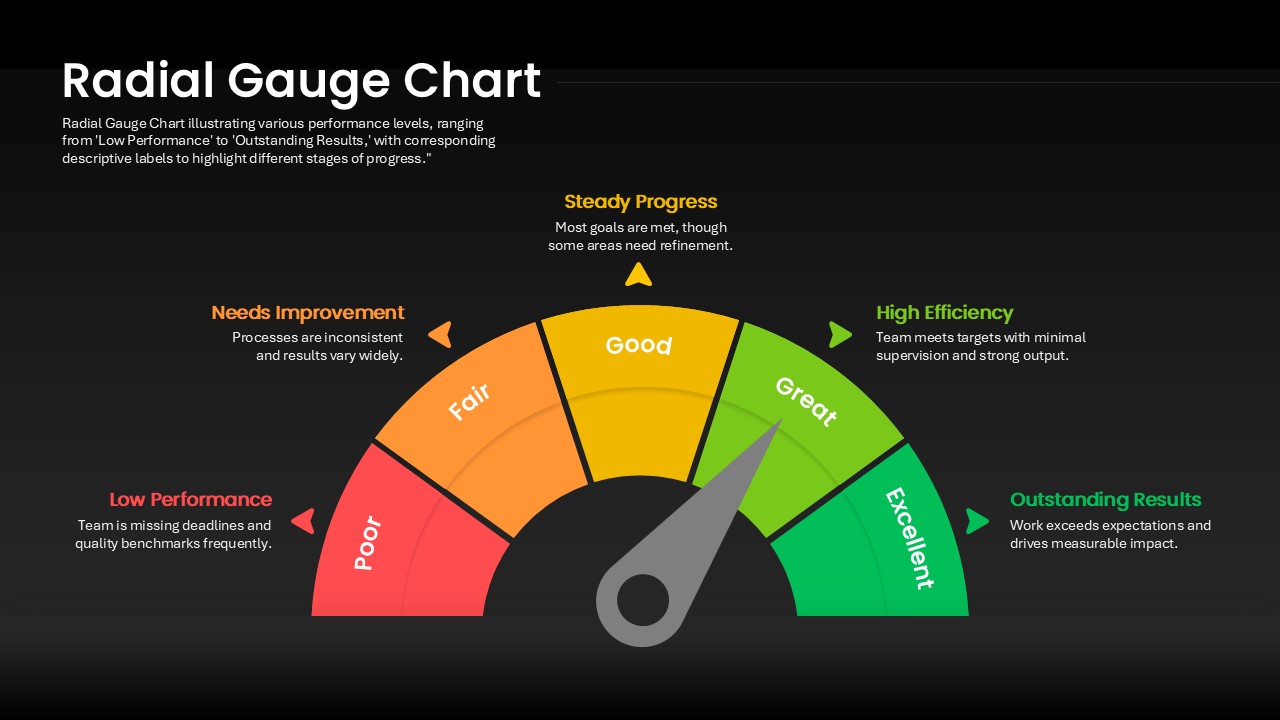
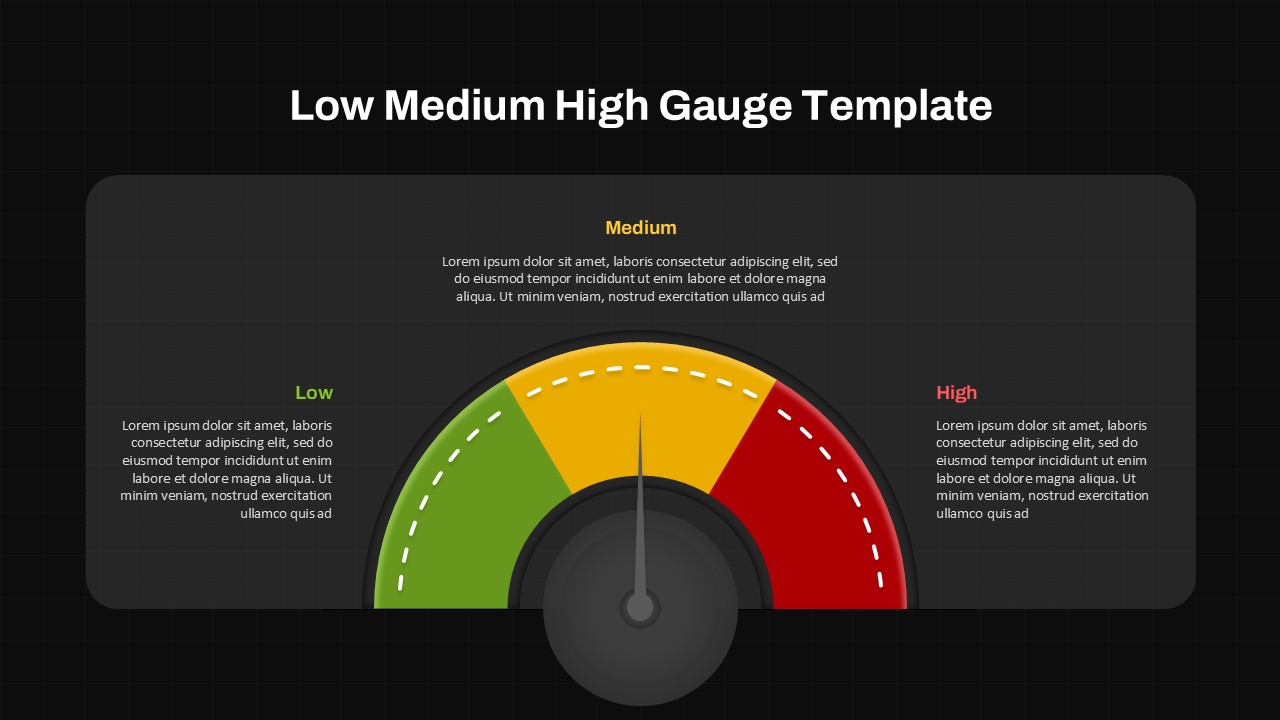
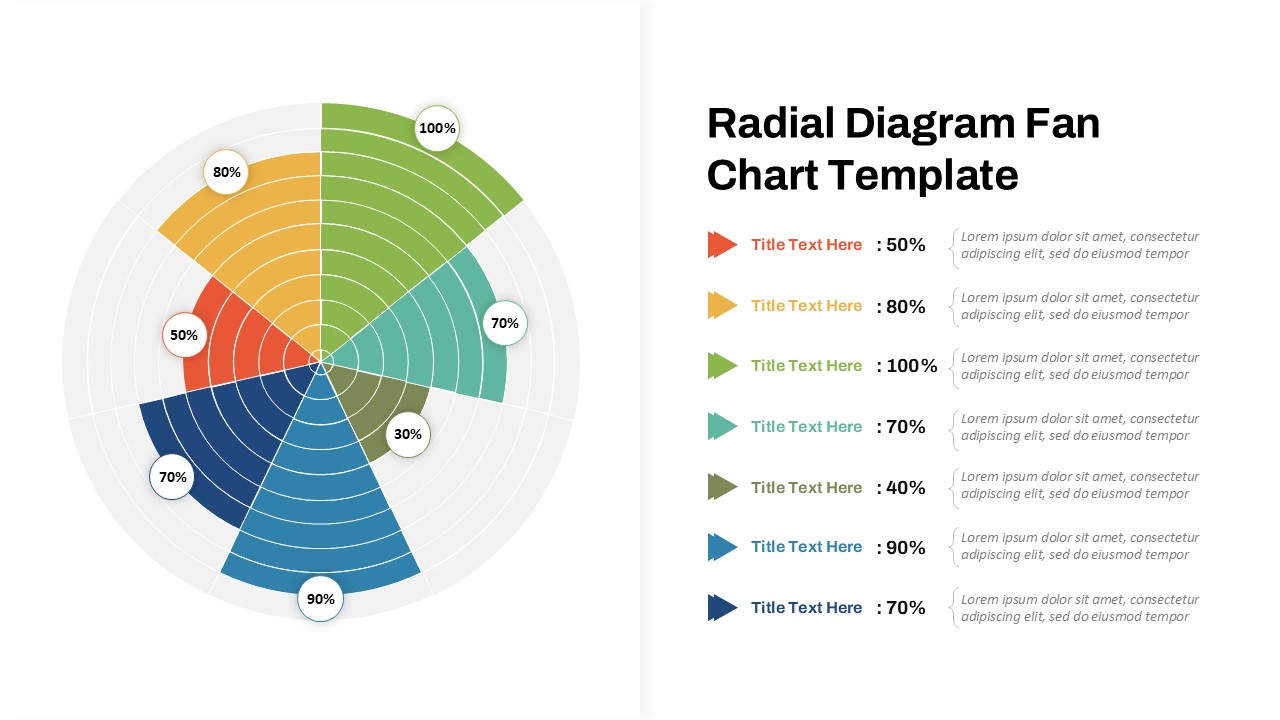
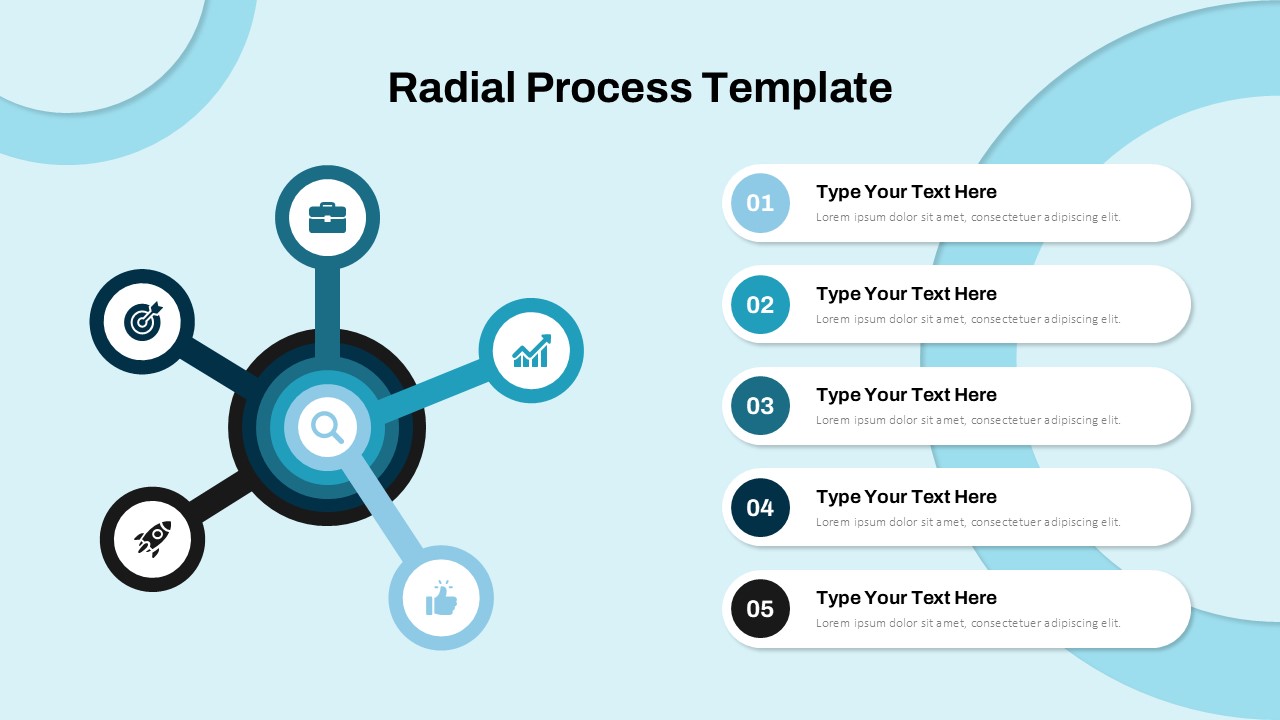
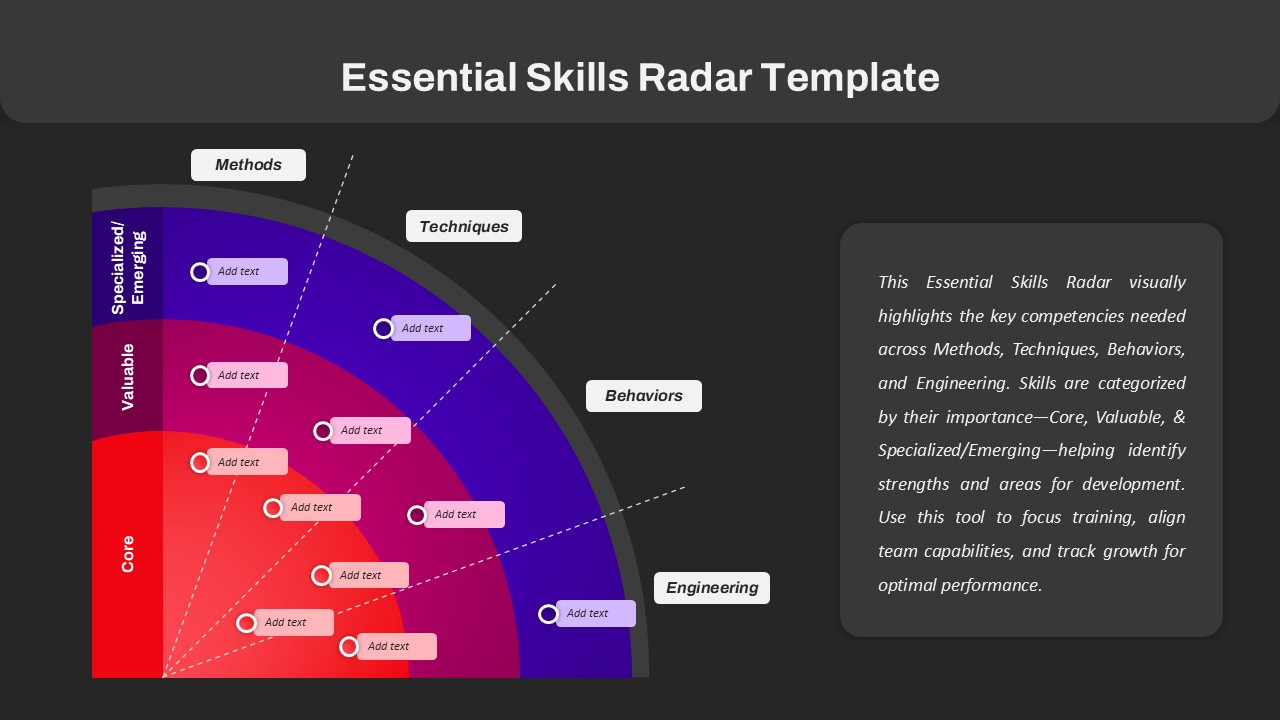
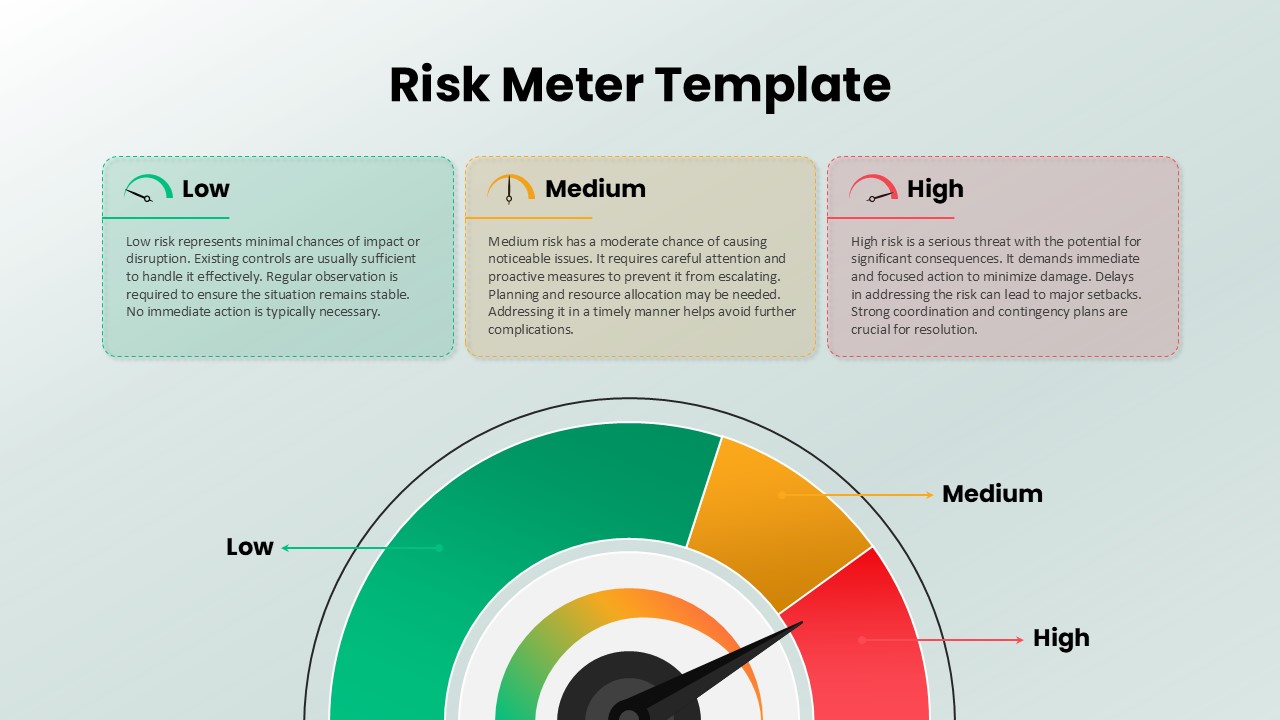
The Radial Gauge Chart PPT Template is a visually engaging tool designed to display performance levels and progress in a clear, circular format. This gauge chart in ppt template is ideal for business presentations, project management, and performance reviews, helping teams and individuals measure and visualize their progress toward goals in a way that is both intuitive and easy to interpret.
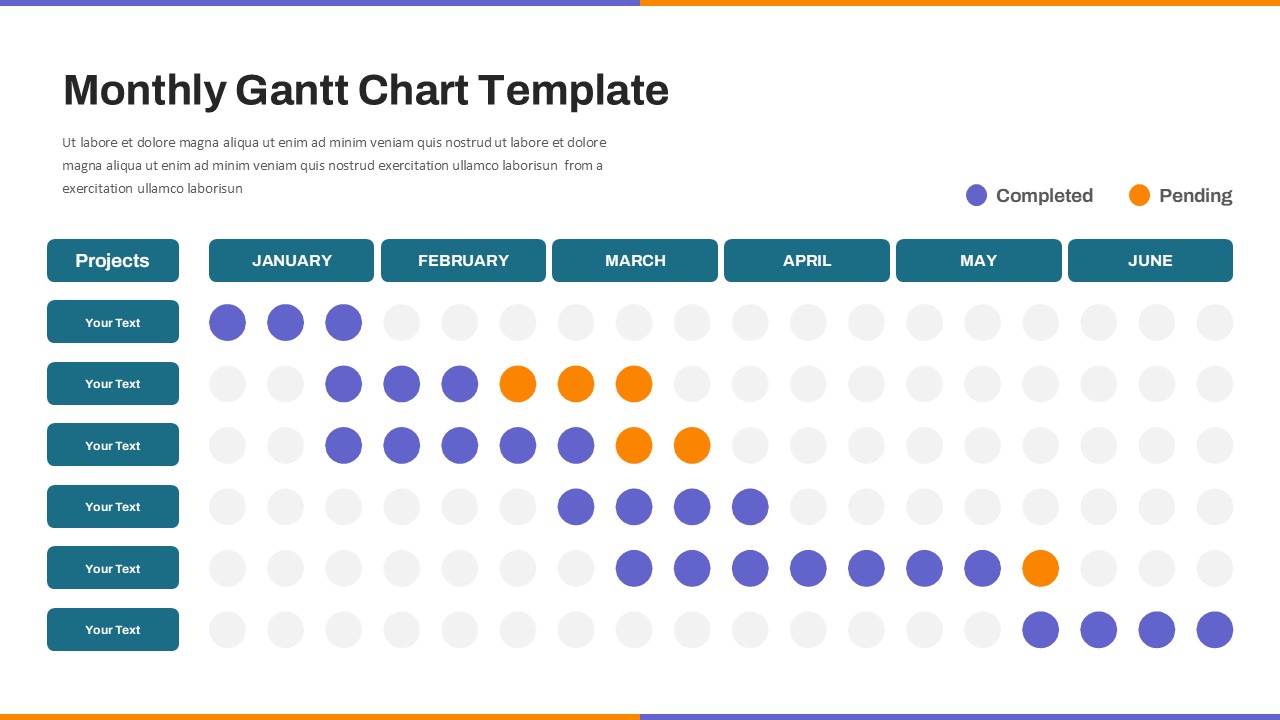
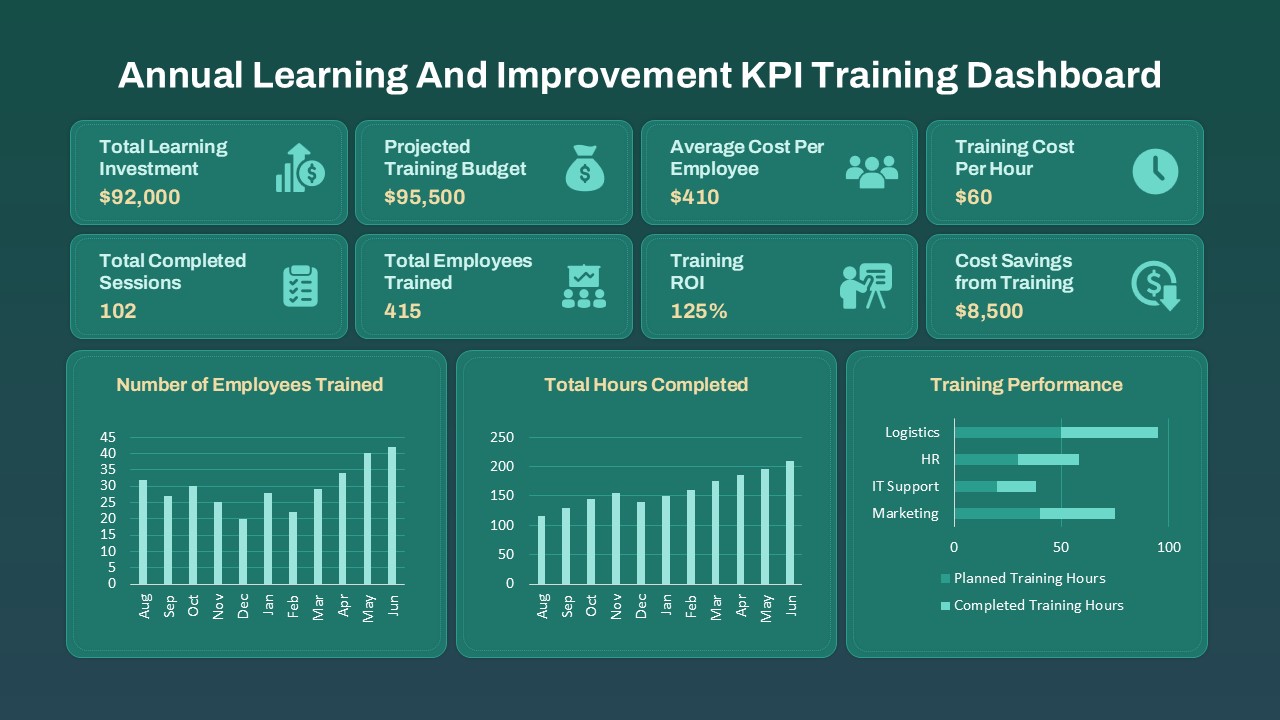
With this template, users can show performance metrics ranging from “Low Performance” to “Outstanding Results,” offering a complete range of progress indicators. The chart is divided into distinct sections: Low Performance, Needs Improvement, Fair, Good, Steady Progress, Great, High Efficiency, Excellent, and Outstanding Results, with each area labeled to provide a clear understanding of the progress level.
The Radial Gauge Chart is perfect for tracking team performance, project milestones, or individual achievements. It allows teams to evaluate their strengths and areas of improvement while motivating continuous growth. Whether you’re reporting on project status, team efficiency, or overall organizational performance, this template offers an easy-to-understand visual that highlights key areas of success and needs for development.
See more

Aspect Ratio
16:9Item ID
SKT04072
Features of this template
Other User Cases of the Template:
Team Performance Tracking, Project Milestone Reporting, Goal Progress Visualization, Organizational Performance Evaluation, Business Performance Metrics, Employee Performance Reviews, Marketing Campaign Results, KPI Tracking, Sales Performance Monitoring, Strategy Implementation Analysis
FAQs
You May Also Like These Presentation Templates


- Free
- Free
- Free
- Free
- Free