Radial Diagram Fan Chart PowerPoint Template
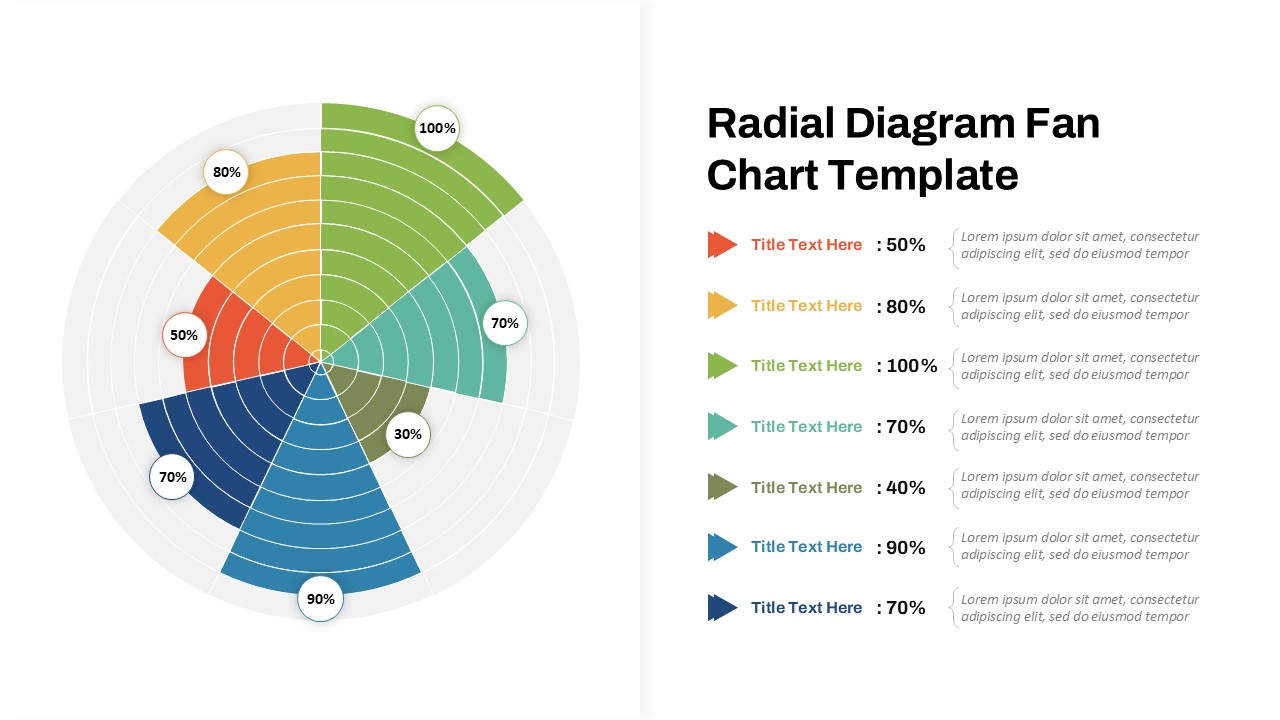
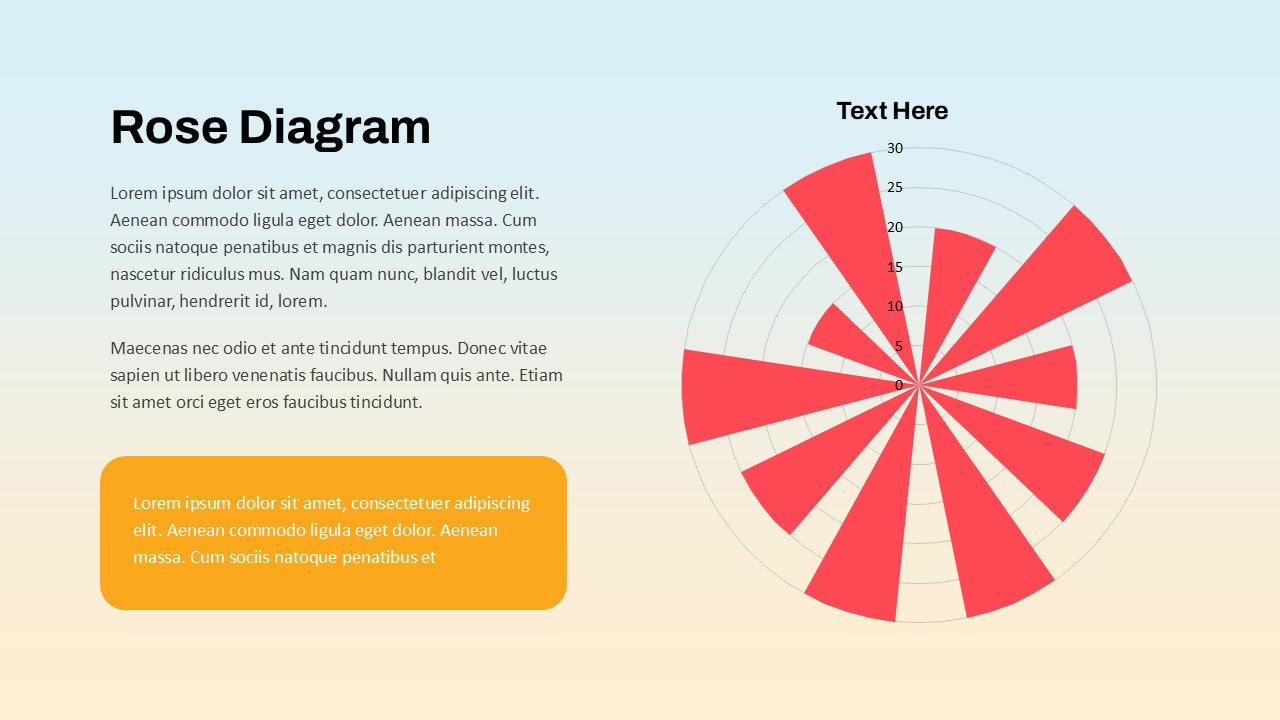
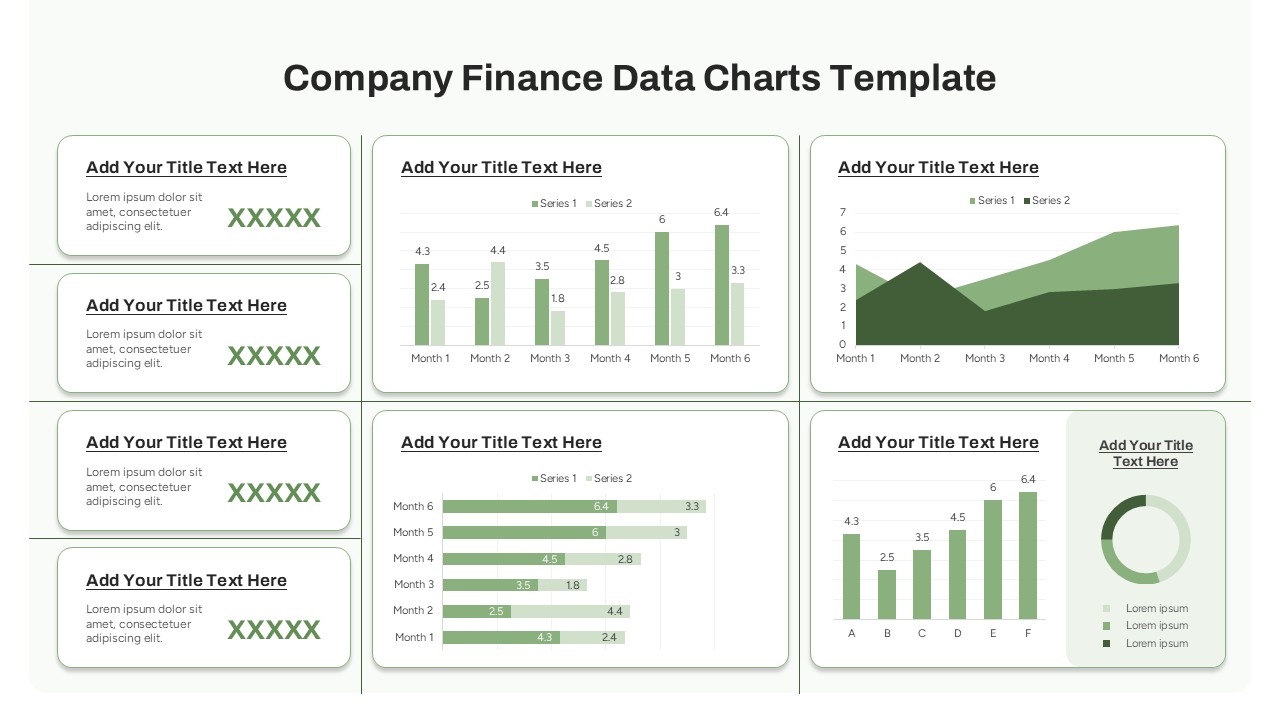
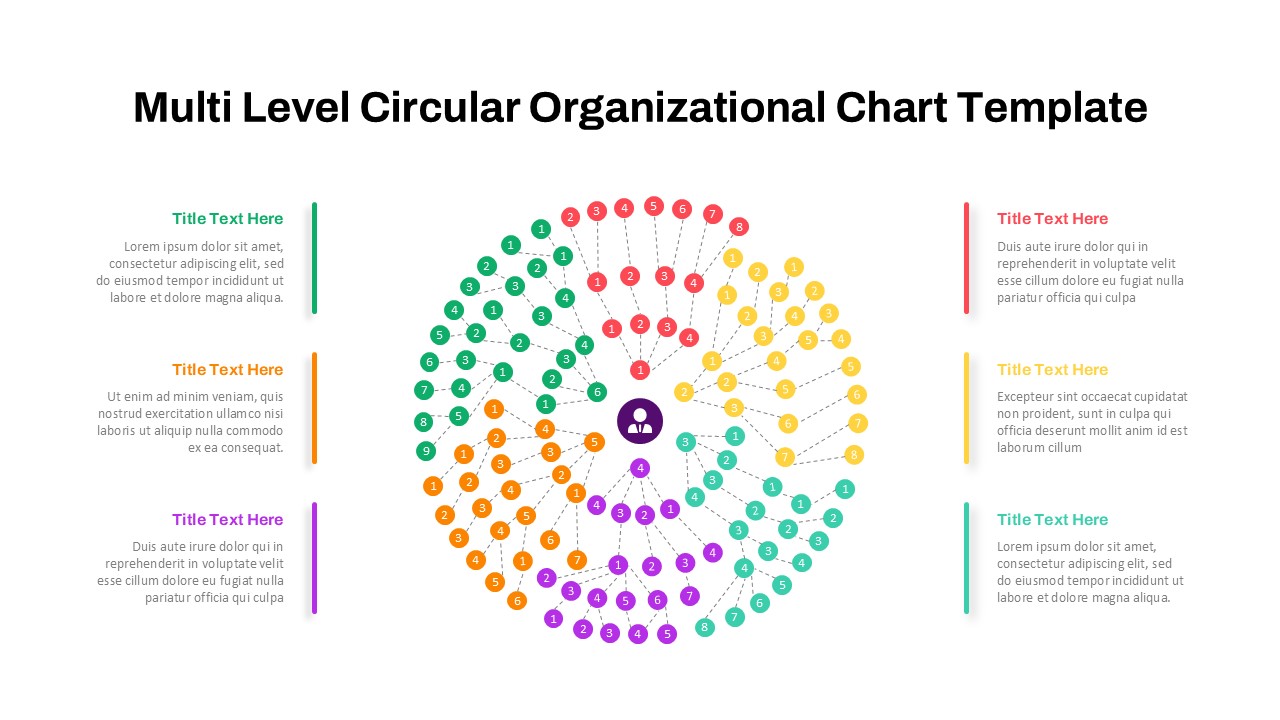
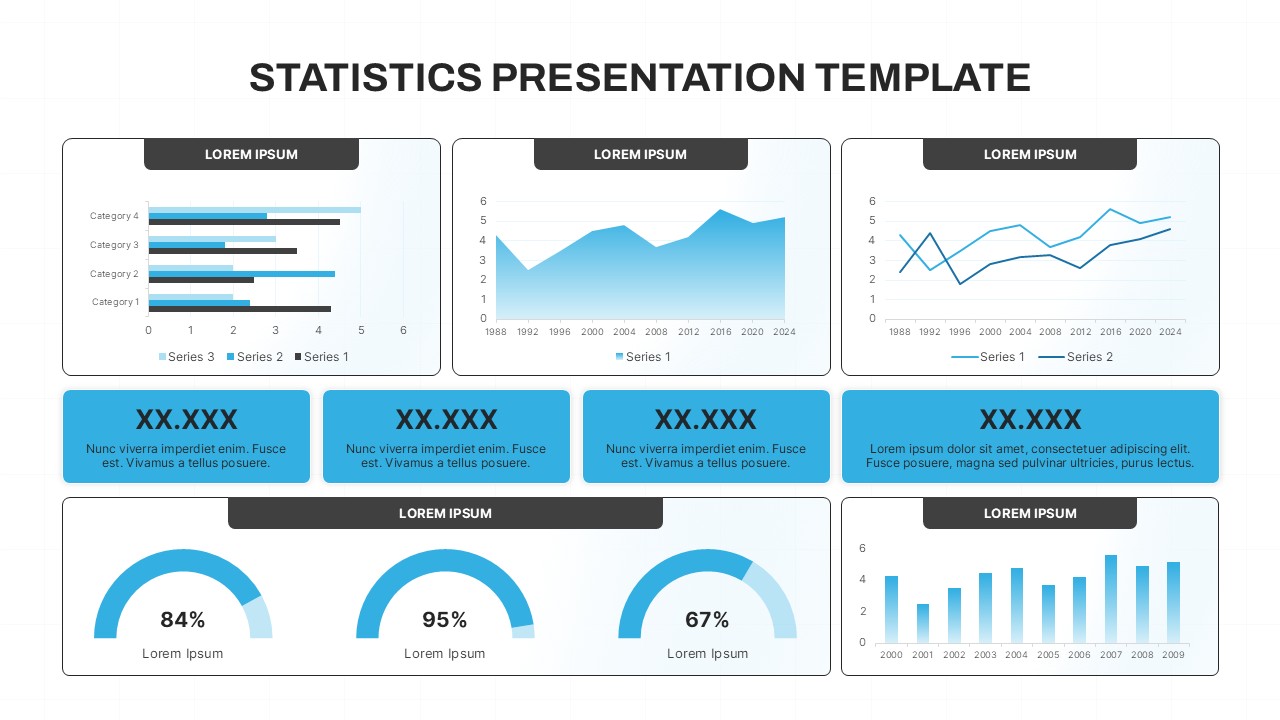
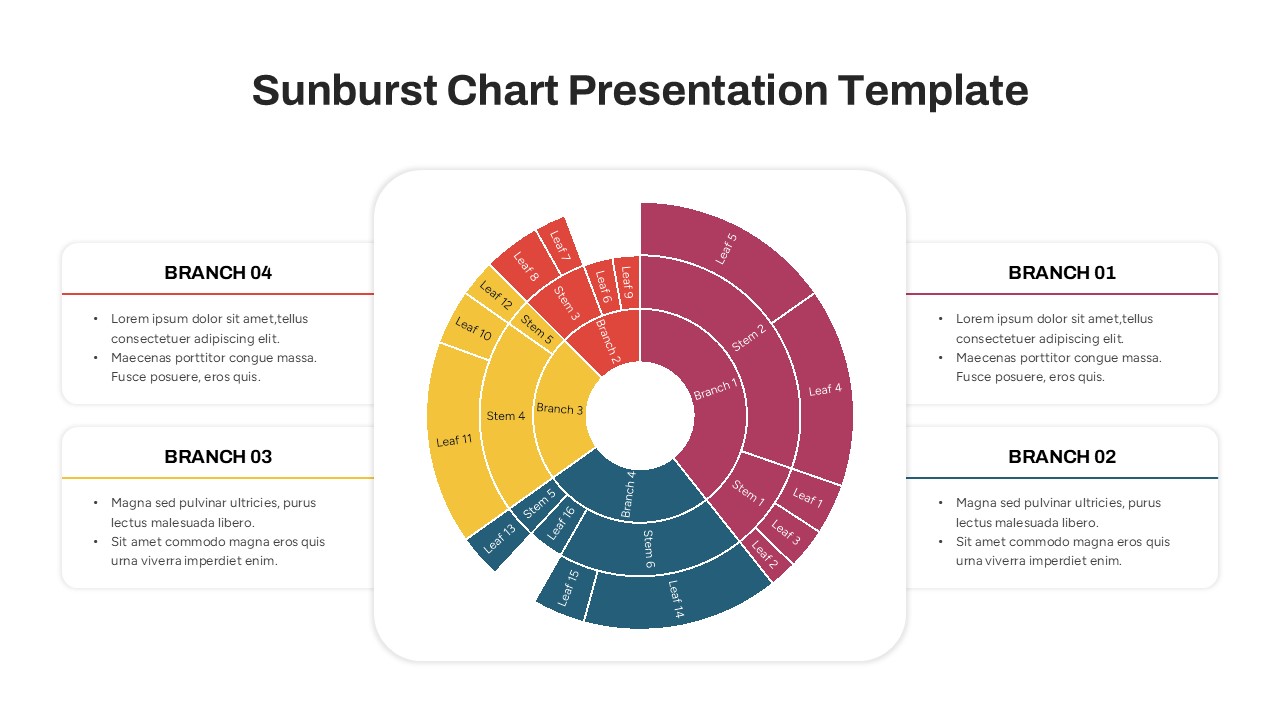
The radial diagram powerpoint template provides a visually striking way to represent multi-dimensional data across various categories using fan-shaped segments arranged radially. This radial chart powerpoint template features color-coded sections with percentage labels, ideal for presenting performance metrics, progress reports, or comparative analysis in a clear and engaging format.
Perfect for business presentations, project tracking, marketing analysis, and data visualization workshops, the template offers an intuitive legend area where each category’s title and description can be clearly outlined alongside its corresponding data value. The clean design and use of distinct colors help improve audience understanding and retention of complex data sets.
Fully customizable in both PowerPoint and Google Slides, this template allows you to adjust colors, text, and data points easily to align with your branding and presentation needs. Use it to communicate insights, track KPIs, or illustrate comparative performance with precision and style.
See more

Aspect Ratio
16:9Item ID
SKT03874
Features of this template
Other User Cases of the Template:
performance dashboards, project status reports, marketing campaign analysis, sales performance tracking, KPI presentations, competitor analysis, market research, operational metrics, strategic planning, team performance reviews
FAQs
You May Also Like These Presentation Templates


- Free

- Free


- Free
- Free
- Free
- Free
- Free