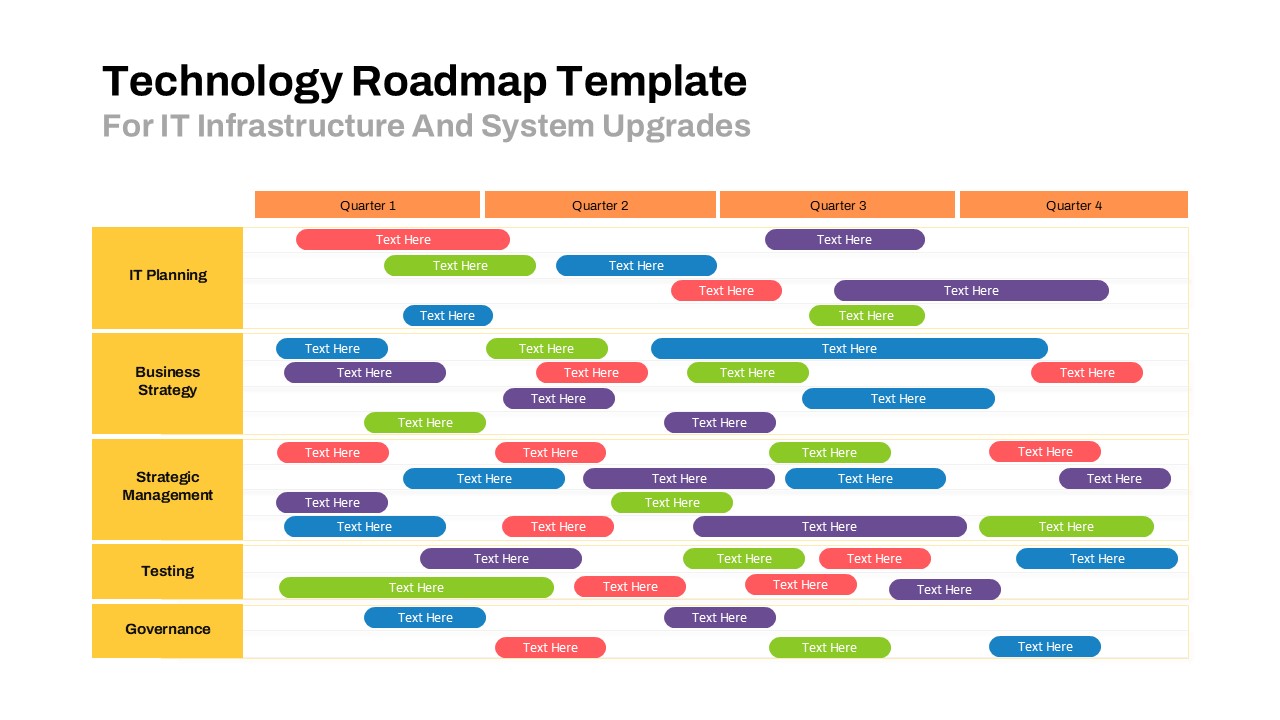
Plan vs Actual Milestone Chart PowerPoint Template
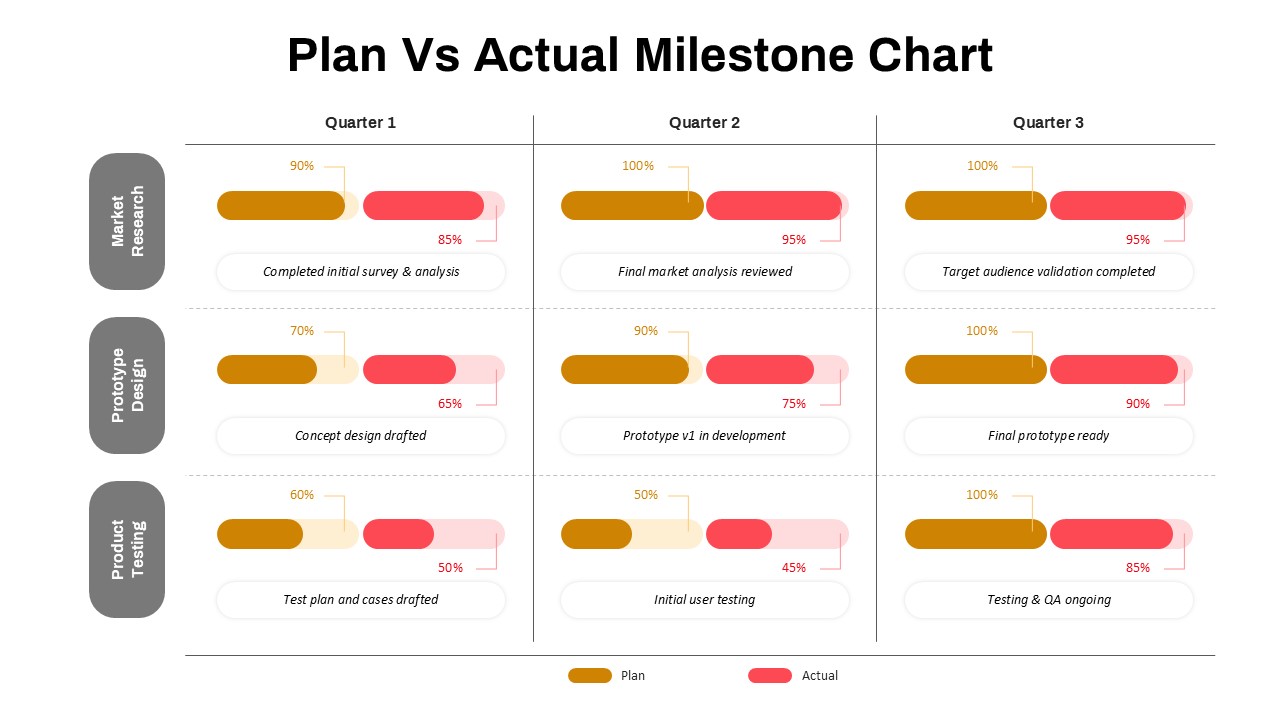
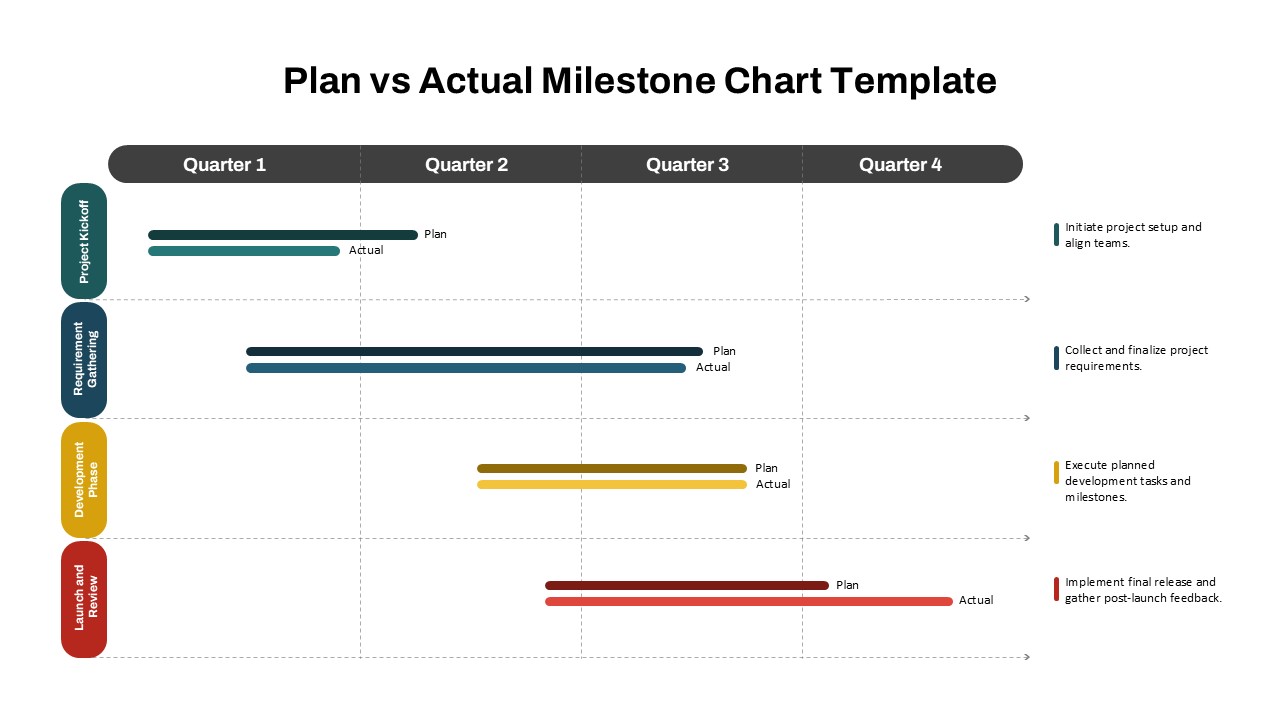
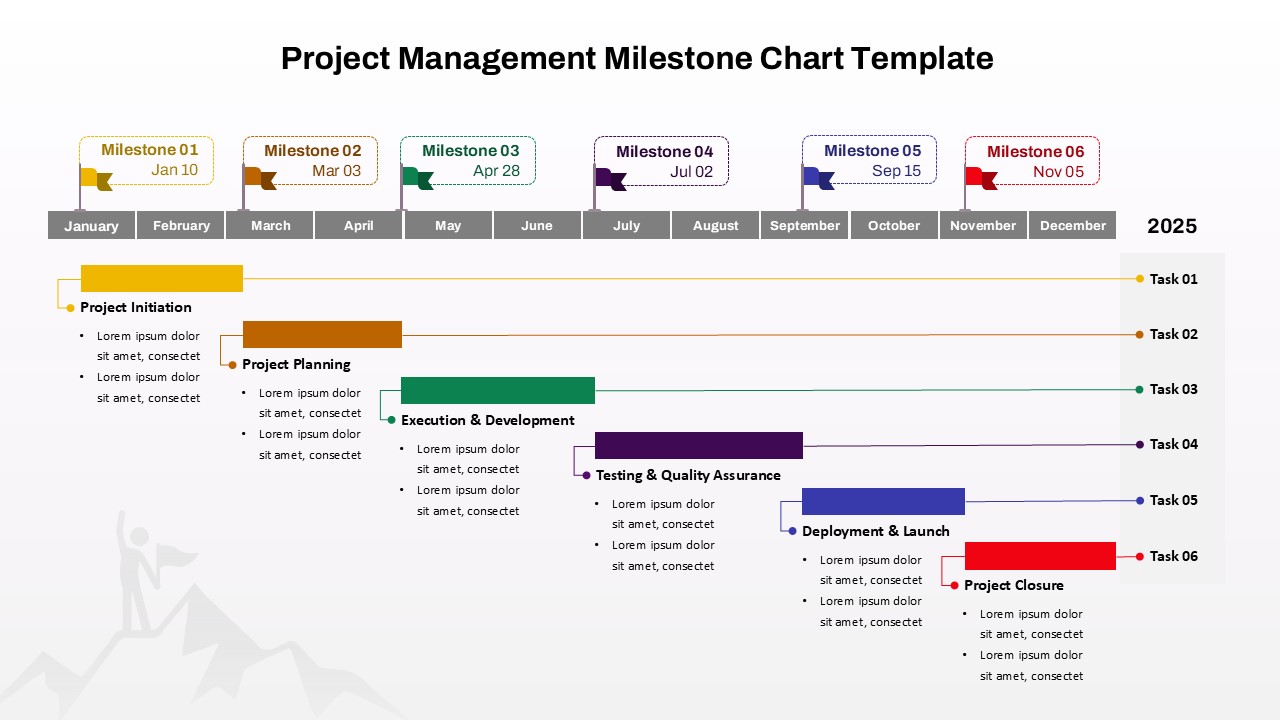
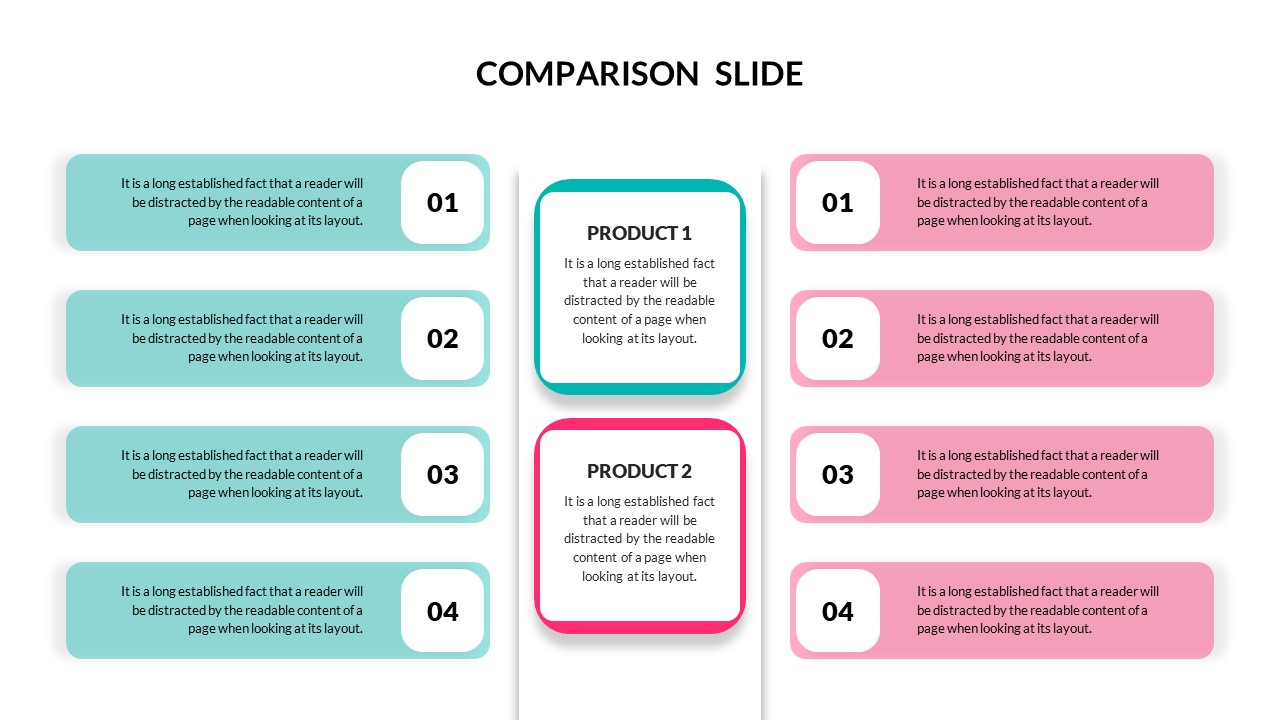
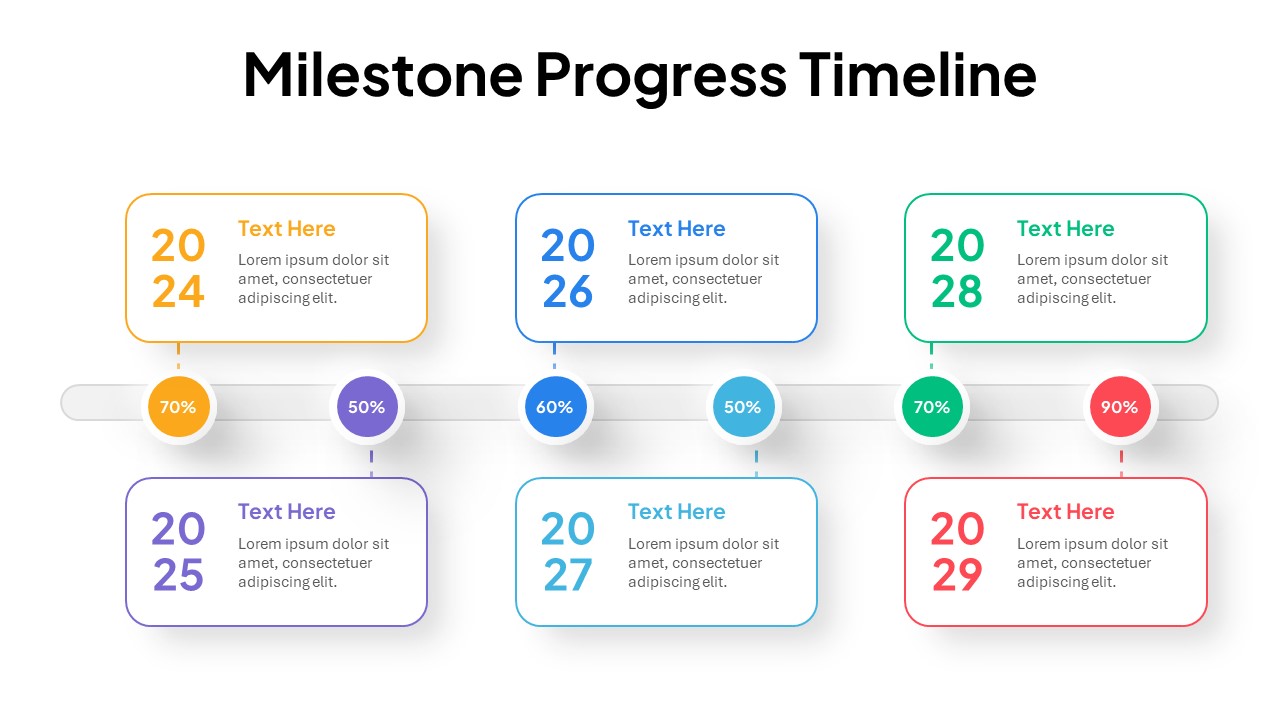
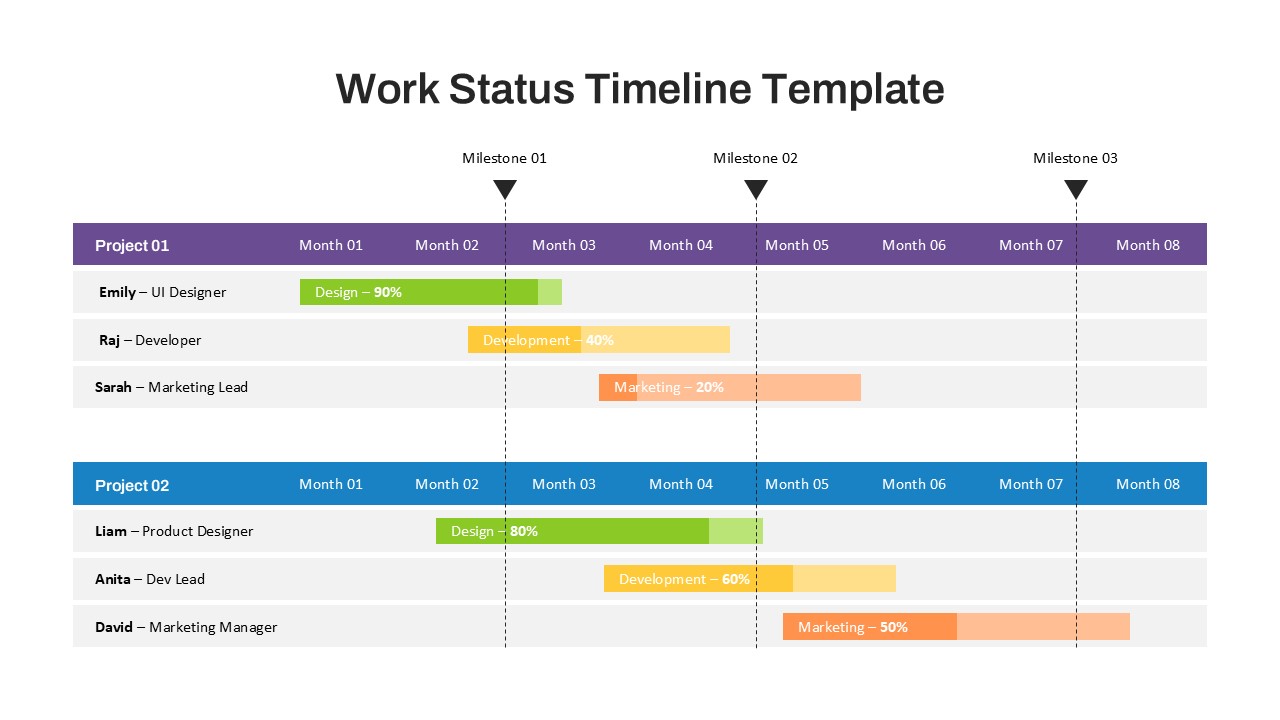
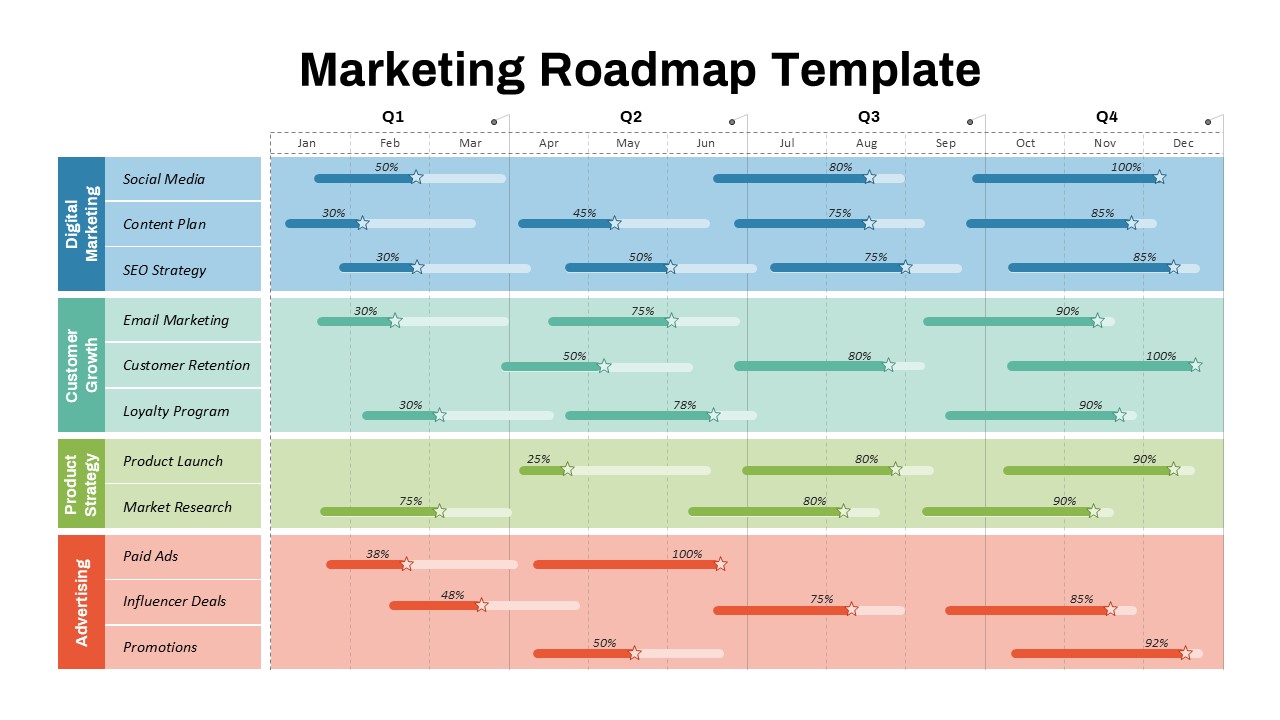
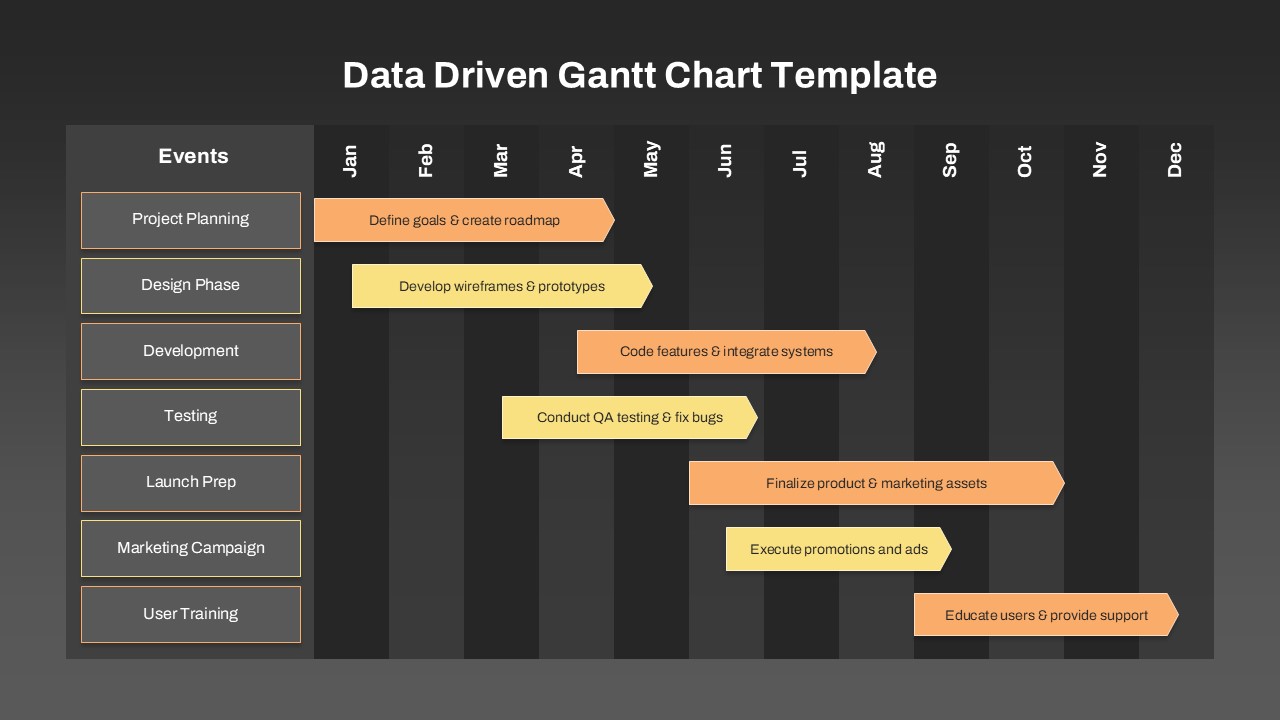
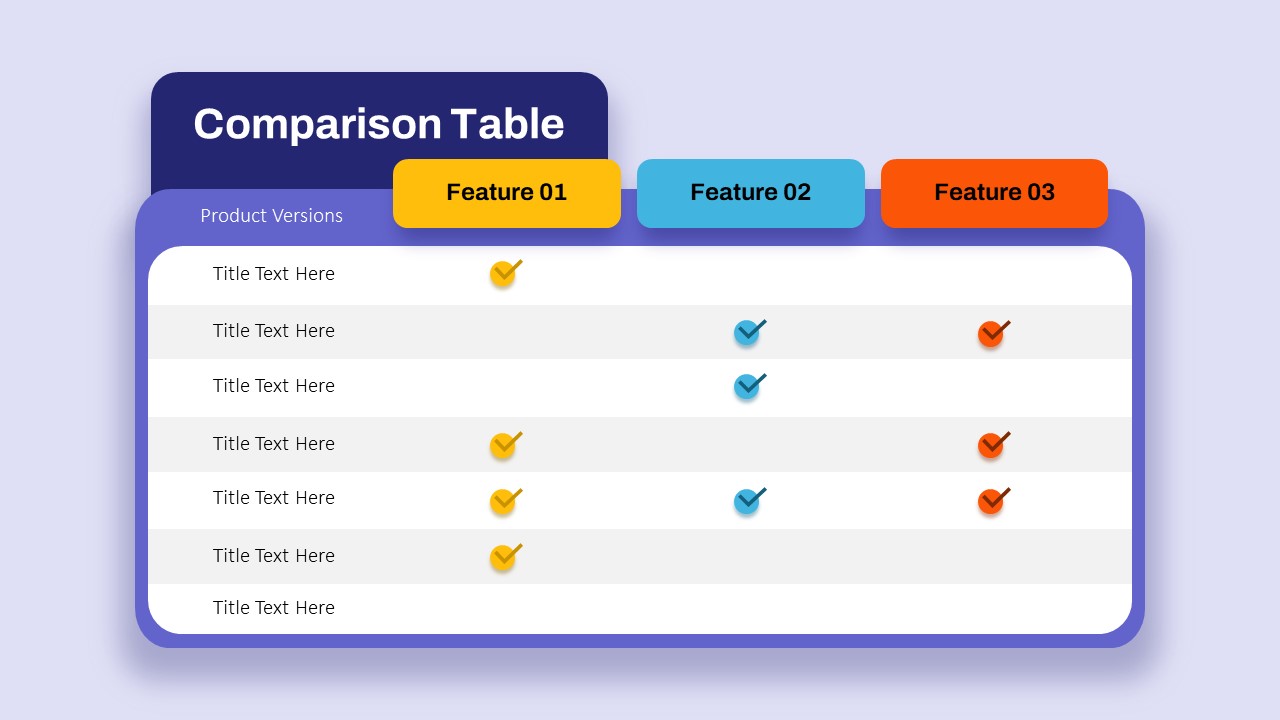
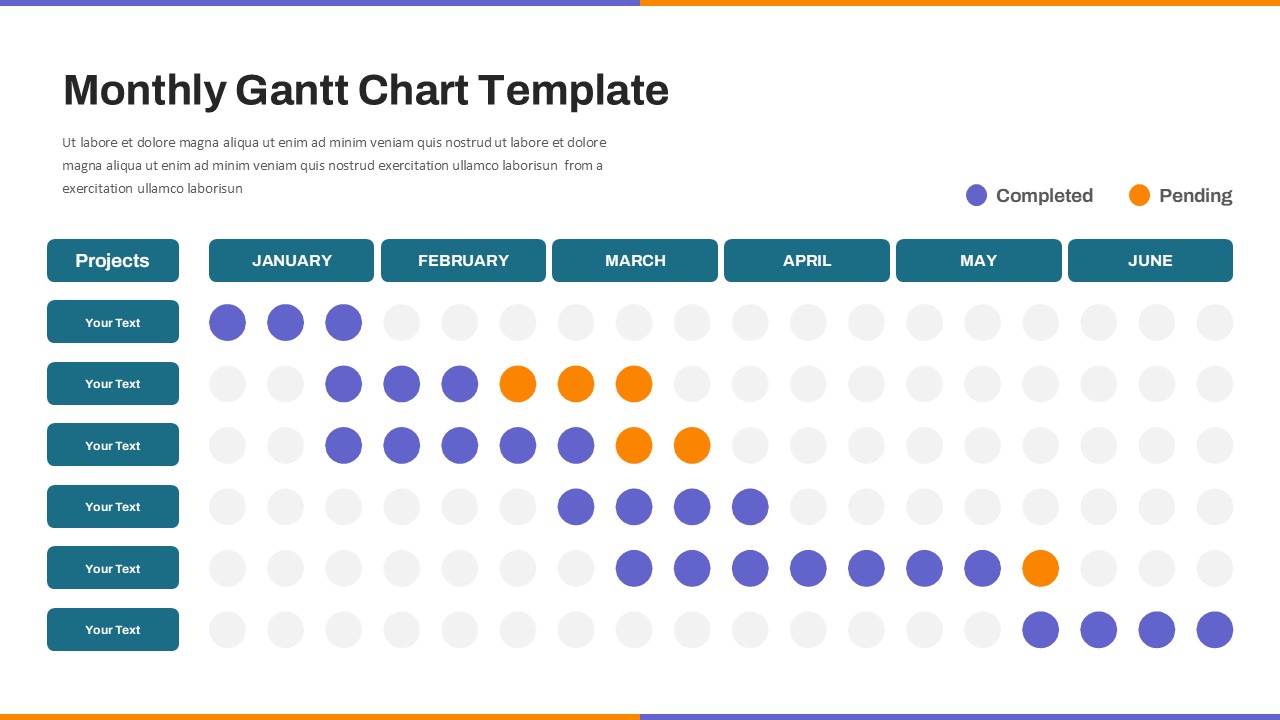
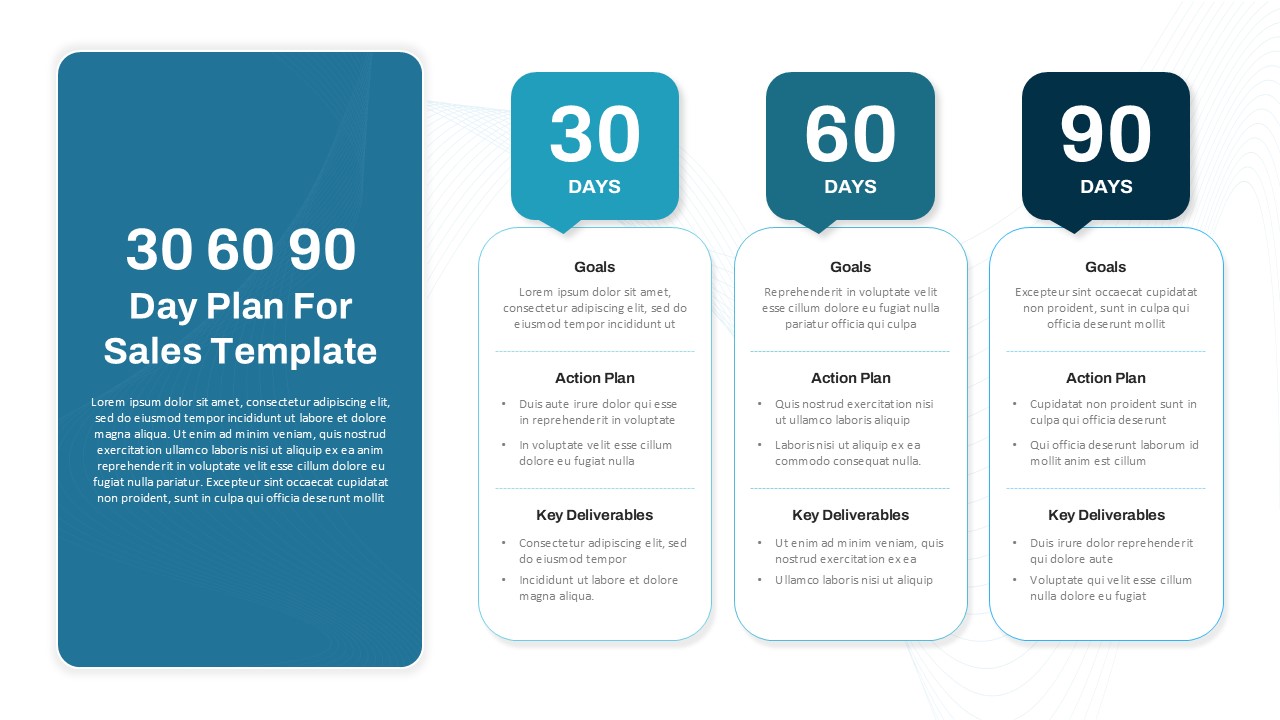
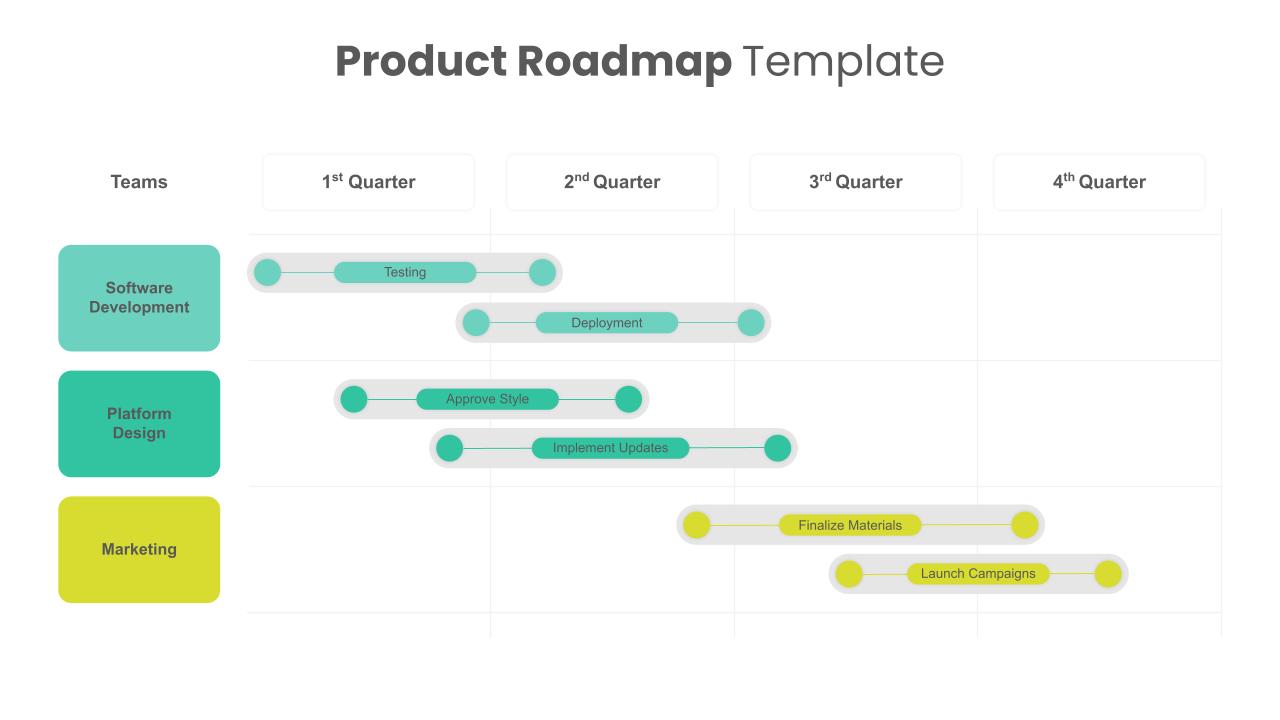
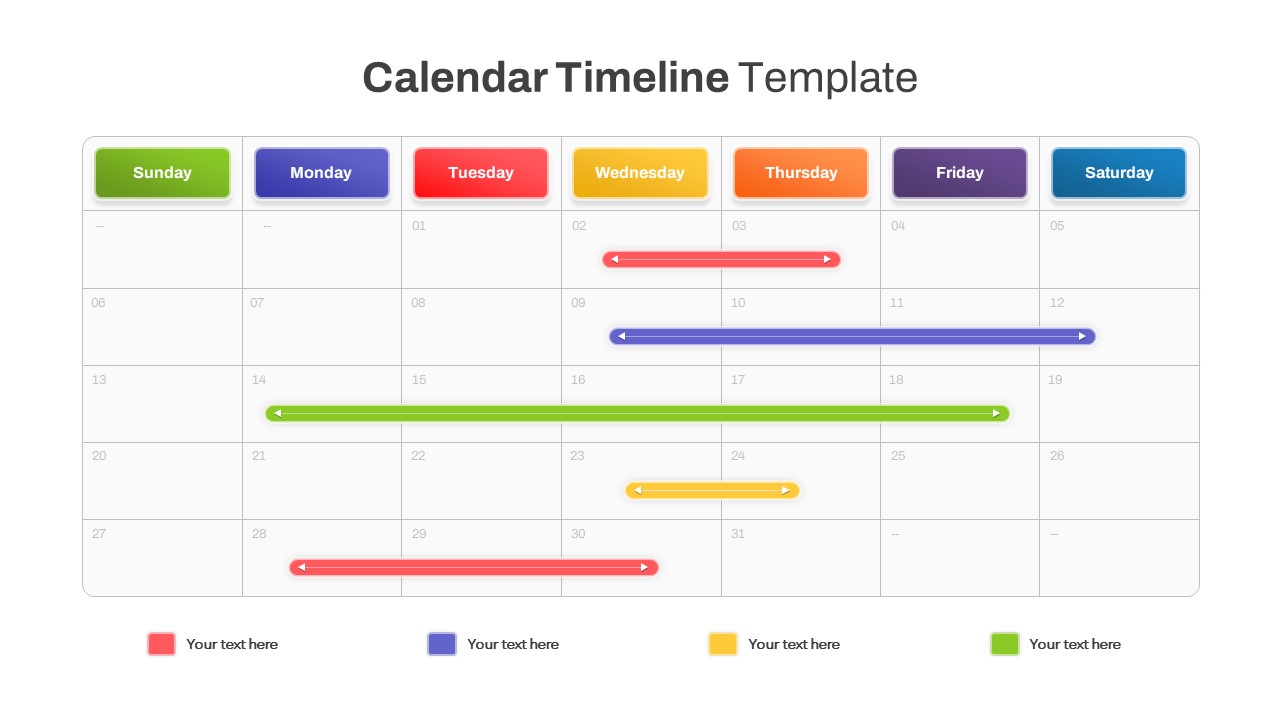
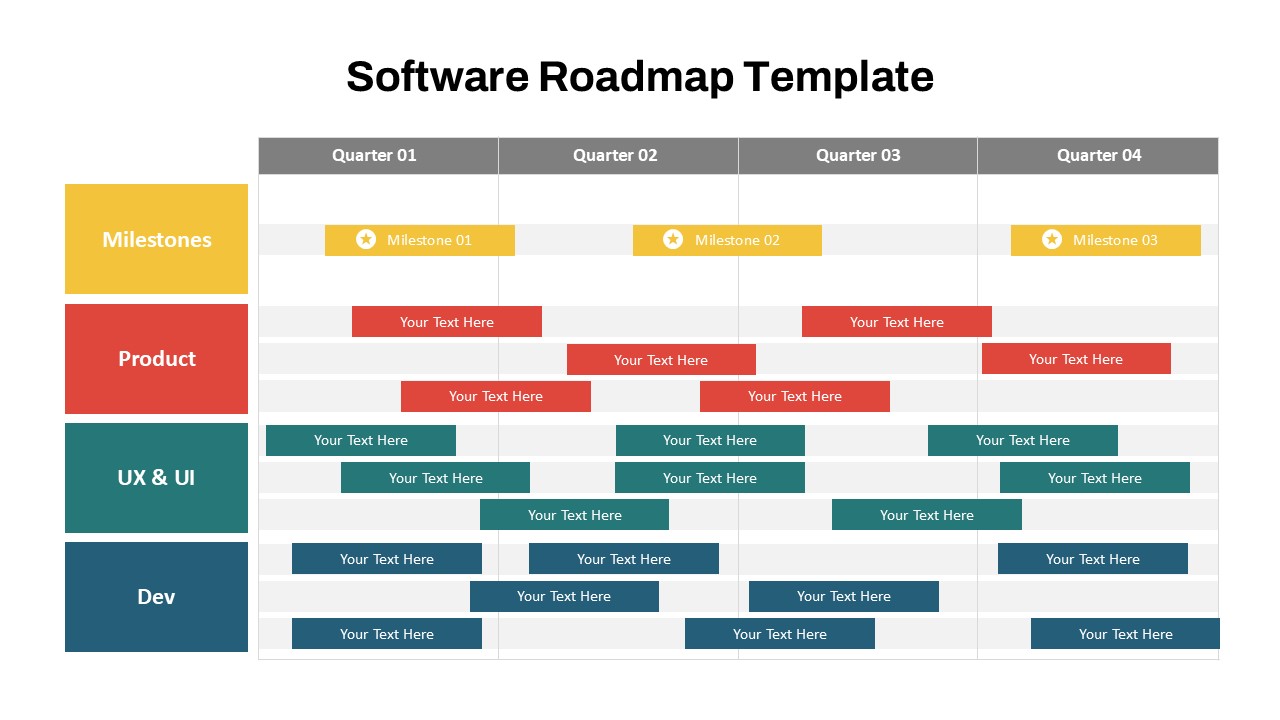
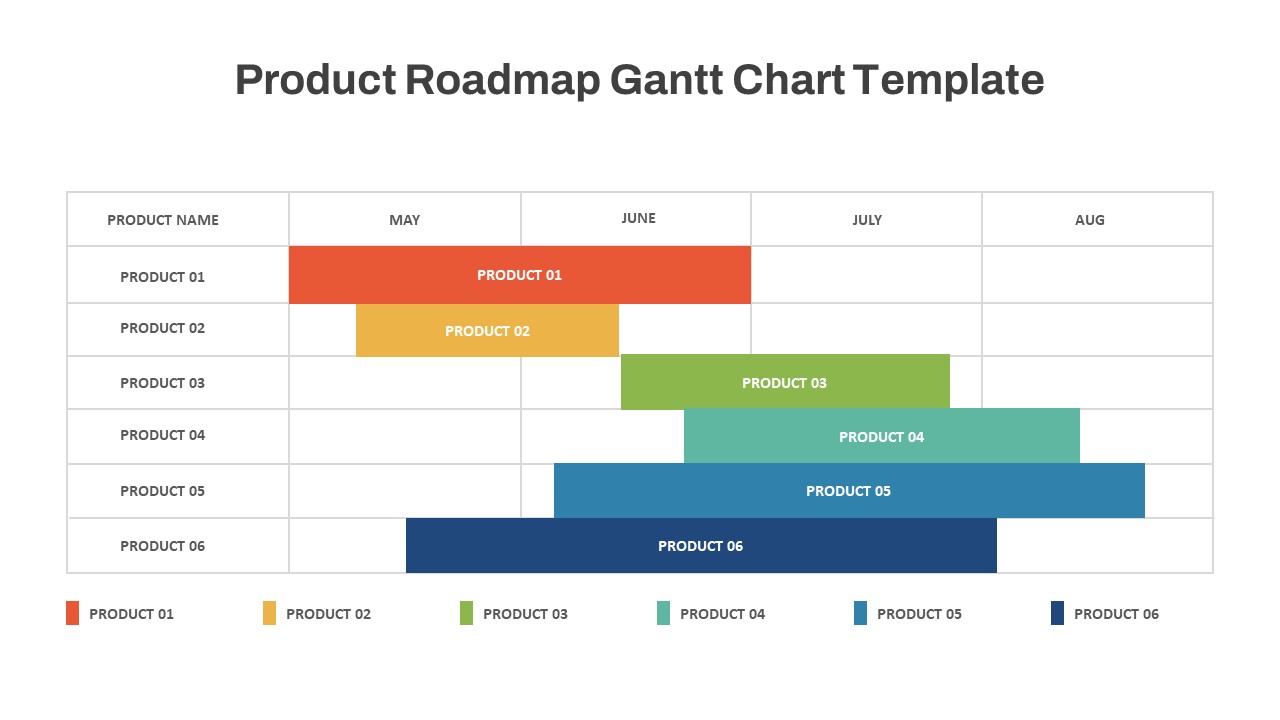
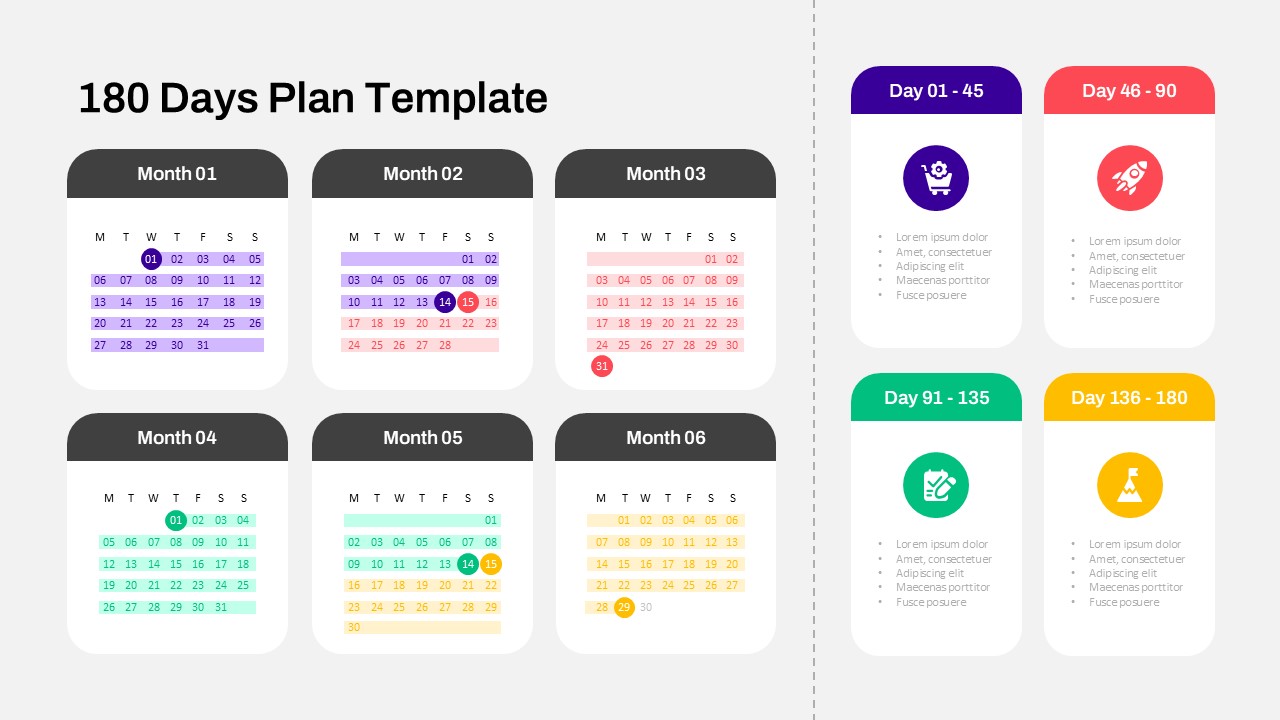
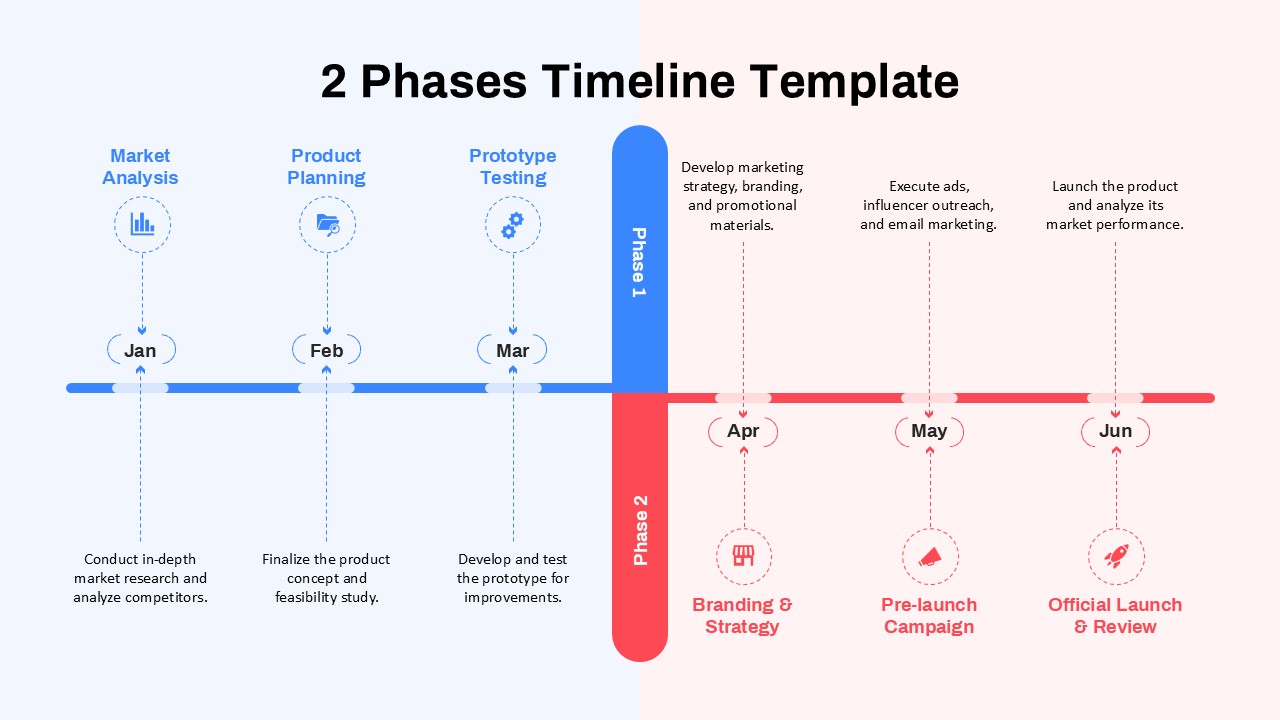
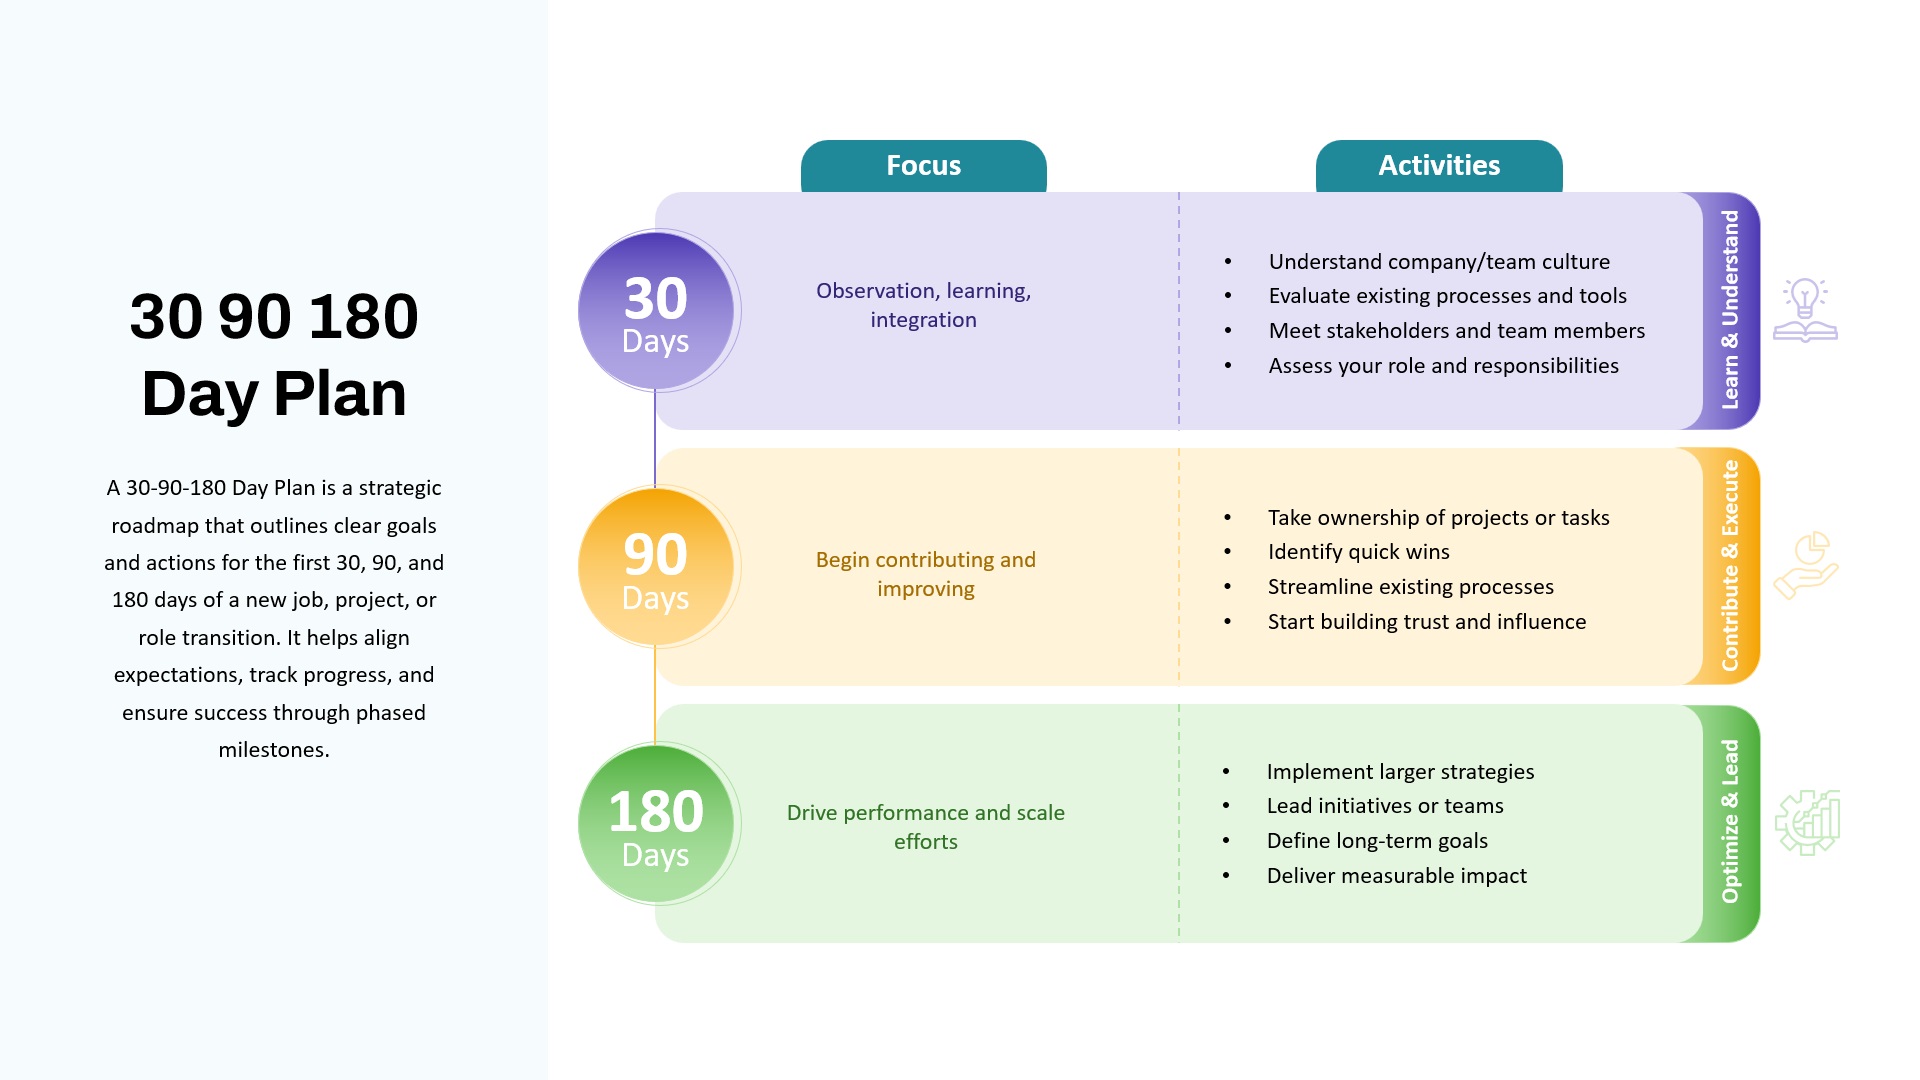
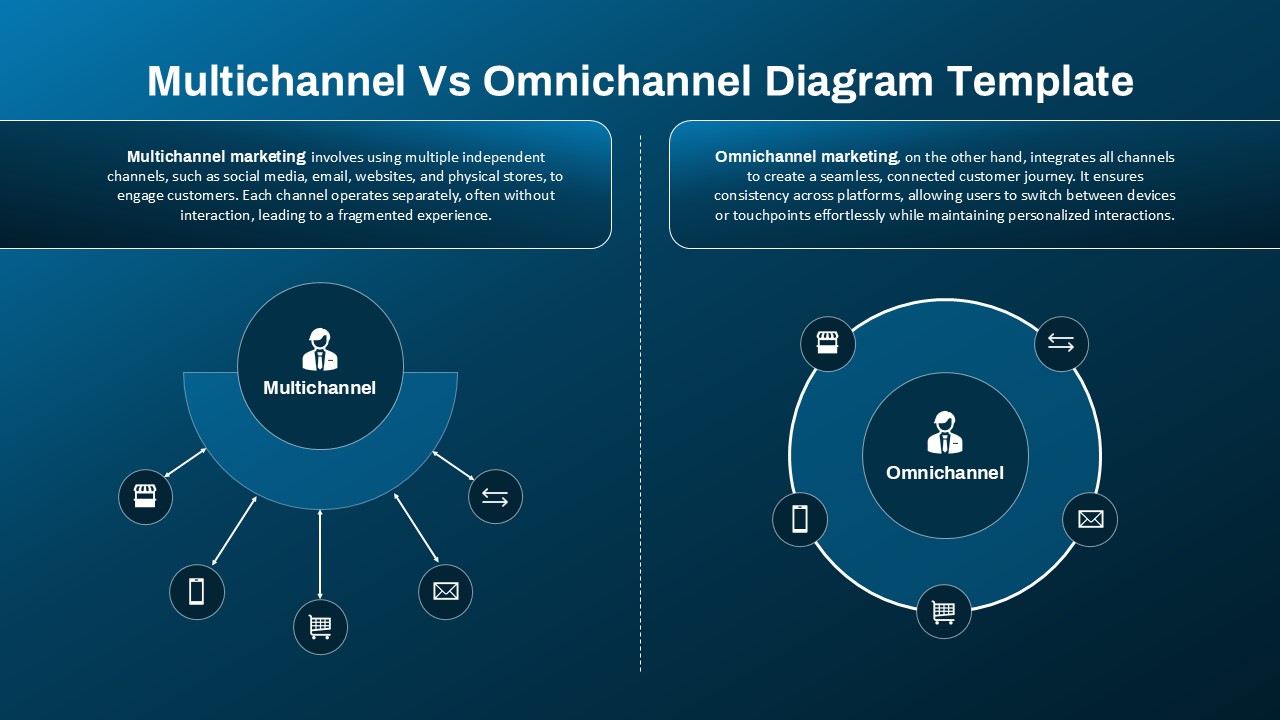
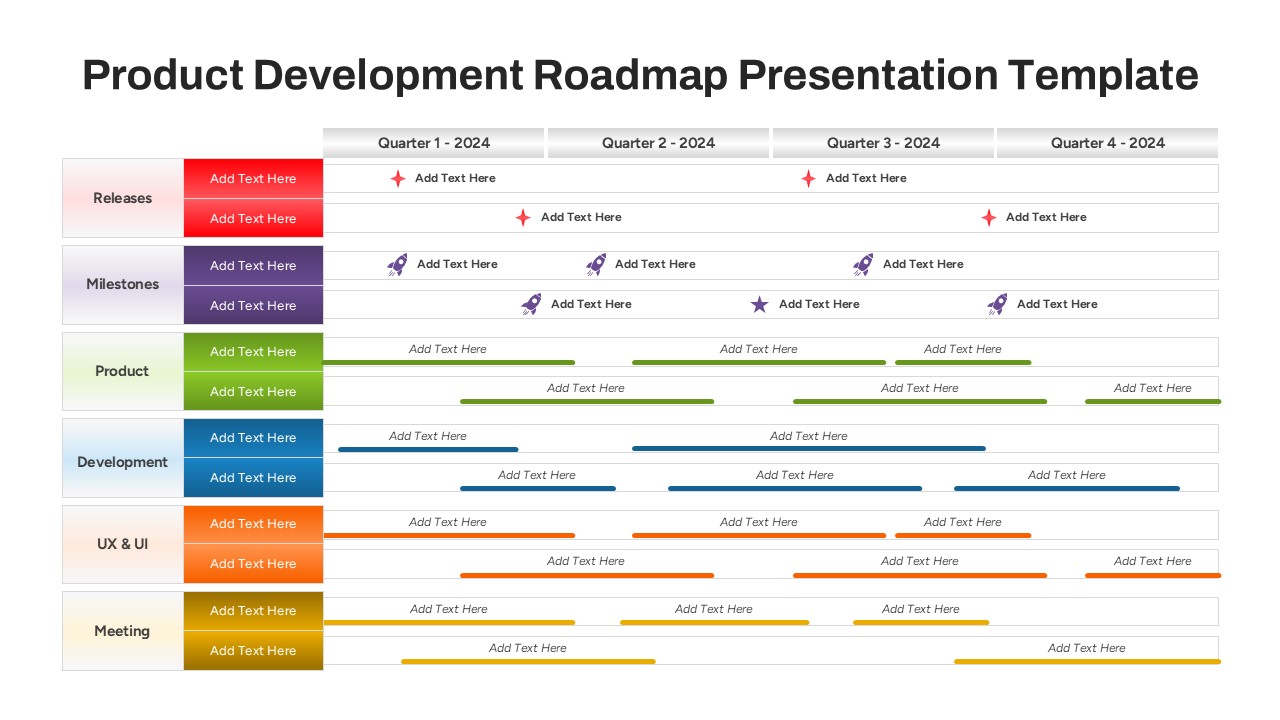
The Plan vs Actual Milestone chart template for PowerPoint is a powerful visual tool designed to compare projected goals against real-time performance across project quarters. Ideal for project managers, product teams, and business analysts, this comparison slide presents a clear, side-by-side comparison of planned versus actual completion percentages for key project milestones. The layout is divided into three quarters, each highlighting three essential project phases: Market Research, Prototype Design, and Product Testing.
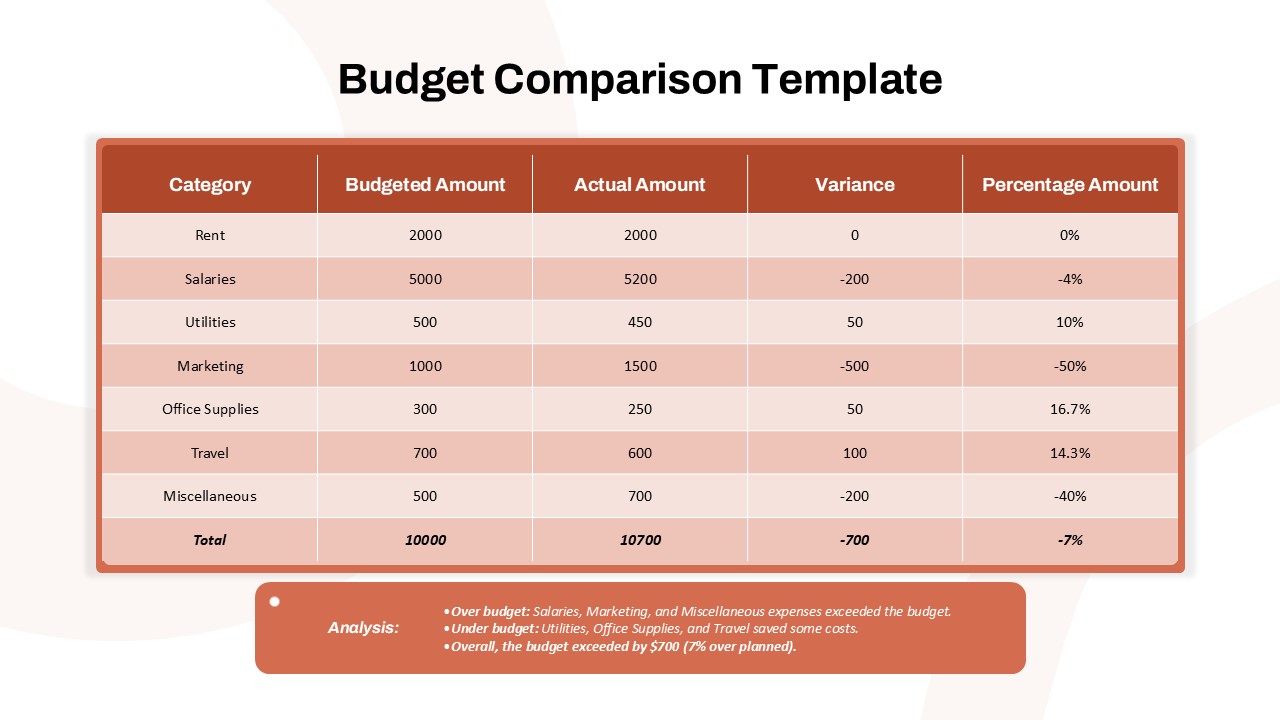
Using contrasting bar colors—orange for “Plan” and red for “Actual”—this chart delivers a quick visual reference to track project alignment. Whether it’s the progress of initial market surveys or the final stages of QA testing, the template makes it easy to pinpoint delays or overperformance. This chart does more than track numbers; it tells a story of project execution and helps stakeholders identify areas needing attention or adjustment.
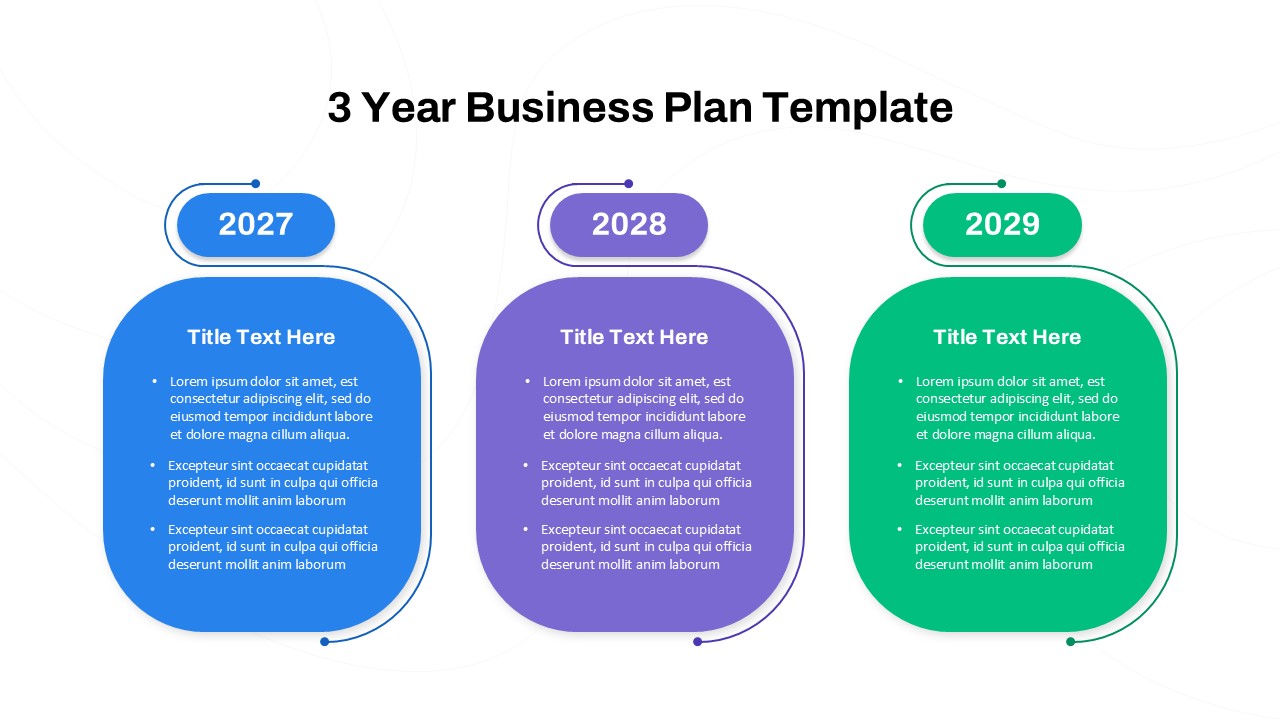
Each milestone is supported by brief annotations summarizing the achievement or stage, adding context without clutter. The organized and minimalist structure enhances clarity, making it suitable for boardroom presentations, team updates, and status reports. Fully editable in both PowerPoint and Google Slides, this template allows users to customize percentages, labels, and timelines effortlessly.
Perfect for results-oriented reporting, this template not only communicates progress but also supports strategic decision-making by highlighting deviations from the original plan.
See more

Aspect Ratio
16:9Item ID
SKT03792
Features of this template
Other User Cases of the Template
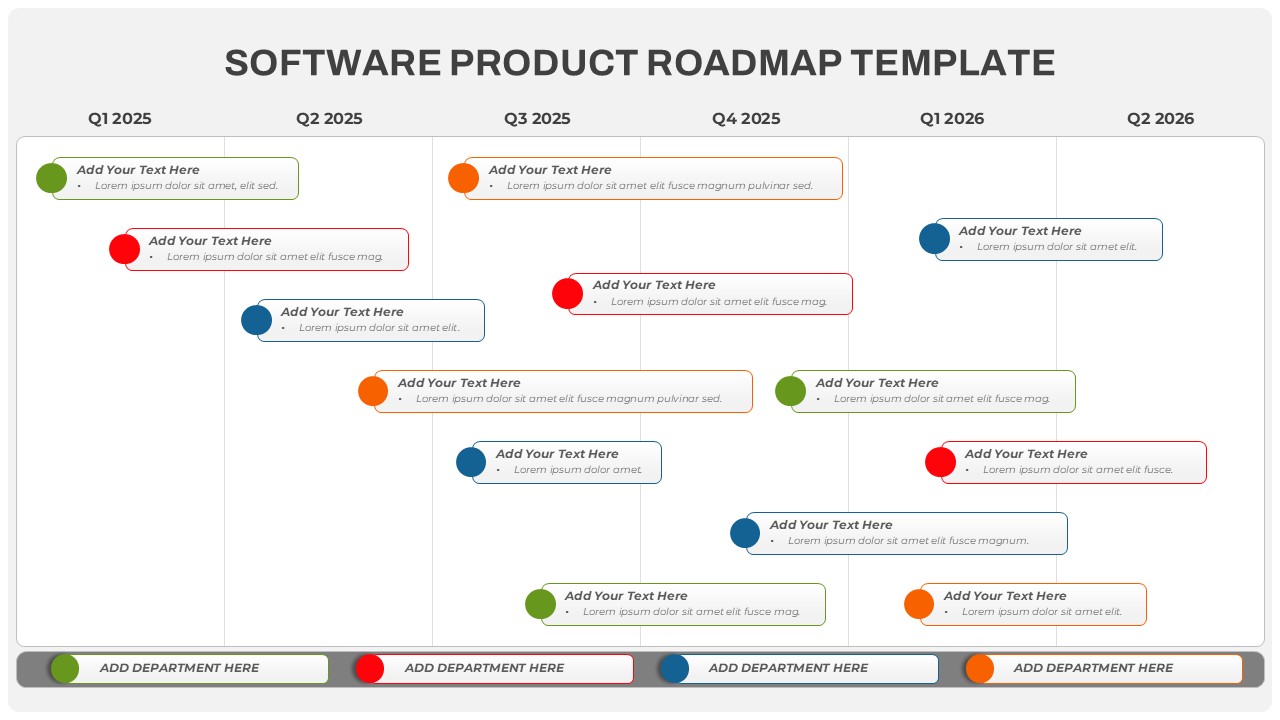
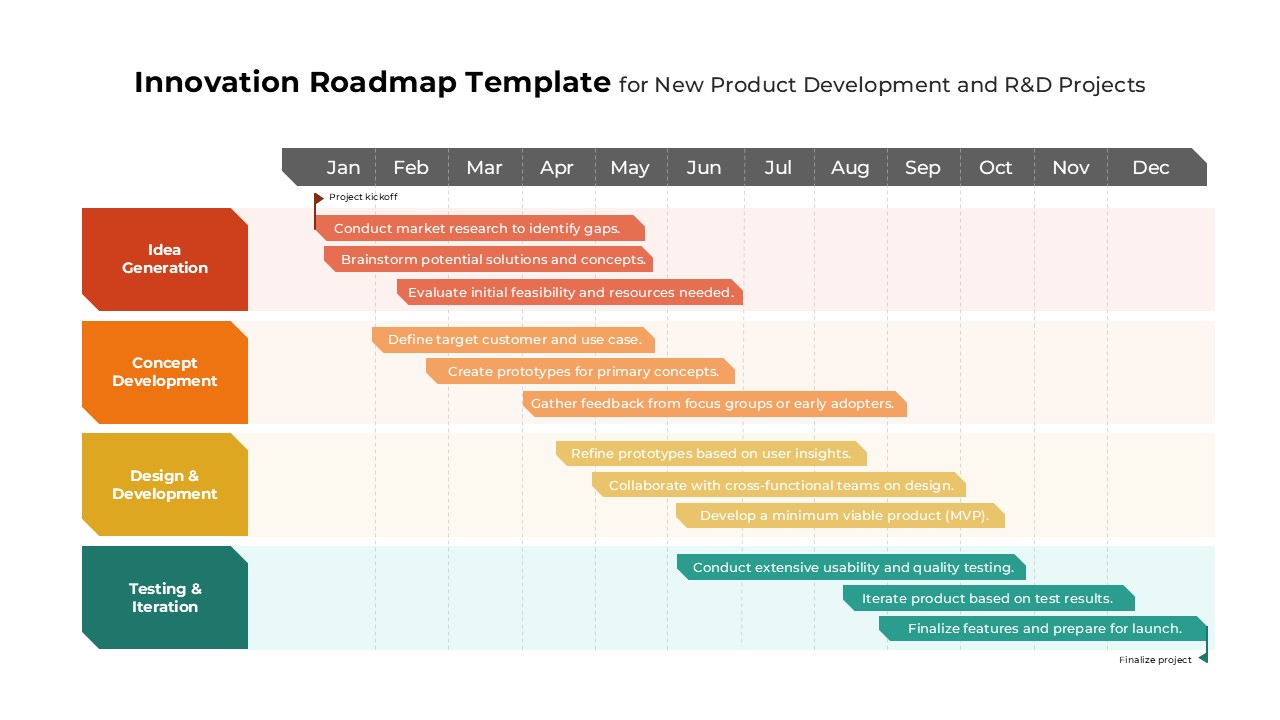
Project status reporting, Quarterly performance reviews, Product development tracking, Agile sprint retrospectives, Team progress visualization, Business roadmap presentations, Strategic planning updates, KPI performance analysis
FAQs
You May Also Like These Presentation Templates


- Free
- Free