Iceberg Diagram Template for PowerPoint
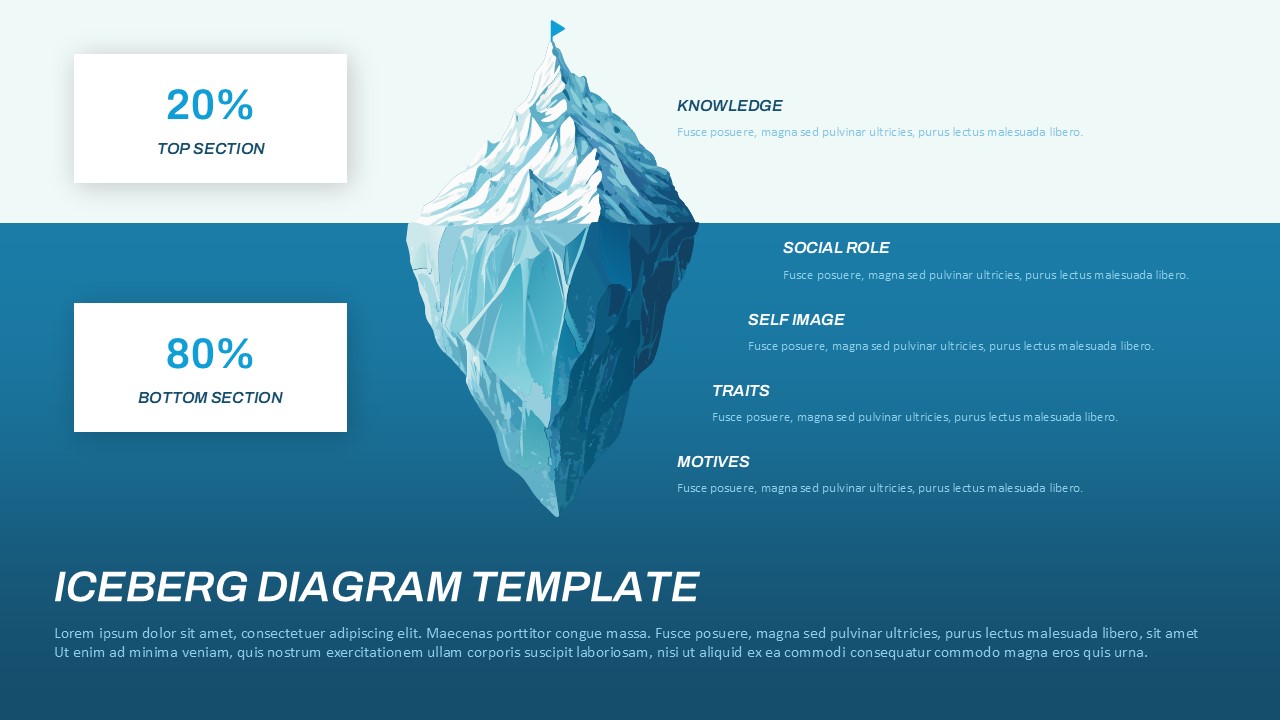
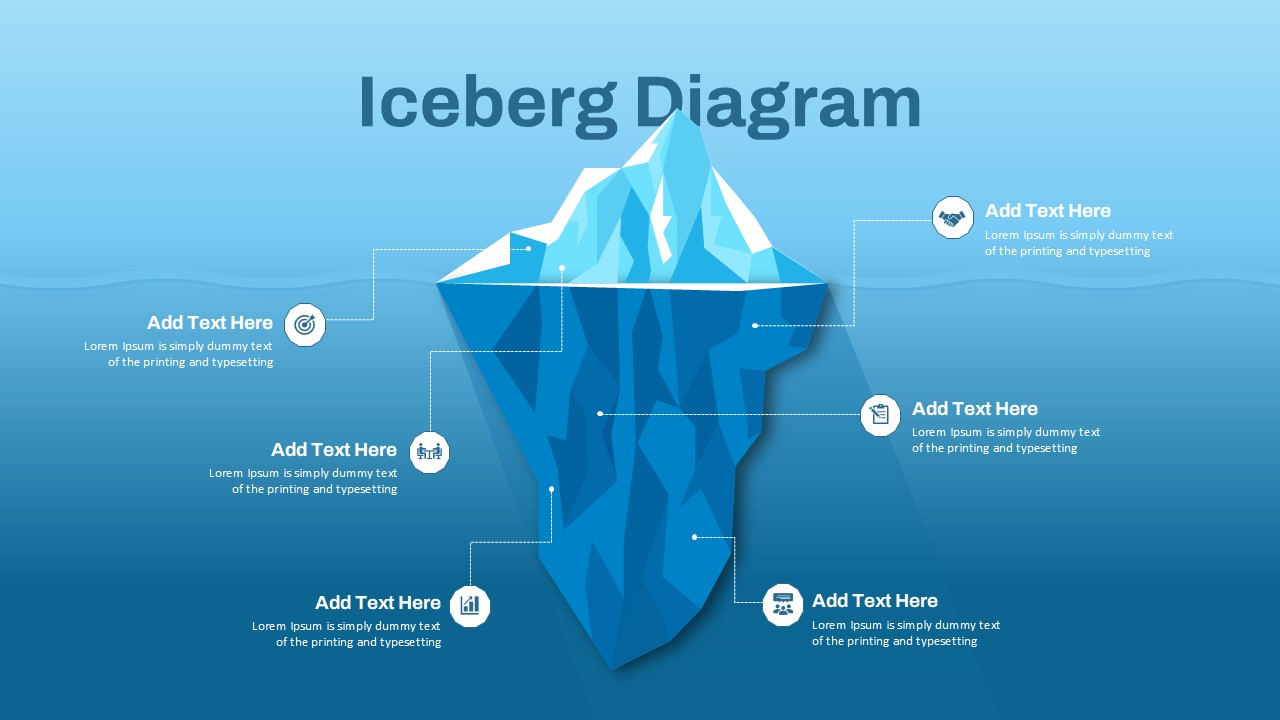
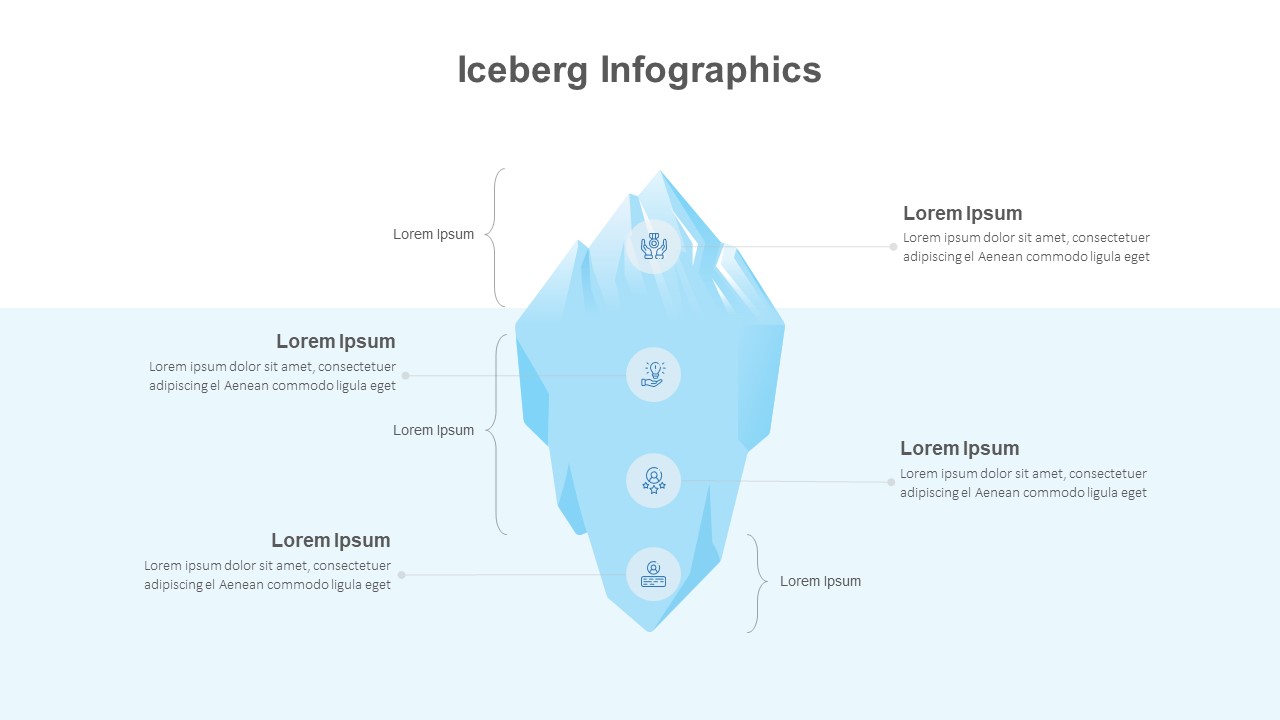
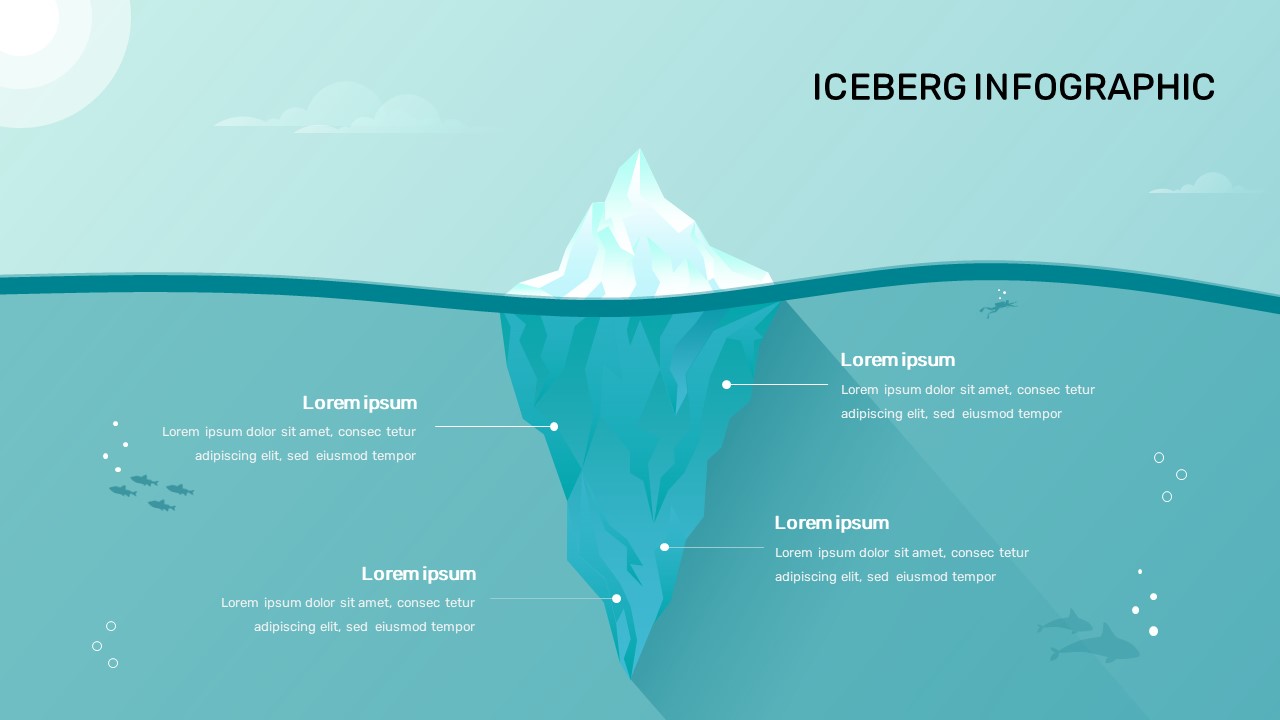
The Iceberg Diagram Template for PowerPoint is a visually compelling tool that illustrates the concept of visible and hidden factors influencing behaviors, systems, or personalities. Based on the classic iceberg metaphor, this iceberg powerpoint template divides content into two clear sections: the visible 20% (above the surface) and the hidden 80% (below the surface). The upper section can be used to highlight observable elements such as knowledge or surface-level behaviors, while the submerged portion represents deeper attributes like motives, traits, self-image, and social roles.
This design is particularly effective for presentations that aim to explore root causes, psychological models, organizational dynamics, or brand identity frameworks. With its clean, professional layout and vivid iceberg visual, the iceberg slide template effectively communicates complex ideas in a digestible, intuitive format. Presenters can use this to encourage deeper analysis and reflection, moving beyond superficial assessments to explore the underlying drivers of outcomes or perceptions.
Fully editable in both PowerPoint and Google Slides, this template offers flexibility for customization, making it suitable for a range of topics from education and leadership training to corporate strategy and personal development. Its minimalist yet bold design ensures that your message remains the focus, while the iceberg image enhances engagement and retention.
See more

Aspect Ratio
16:9Item ID
SKT04005
Features of this template
Other User Cases of the Template:
personal development coaching, brand identity analysis, organizational behavior presentations, root cause analysis, leadership training, employee performance reviews, psychological assessments, strategic planning workshops, educational models, corporate values alignment
FAQs
You May Also Like These Presentation Templates


- Free

- Free

- Free
- Free
- Free
- Free
- Free