Cash Flow Forecasting PowerPoint Template
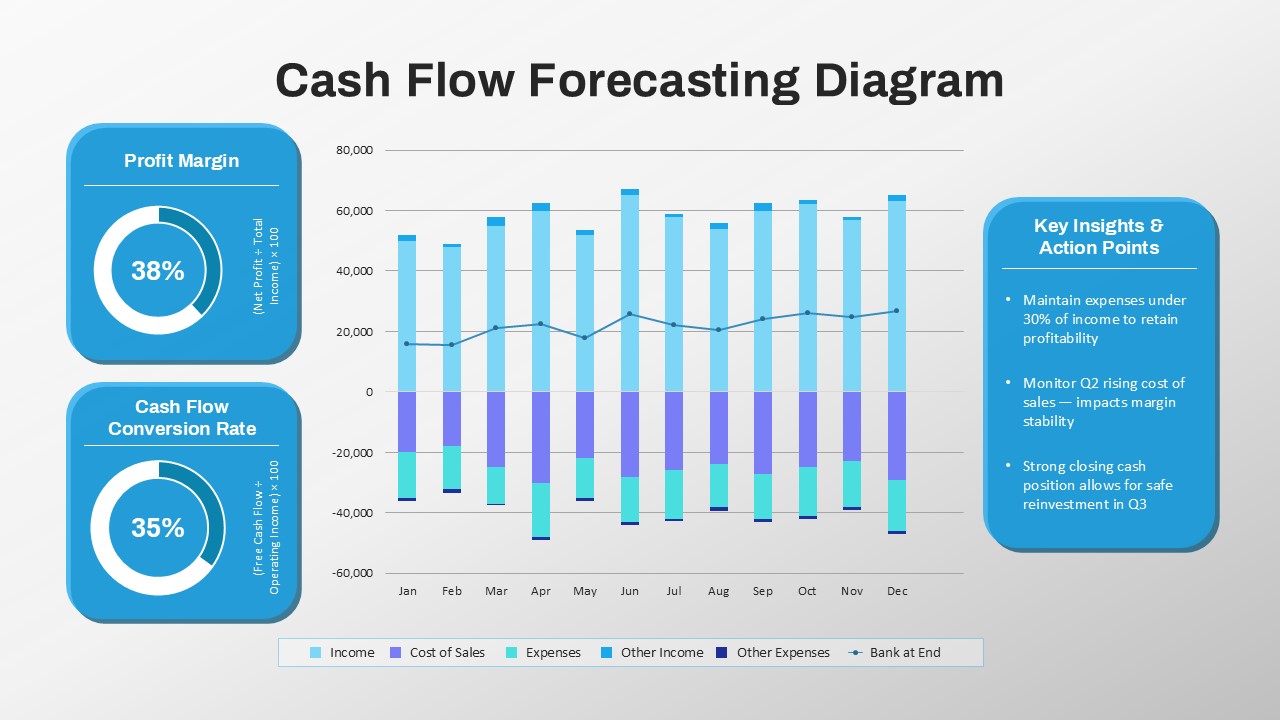
Present your company’s financial trajectory with clarity using this Cash Flow Forecasting PowerPoint Template. Designed for finance professionals, analysts, and business strategists, this visually rich slide provides a month-by-month breakdown of projected income, expenses, and net cash flow. It’s a powerful tool for tracking liquidity, managing operational budgets, and planning strategic investments.
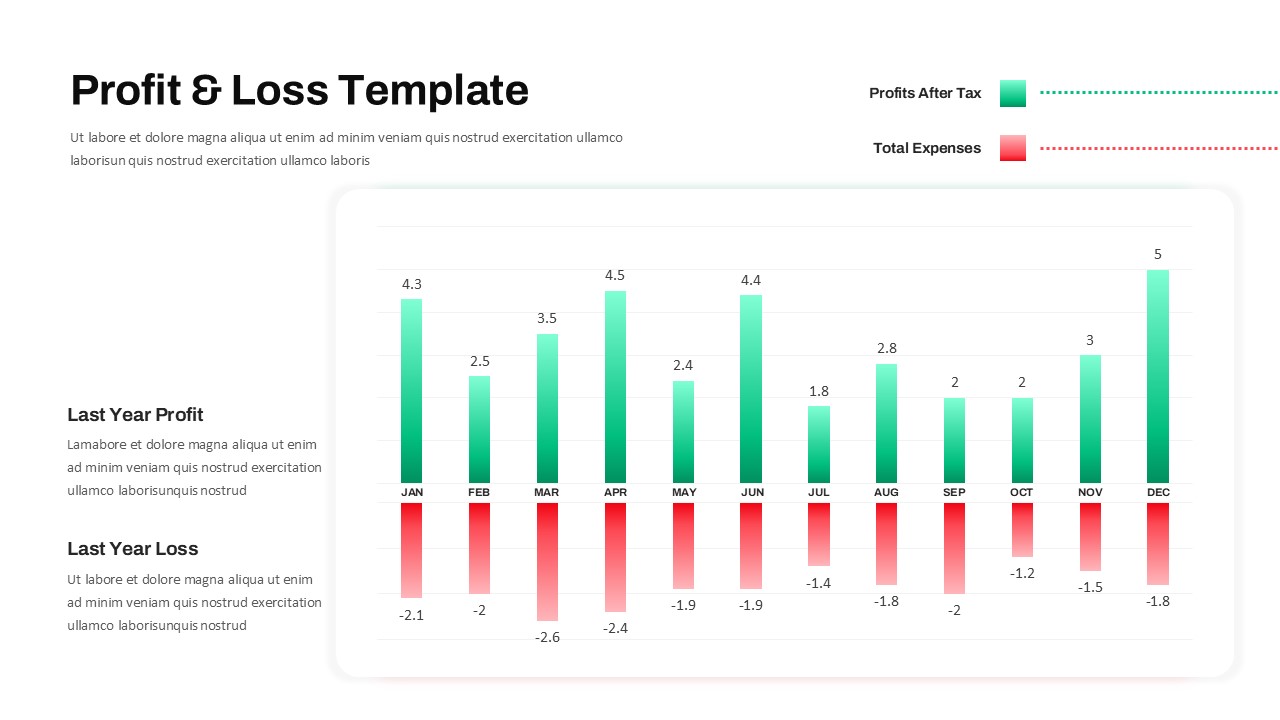
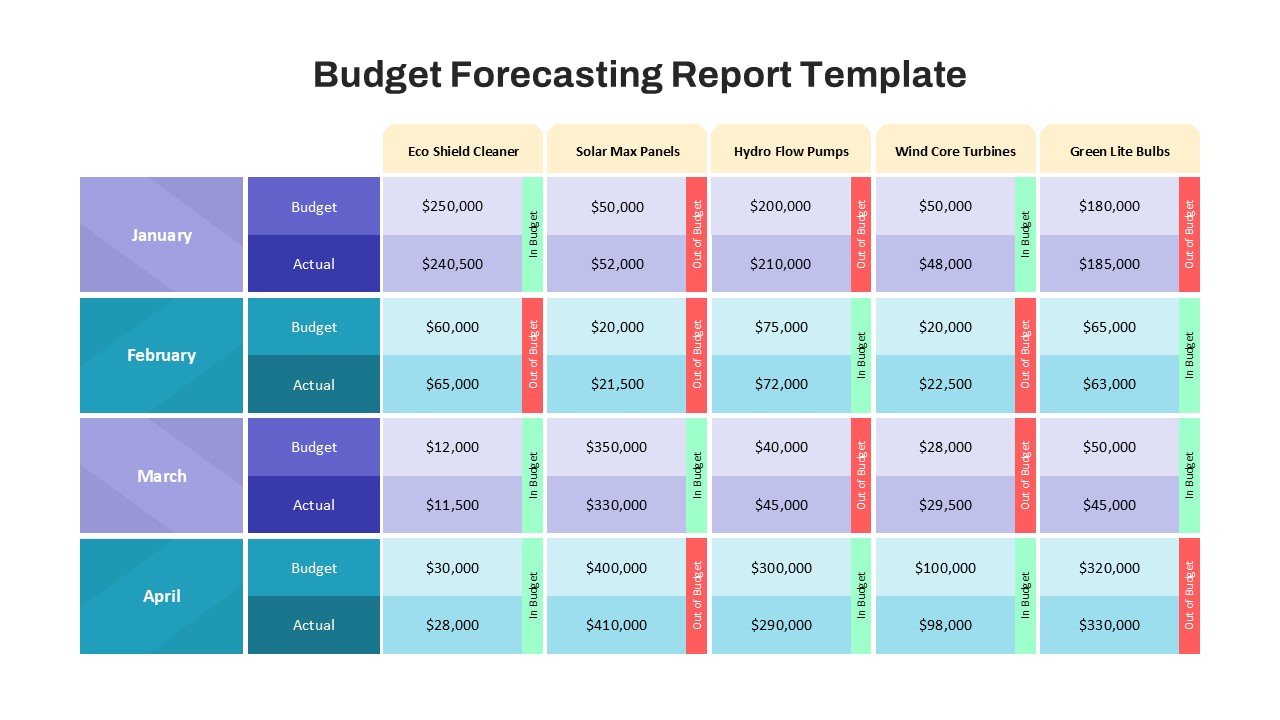
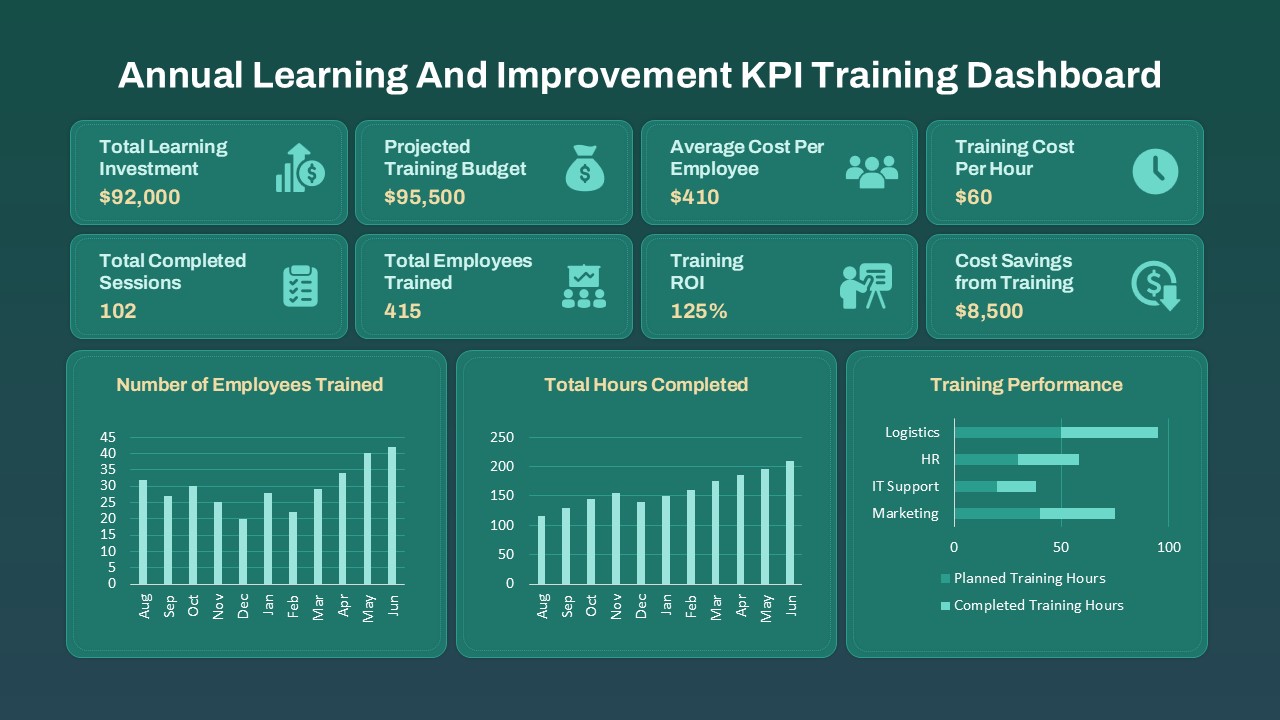
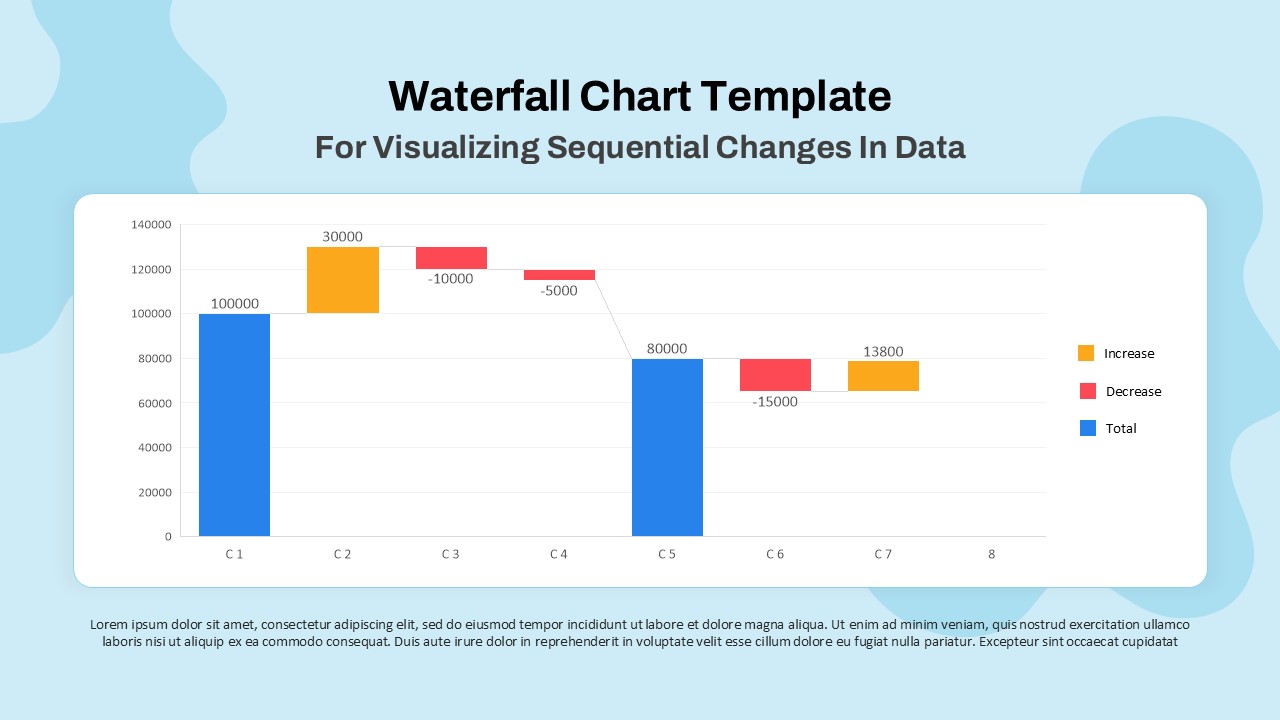
The template includes a stacked bar and line graph that displays key financial components—such as income, cost of sales, operating expenses, and other cash movements—across a 12-month period. Two donut charts to the left visually summarize critical performance indicators: Profit Margin (38%) and Cash Flow Conversion Rate (35%), offering a quick snapshot of operational efficiency and profitability.
To the right, a dedicated Key Insights & Action Points panel distills complex data into actionable takeaways, such as maintaining expense ratios, monitoring cost trends, and leveraging strong cash positions for future reinvestment. This section helps bridge financial data with strategic decision-making.
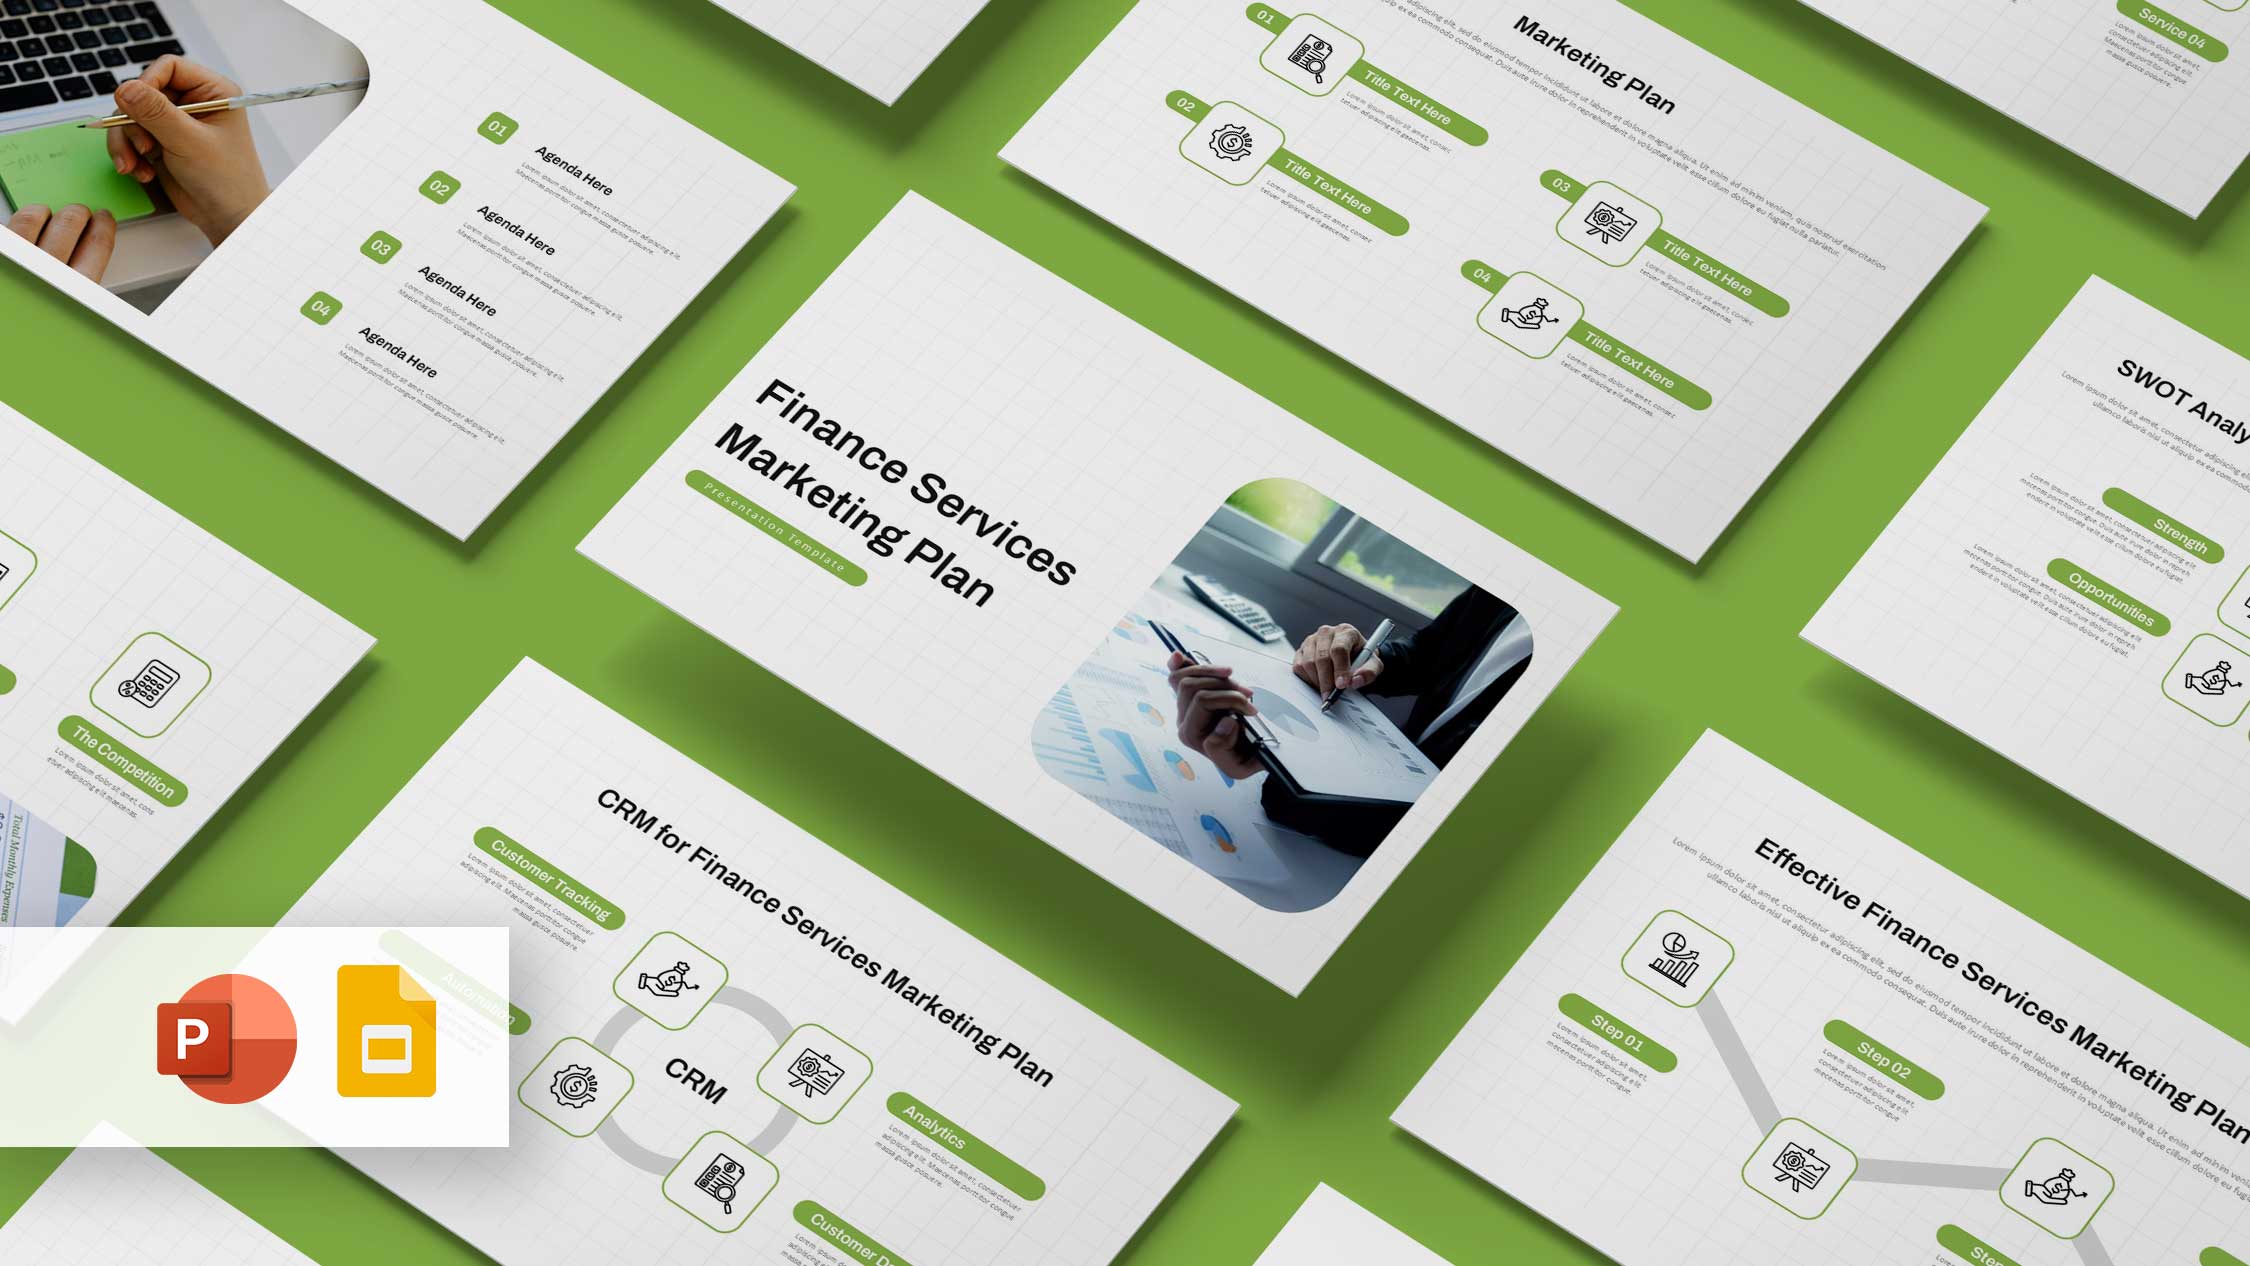
Fully customizable in both PowerPoint and Google Slides, this template allows you to edit figures, update labels, and adjust the visual style to match your brand. It’s ideal for use in quarterly reviews, annual planning sessions, board meetings, or investor updates where financial transparency and foresight are critical.
See more

Aspect Ratio
16:9Item ID
SKT03572
Features of this template
Other User Cases of the Template:
Monthly cash flow reporting, budget planning presentations, financial health assessments, investor pitch decks, CFO board reports, business performance reviews, strategic reinvestment planning, liquidity management, financial planning & analysis (FP&A), revenue forecasting models
FAQs
You May Also Like These Presentation Templates


- Free

- Free

- Free
- Free

- Free

- Free


- Free
- Free