Business Trend Radar Chart PowerPoint and Google Slides Template
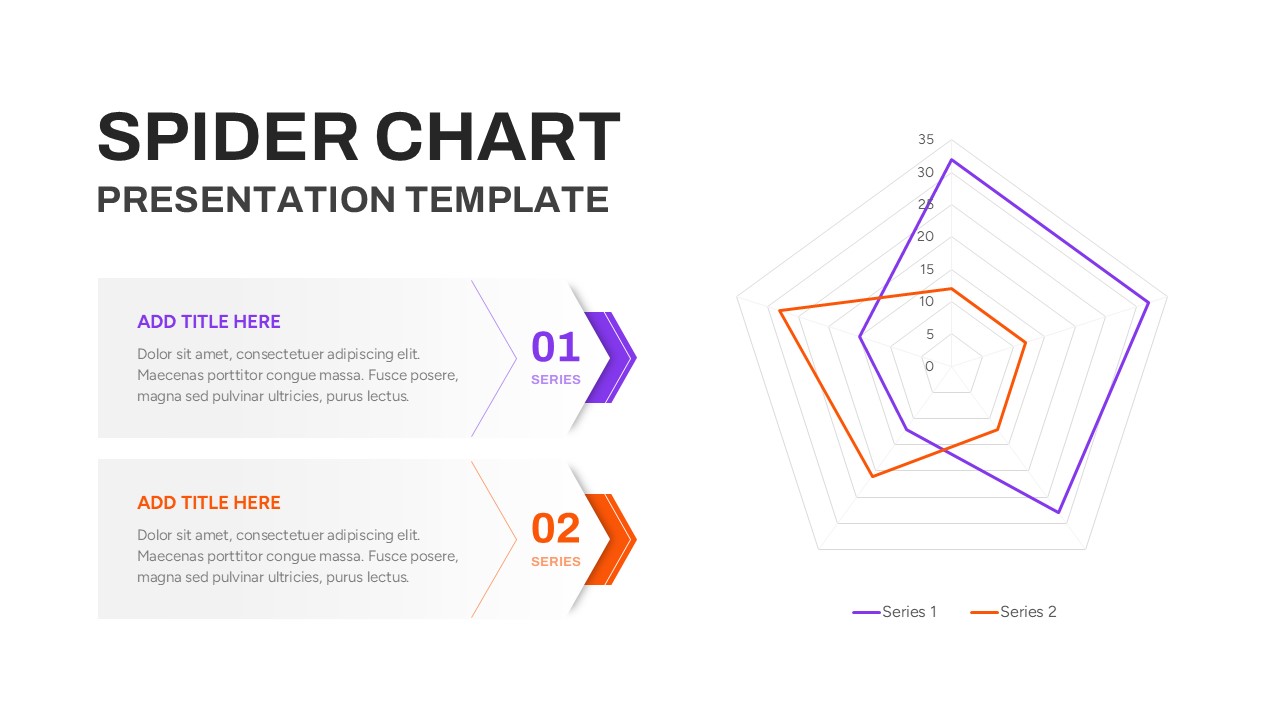
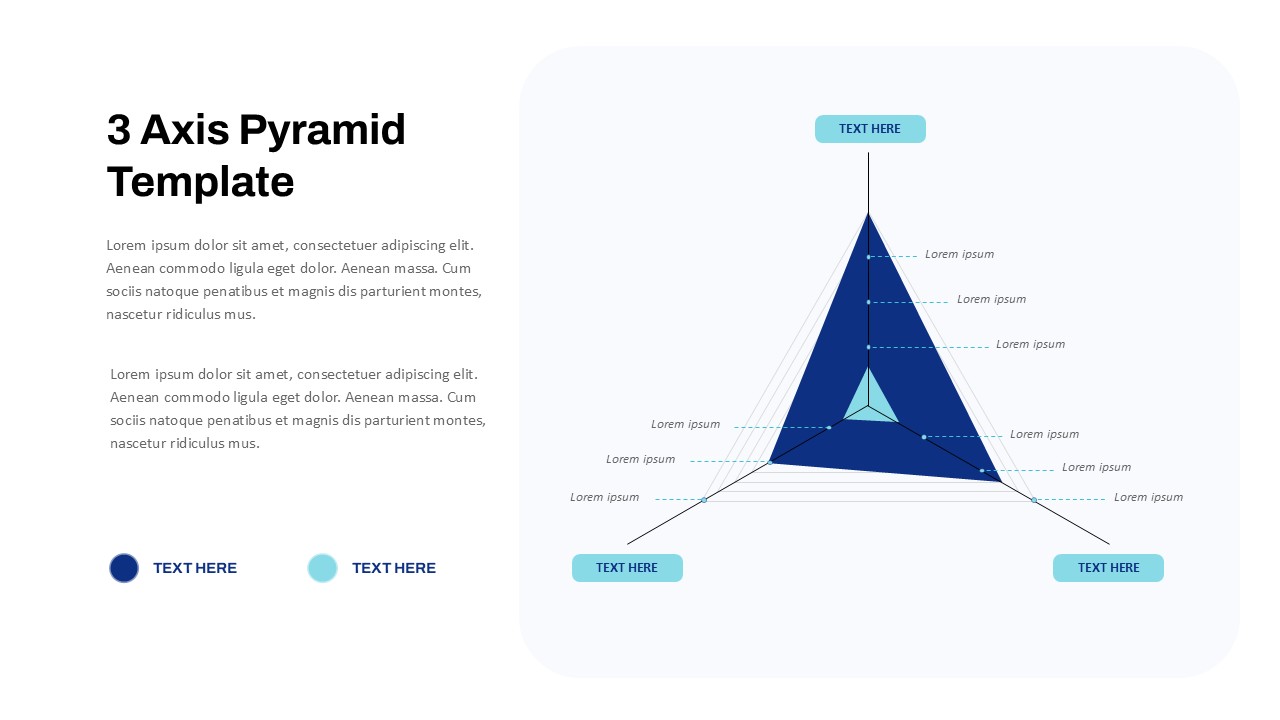
The Business Trend Radar Chart Template is a dynamic and visually striking tool for presenting complex business trends in an easy-to-understand format. Available in both PowerPoint and Google Slides, this template is perfect for analyzing and comparing trends across various business areas such as economic, market, and technology trends. The radar chart layout provides a clear visual representation of trends, making it easy for decision-makers to understand and act on data.
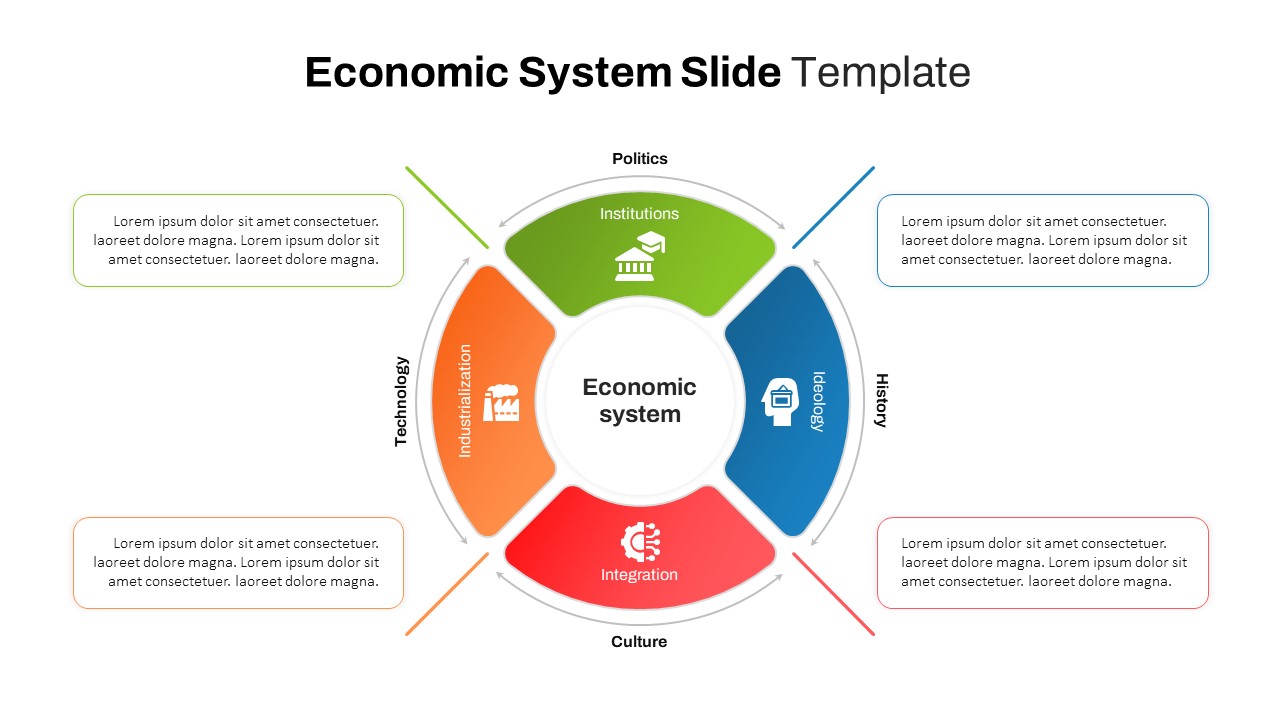
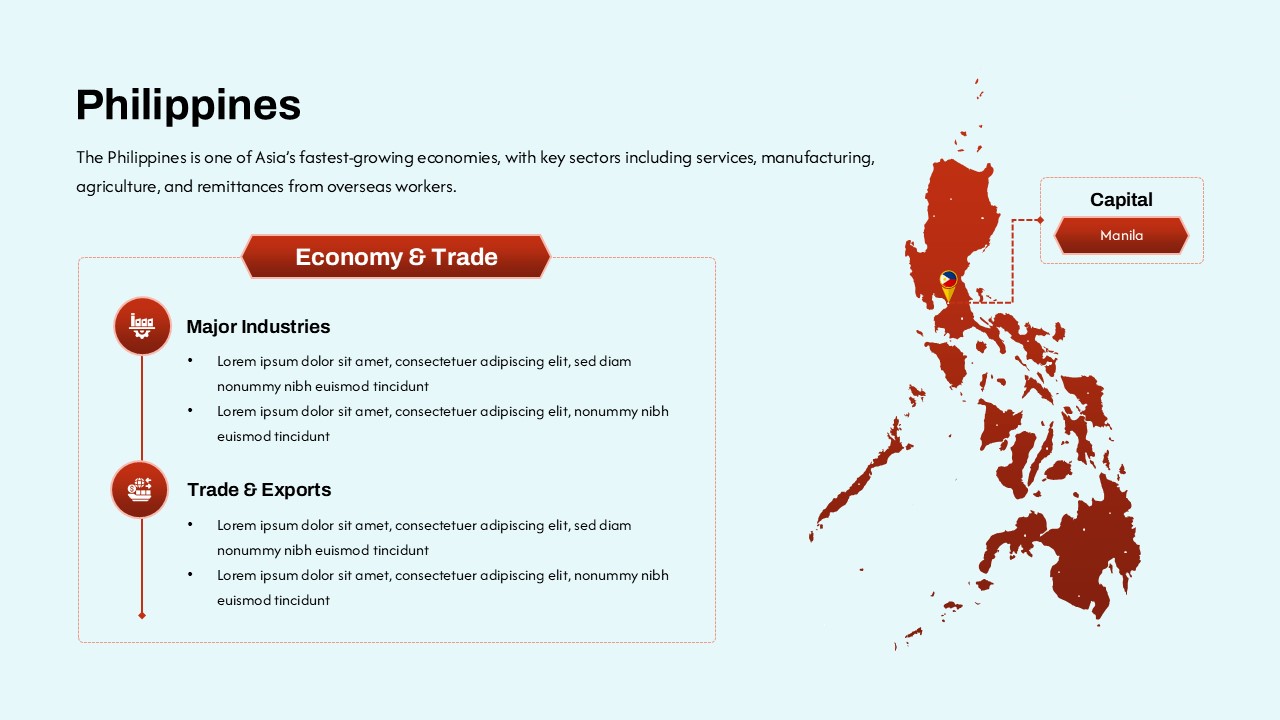
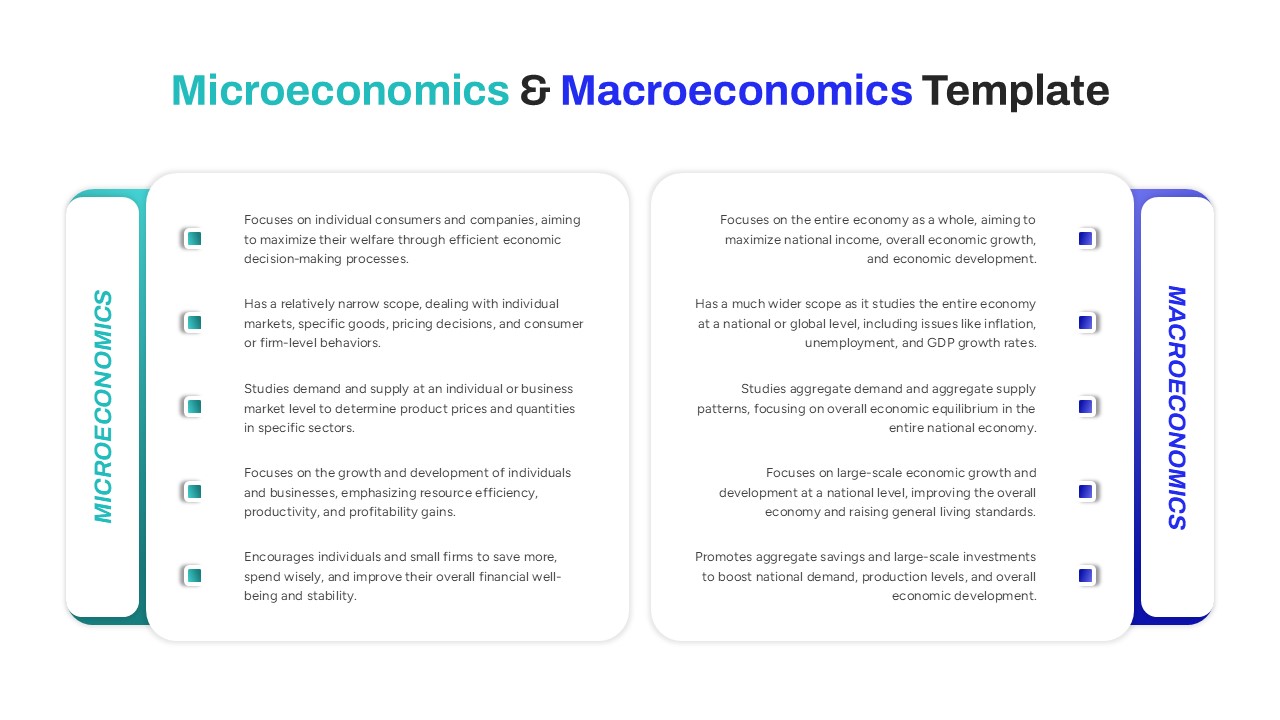
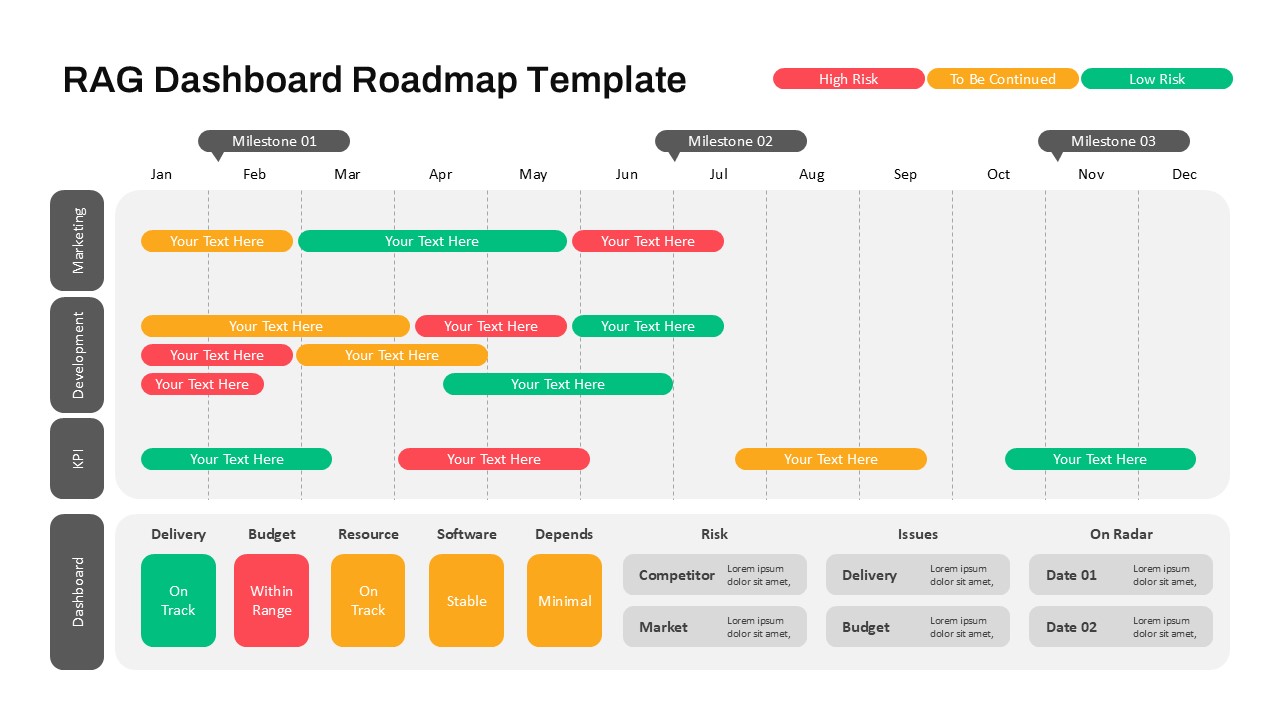
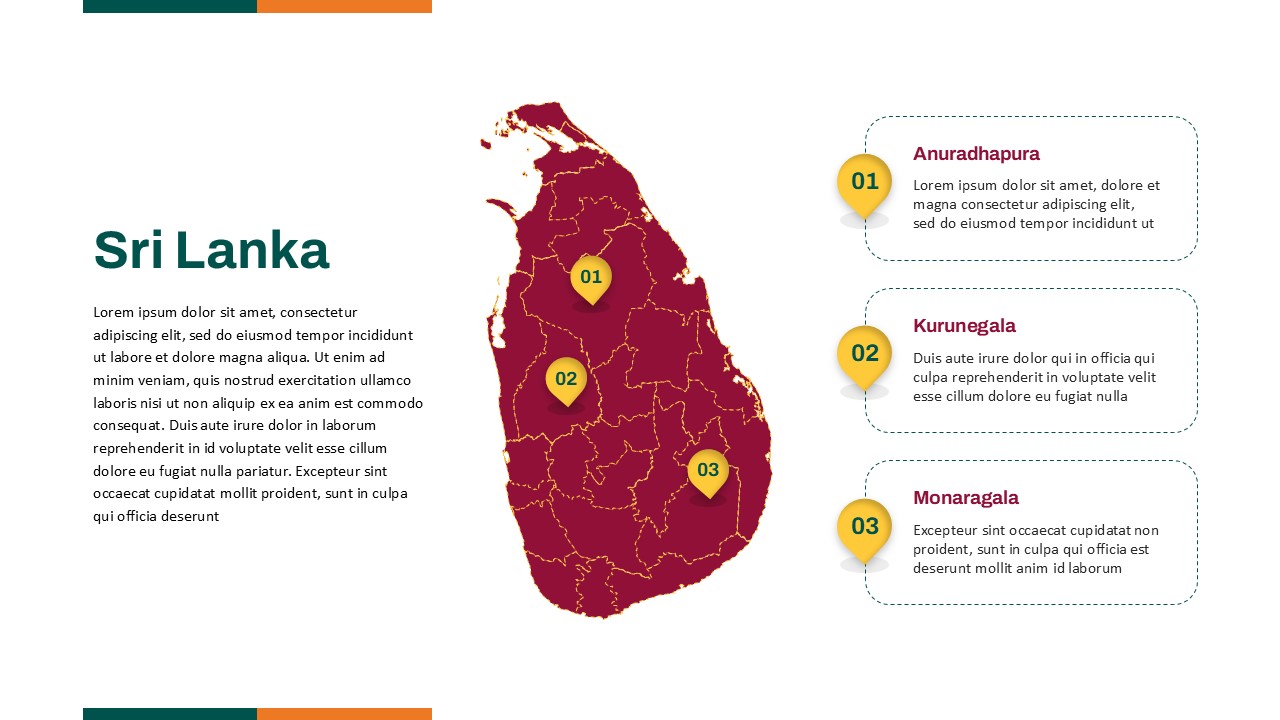
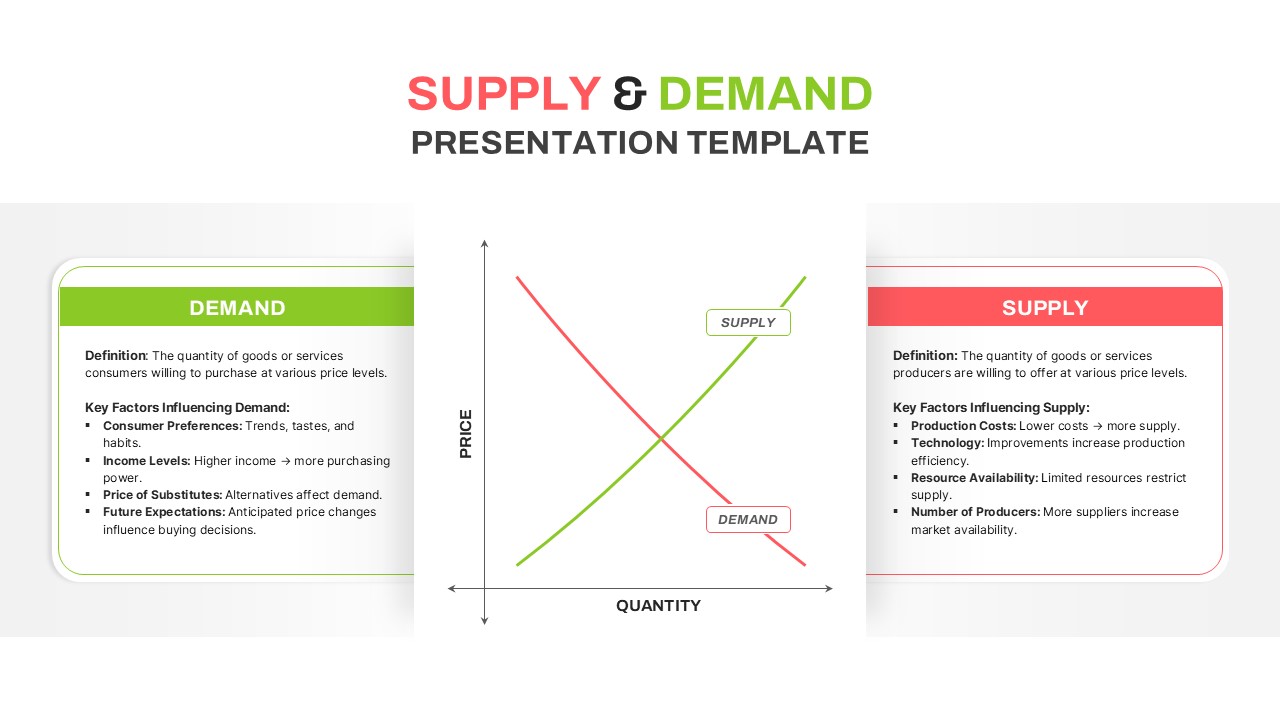
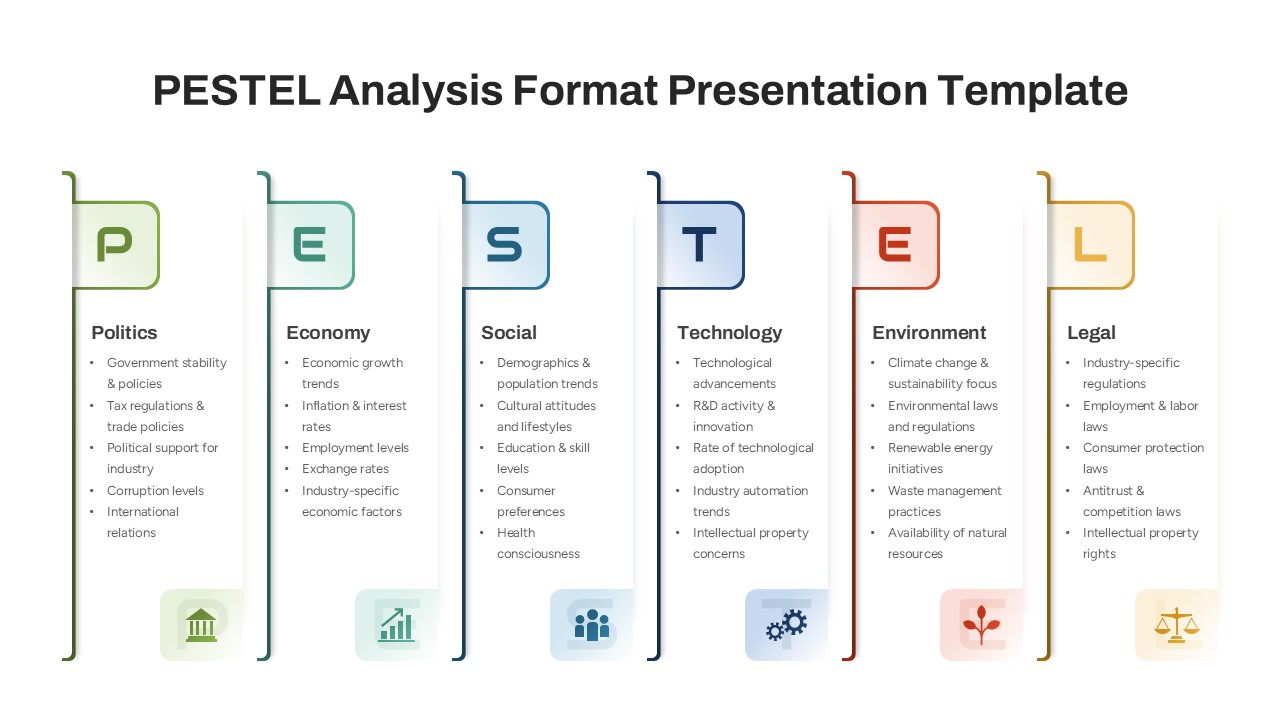
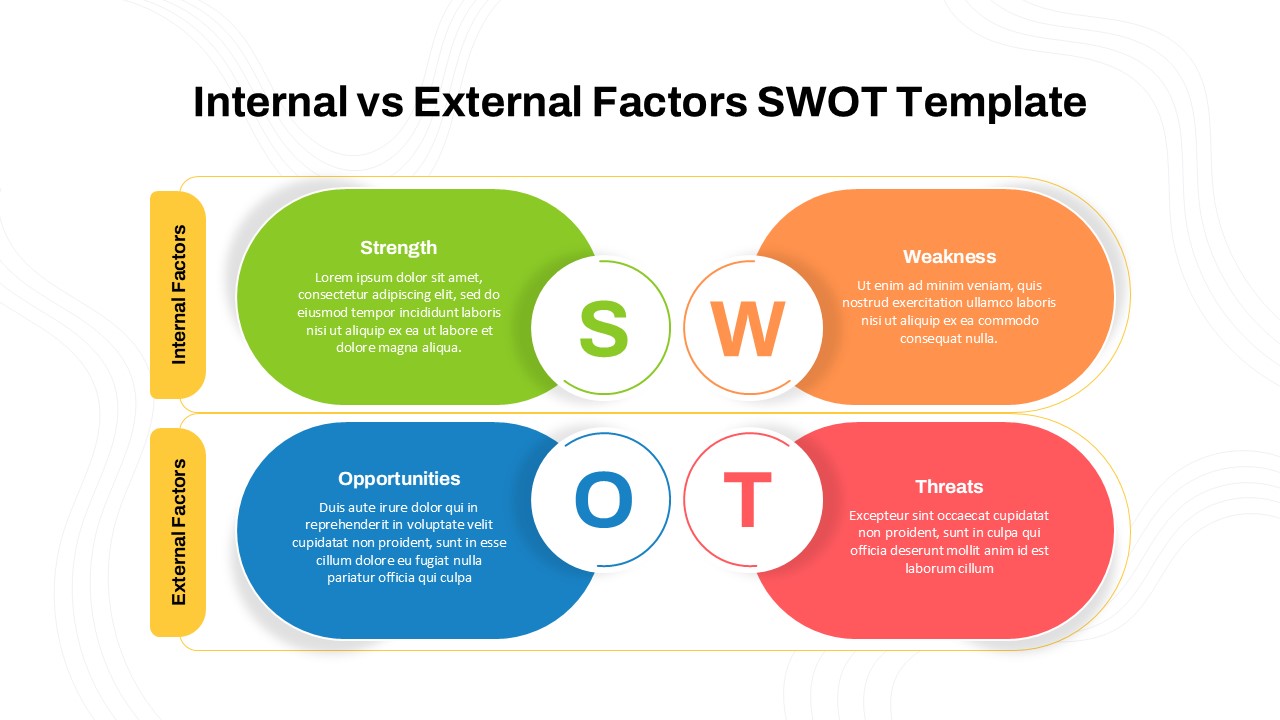
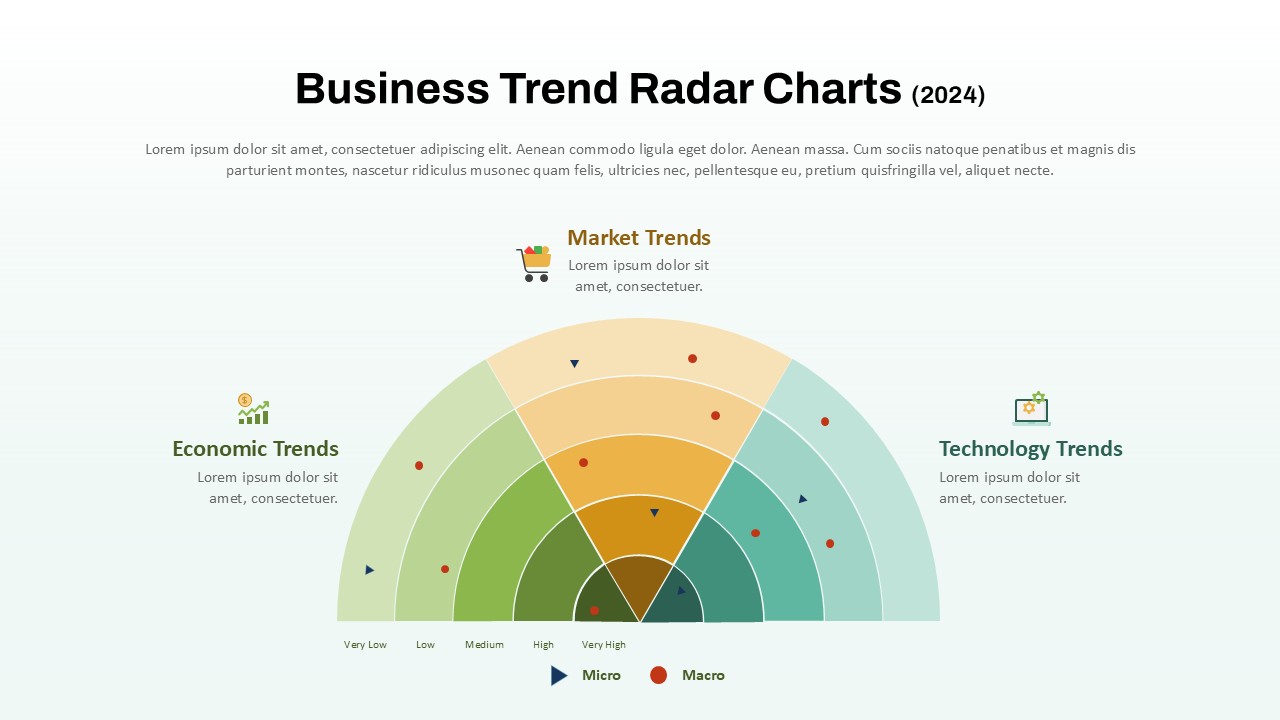
This template categorizes trends into Micro and Macro levels, allowing users to visualize trends on both small-scale and broad perspectives. The radar chart divides the data into distinct areas:
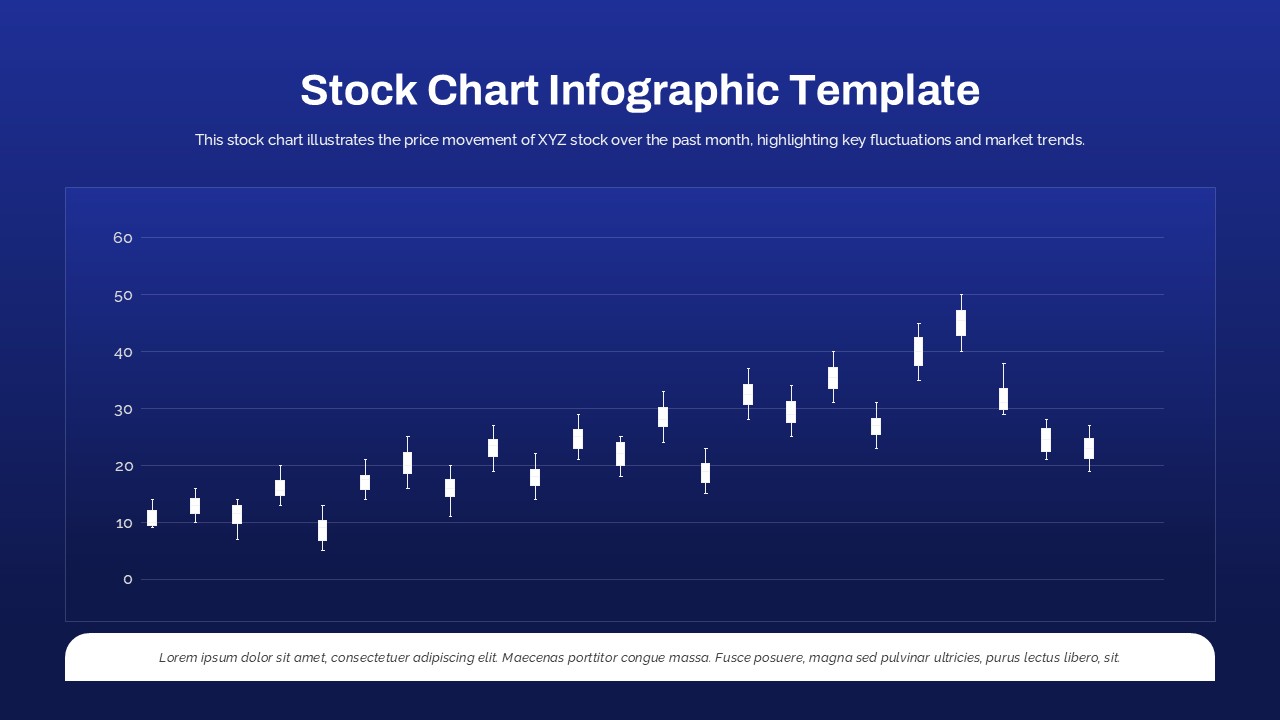
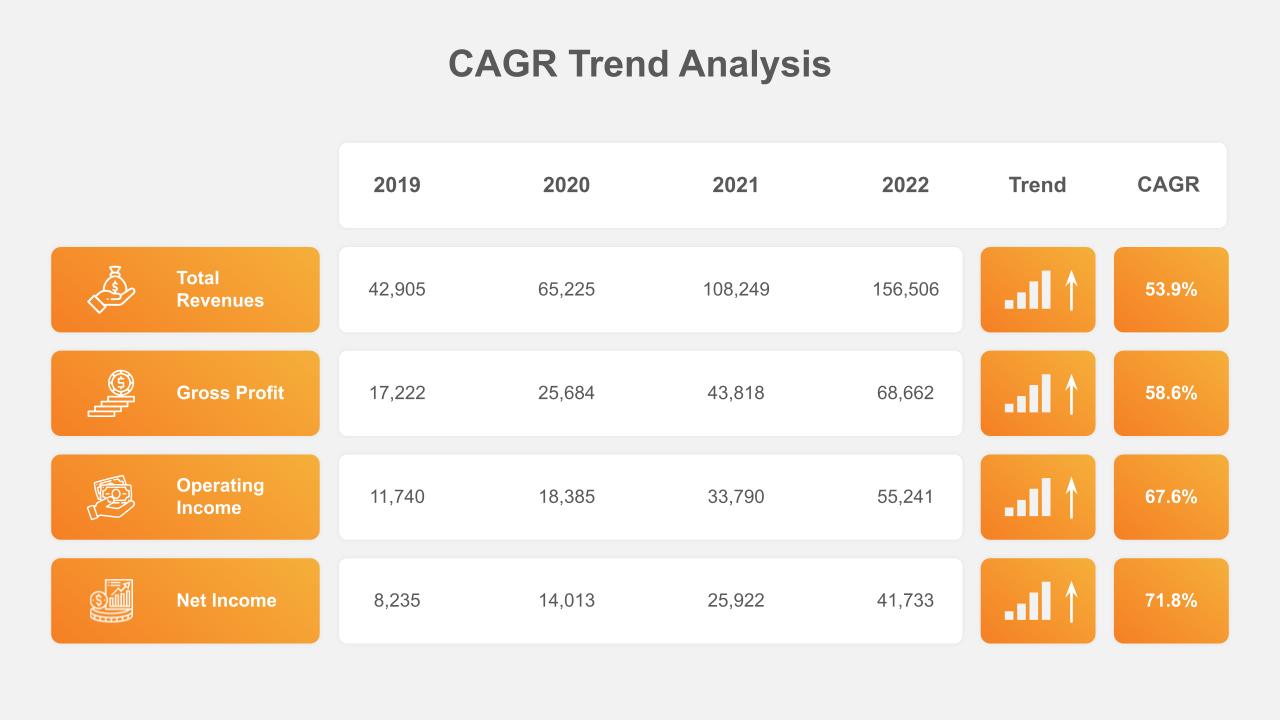
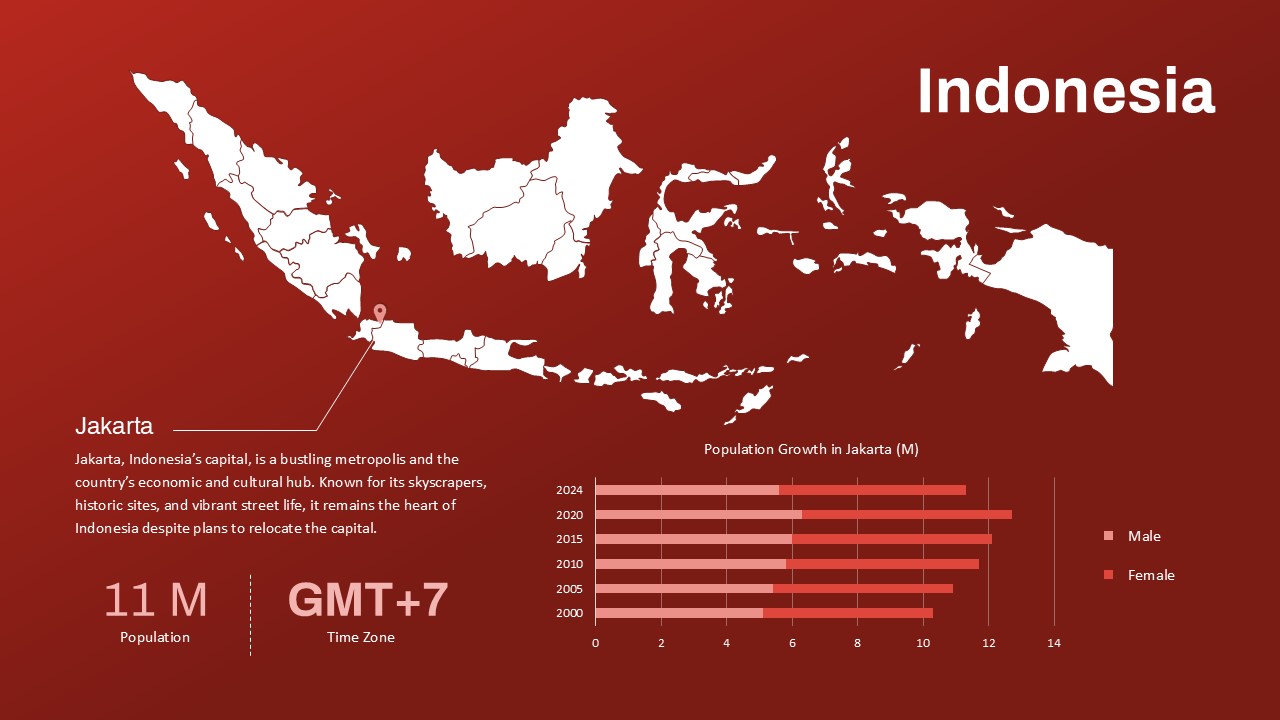
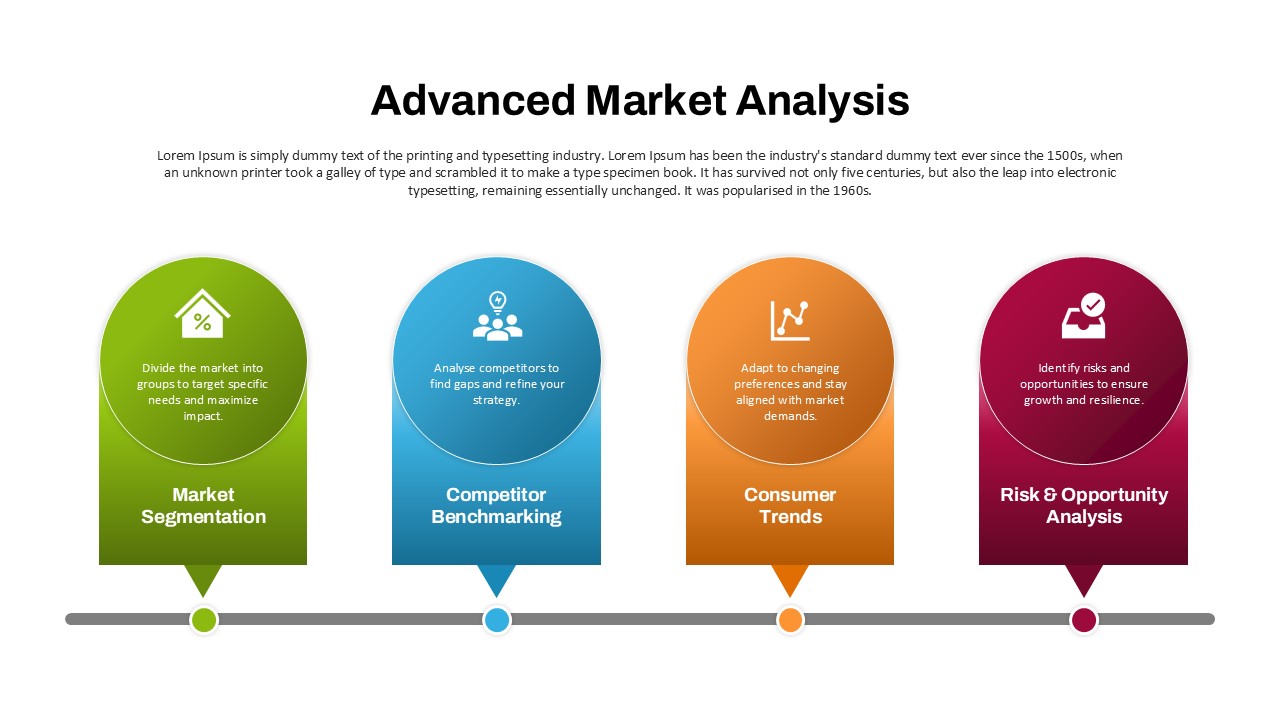
- Economic Trends: Analyze factors like growth, inflation, and market fluctuations.
- Market Trends: Track shifting customer behaviors, emerging opportunities, and competitive factors.
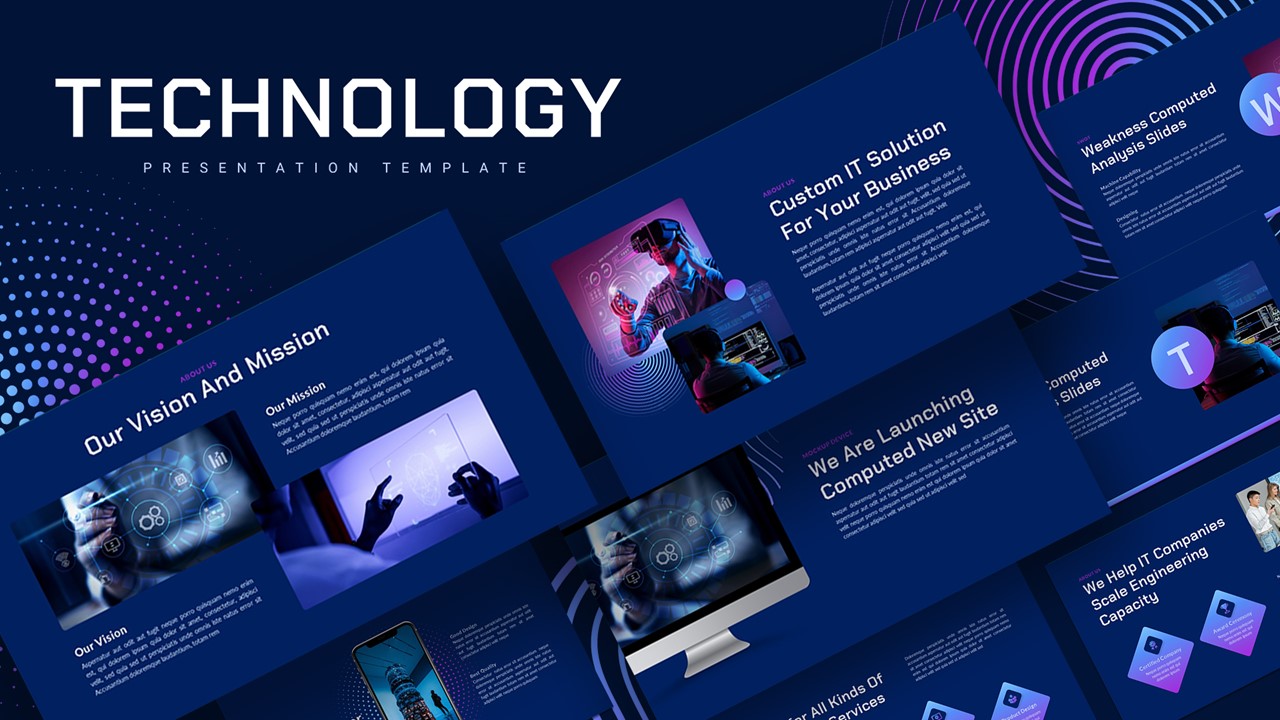
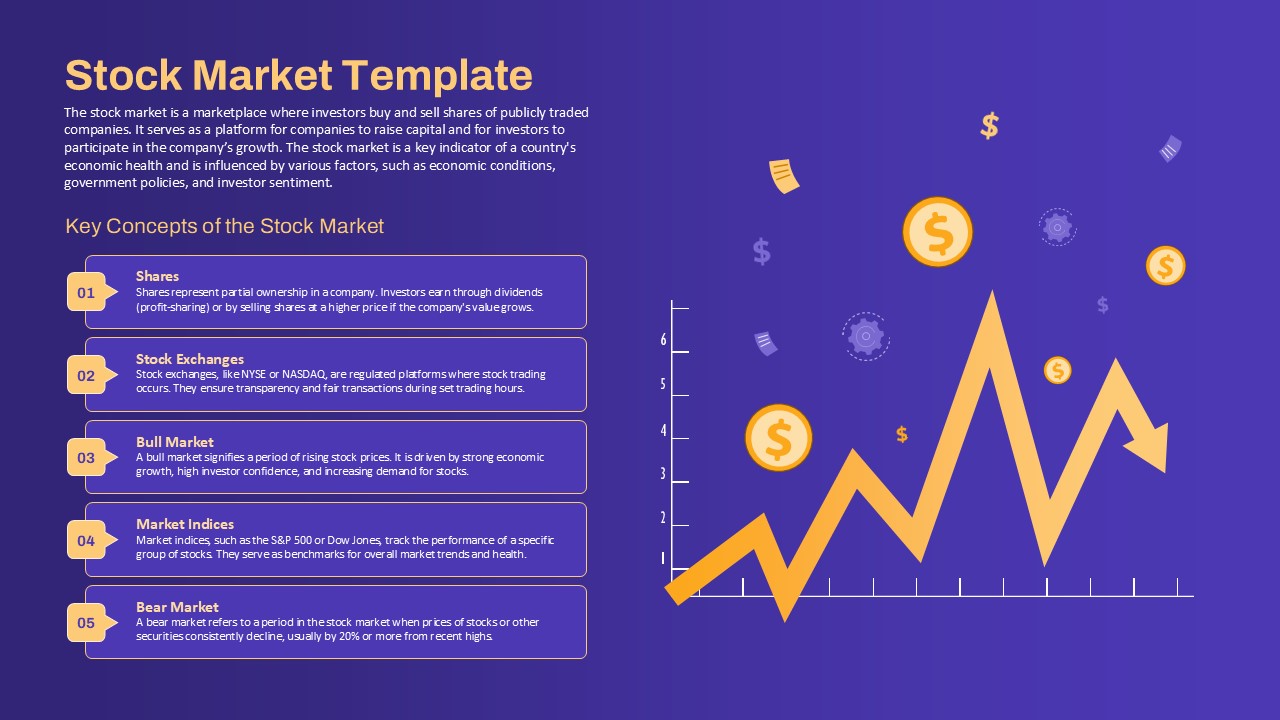
- Technology Trends: Evaluate the latest technological innovations, their adoption rates, and their potential impact on business.
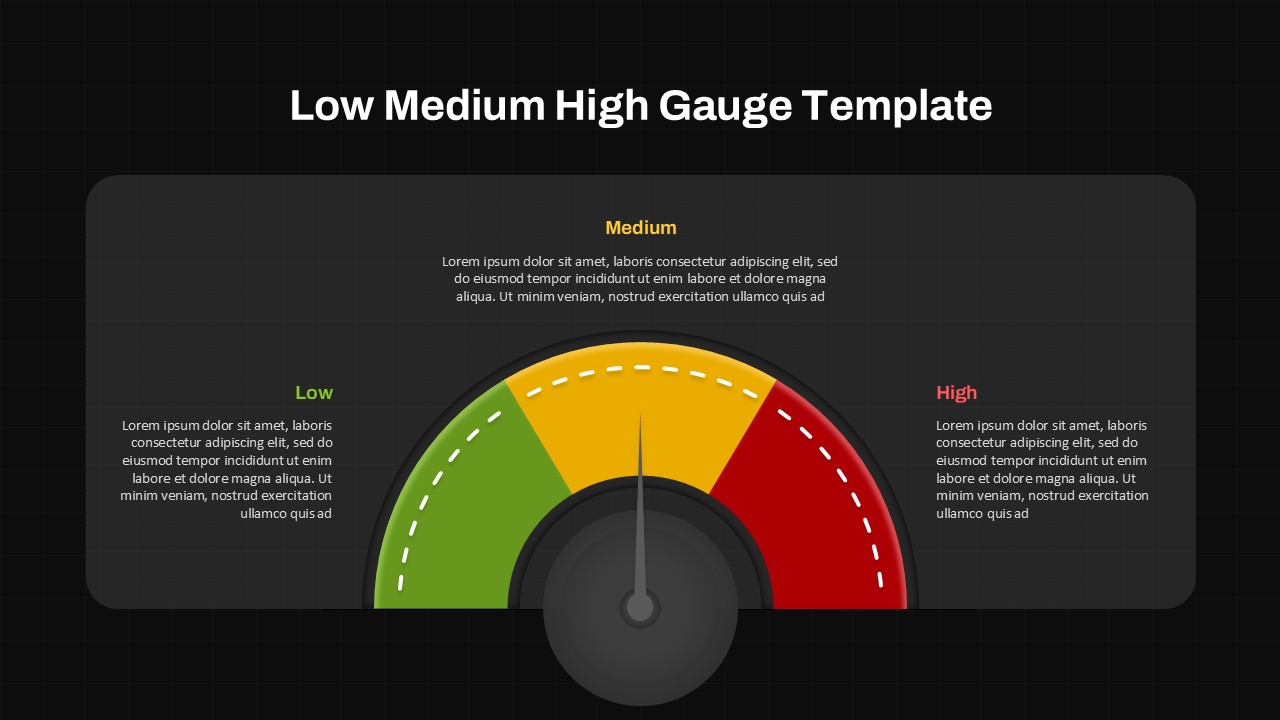
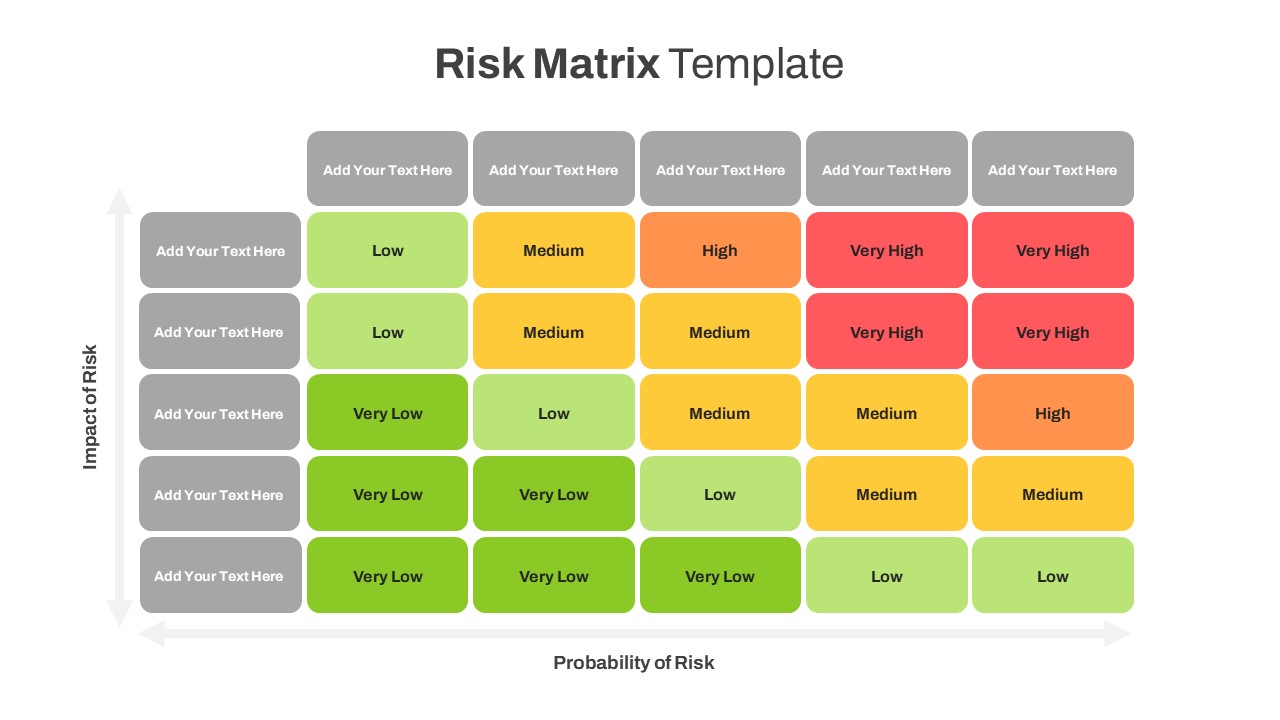
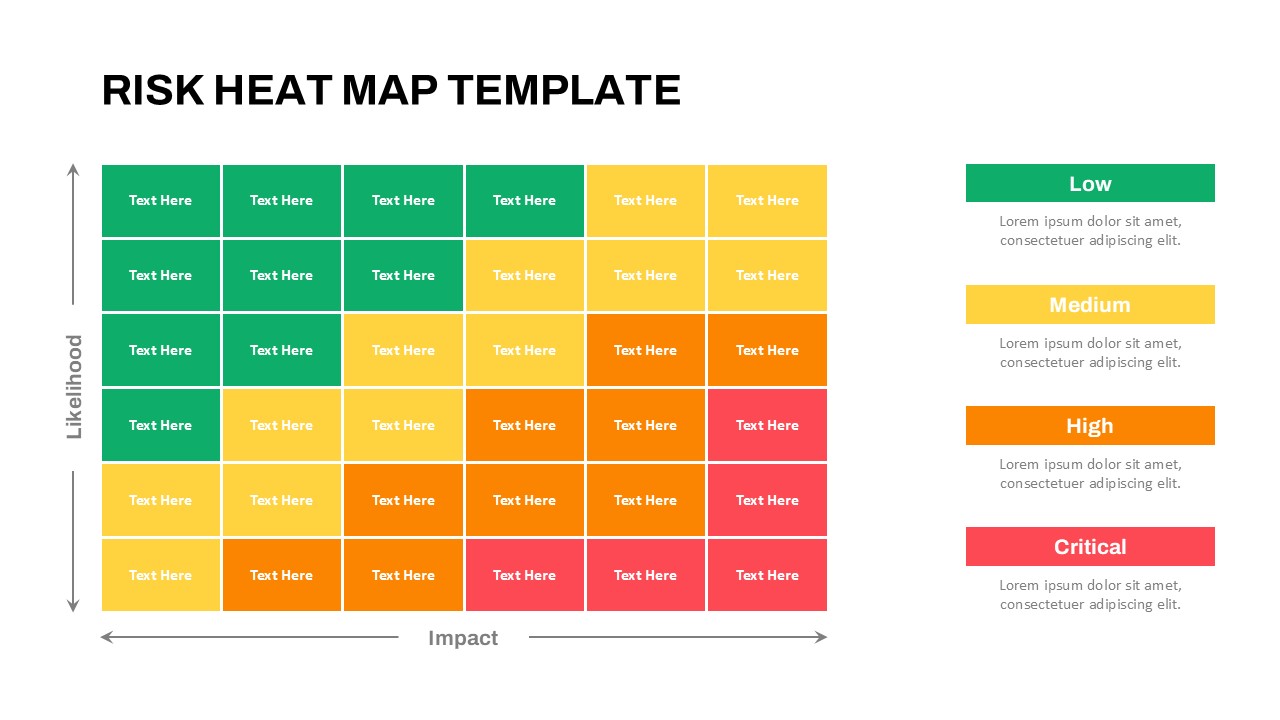
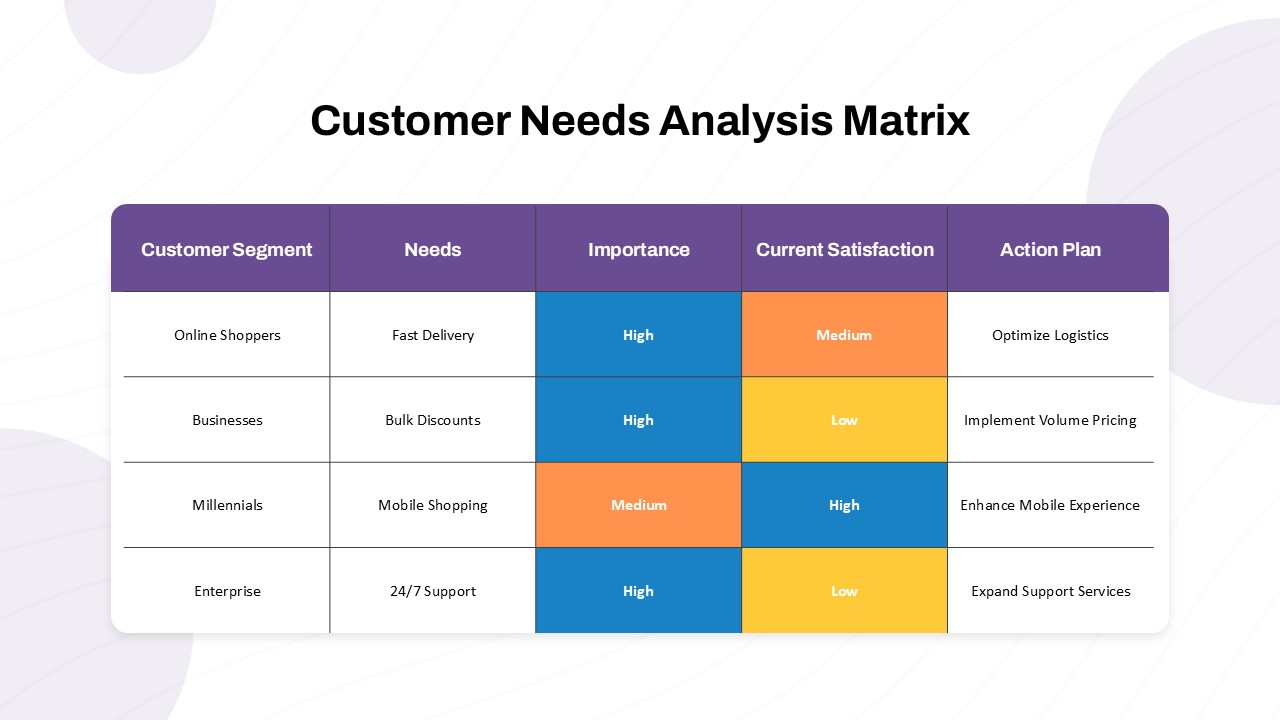
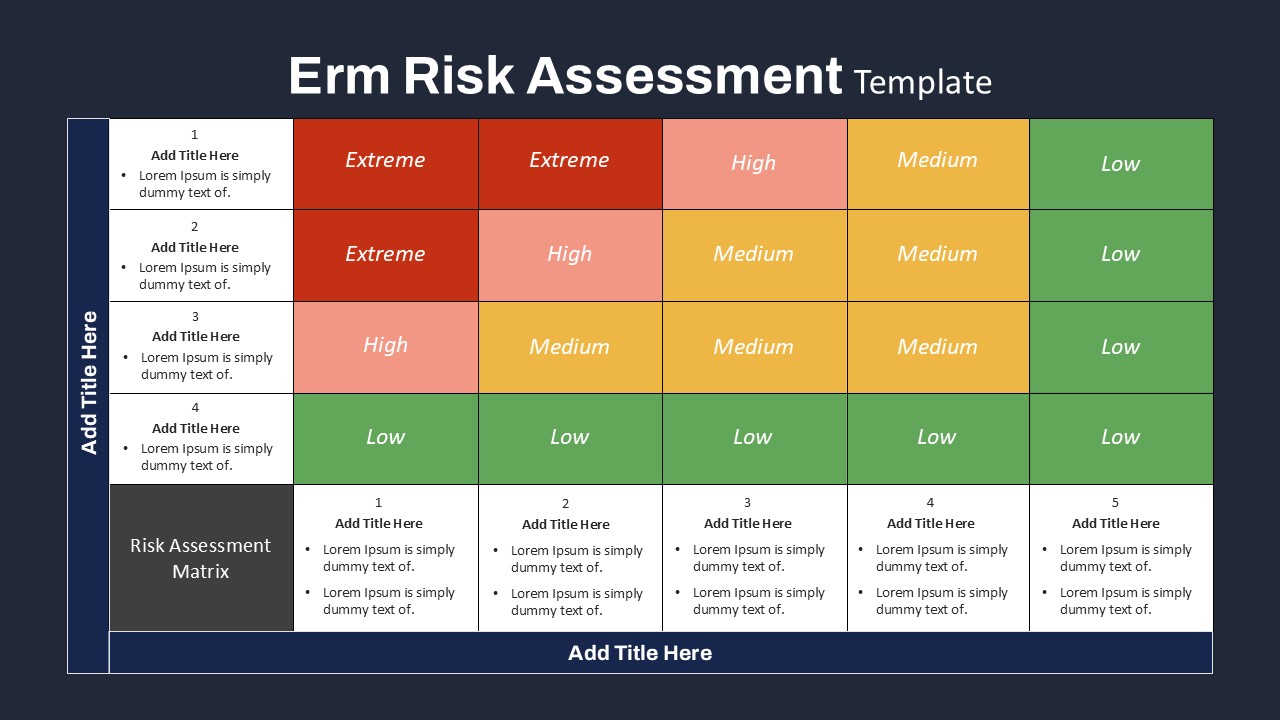
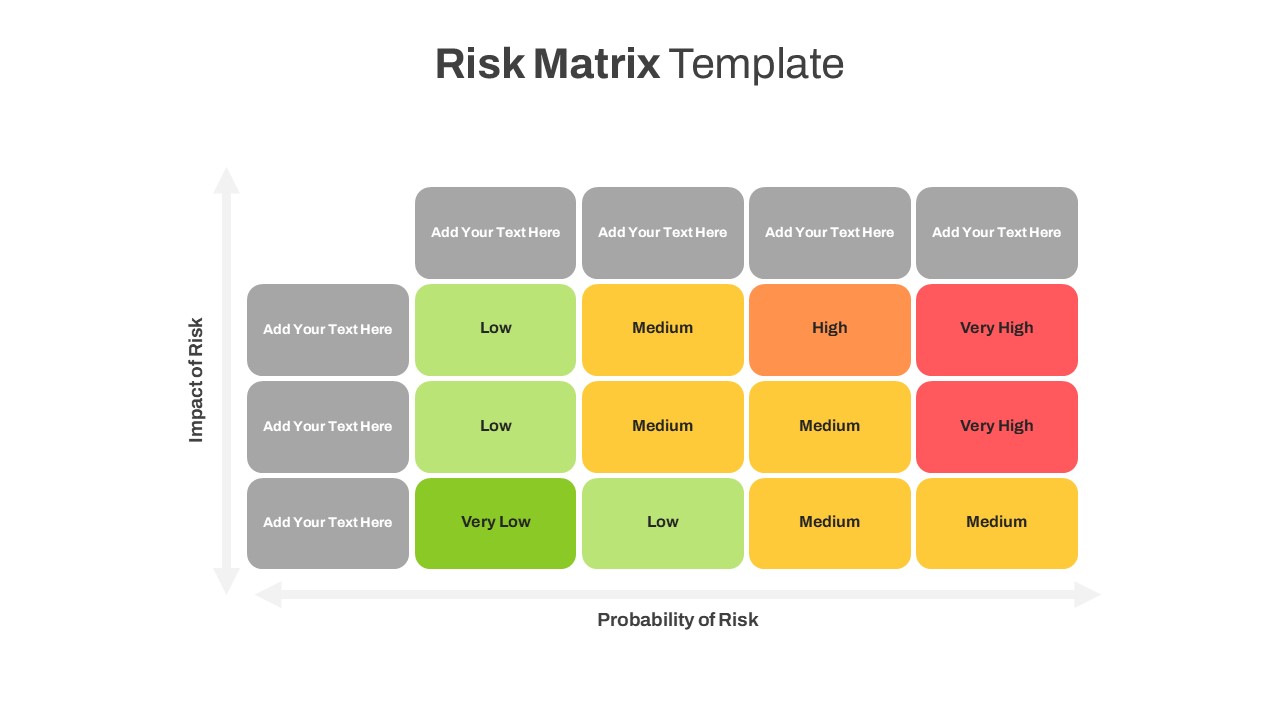
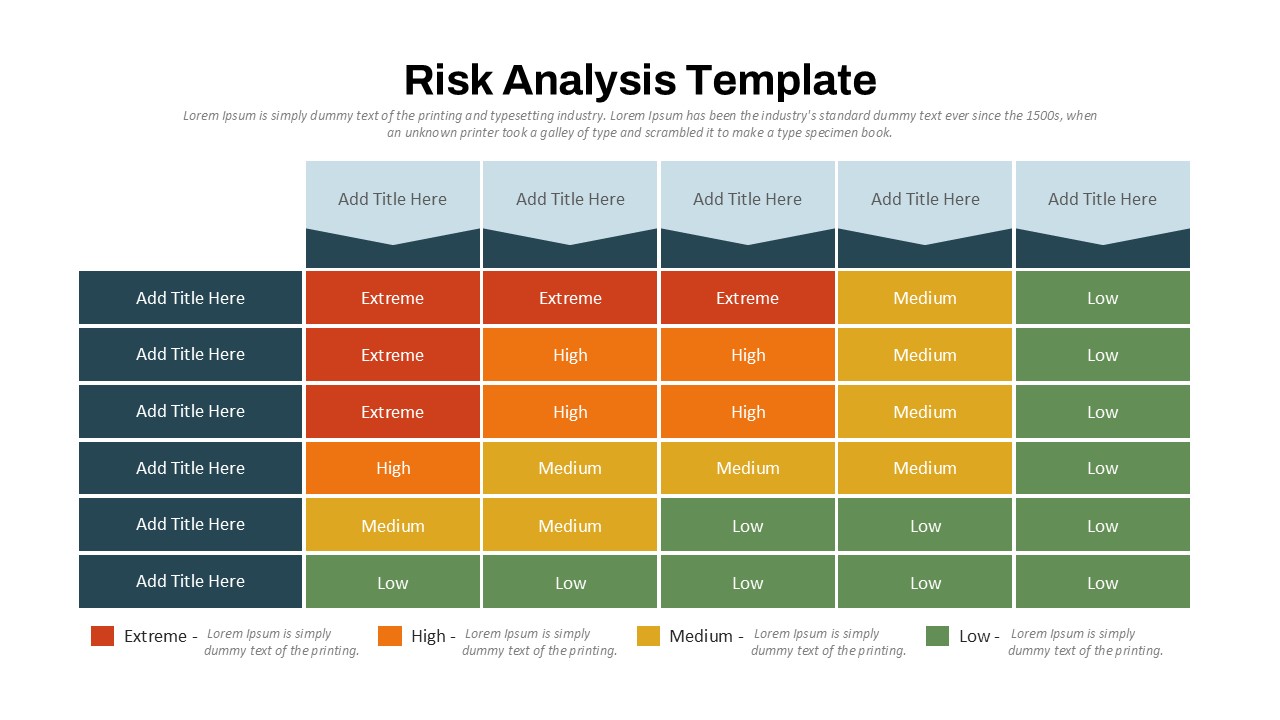
The chart uses a color-coded system to show trends at varying levels of significance (Very Low, Low, Medium, High, Very High), helping users quickly identify key trends that need attention. This Business Trend Radar Chart PowerPoint template is ideal for presenting a comprehensive business analysis in strategy meetings, investor presentations, and market research discussions.
By using this business trend radar chart PowerPoint template, you can present trends with clarity, allowing your team and stakeholders to make informed decisions based on data and projections for the future.
See more

Aspect Ratio
16:9Item ID
SKT03788
Features of this template
Other User Cases of the Template
Business trend analysis, market research, economic forecasting, technology adoption tracking, strategic planning, competitive analysis, product development insights, industry trend analysis, data visualization for presentations, market forecasting
FAQs
You May Also Like These Presentation Templates


- Free
- Free


- Free
- Free

- Free
- Free
- Free
- Free
- Free
- Free