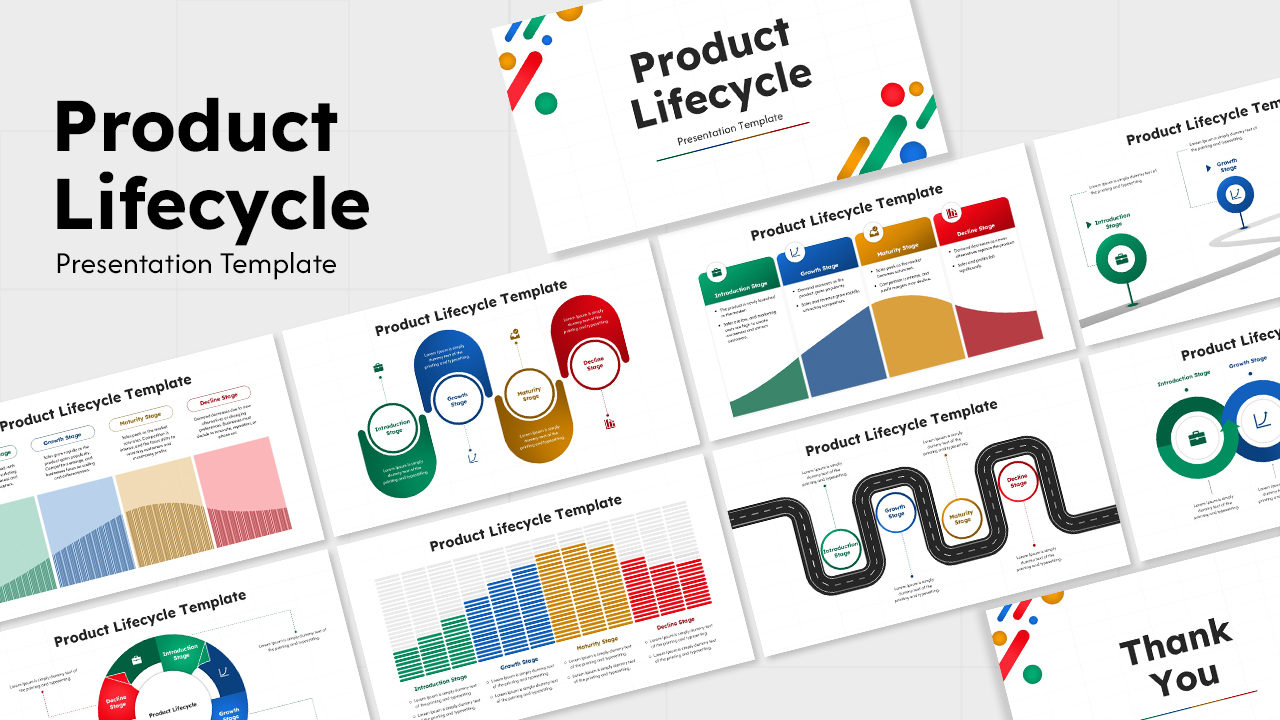
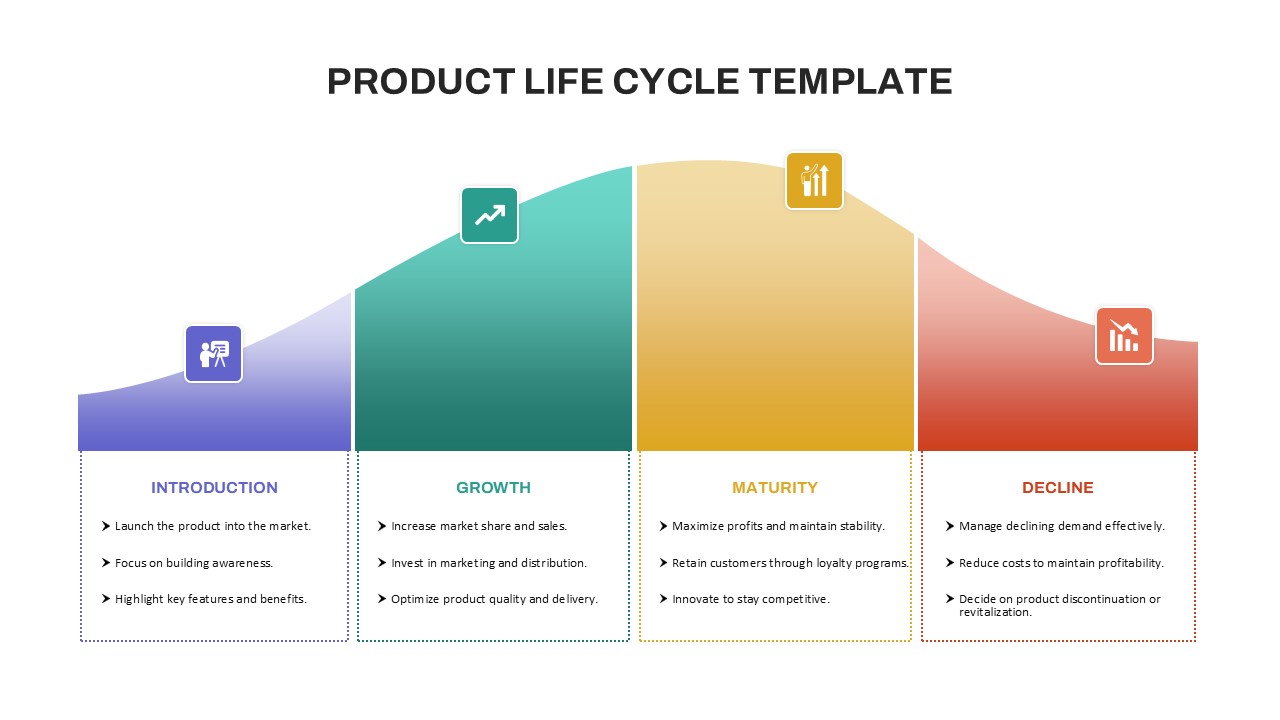
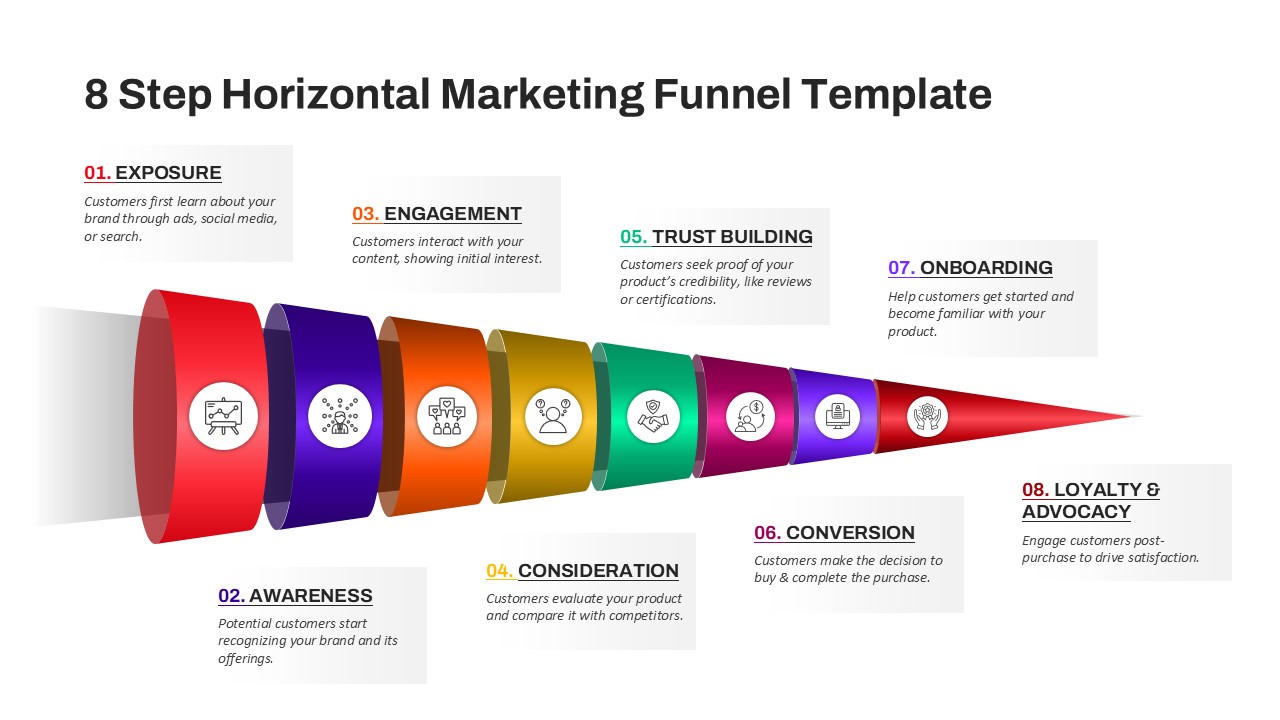
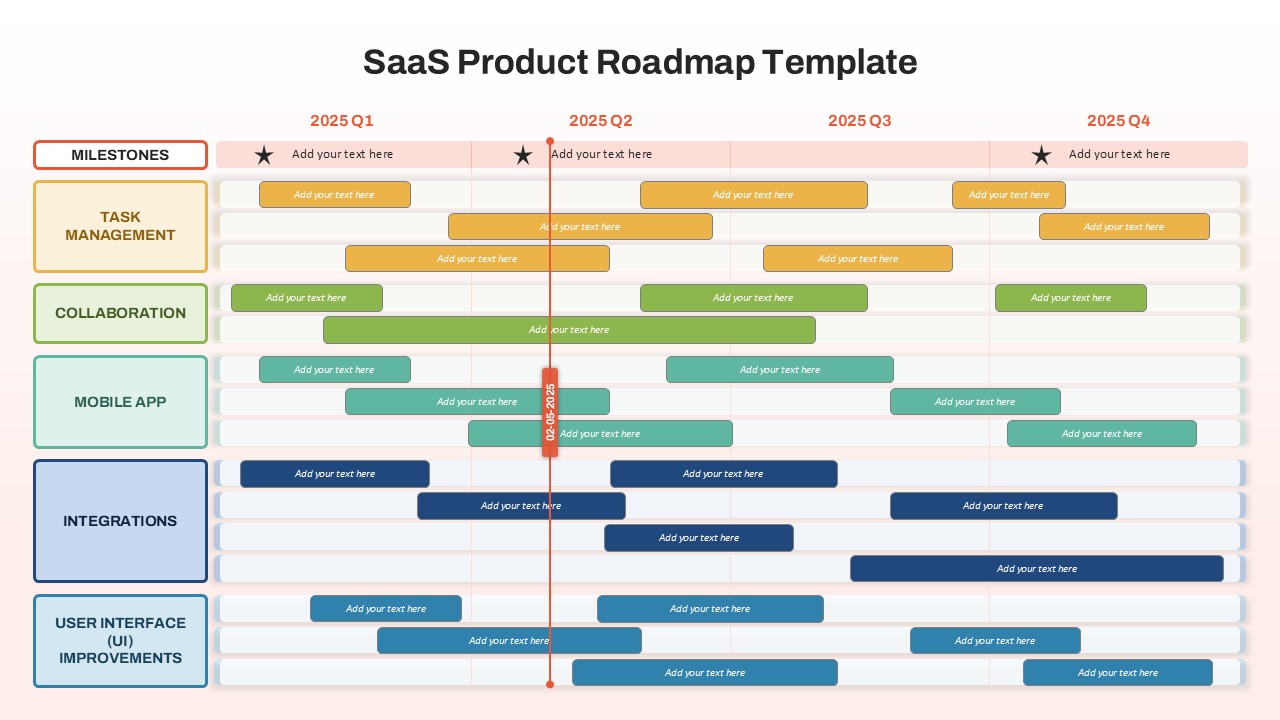
Product Adoption Curve Template for PowerPoint & Google Slides
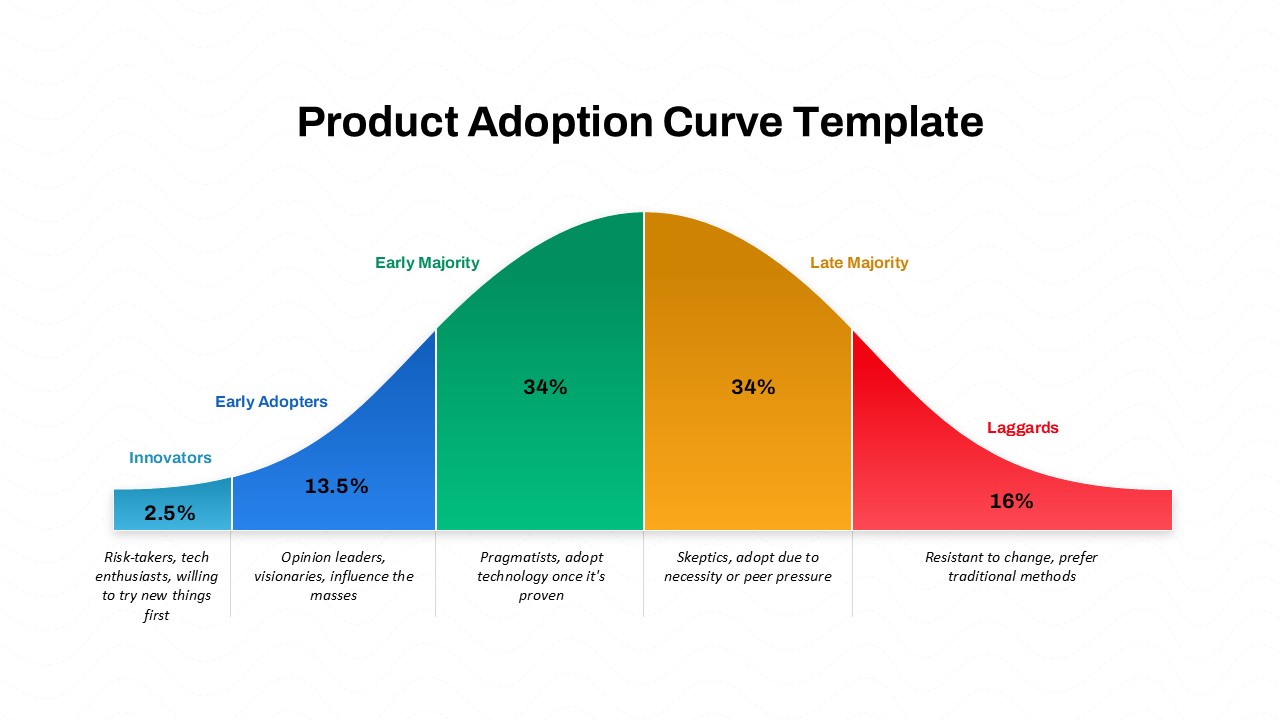
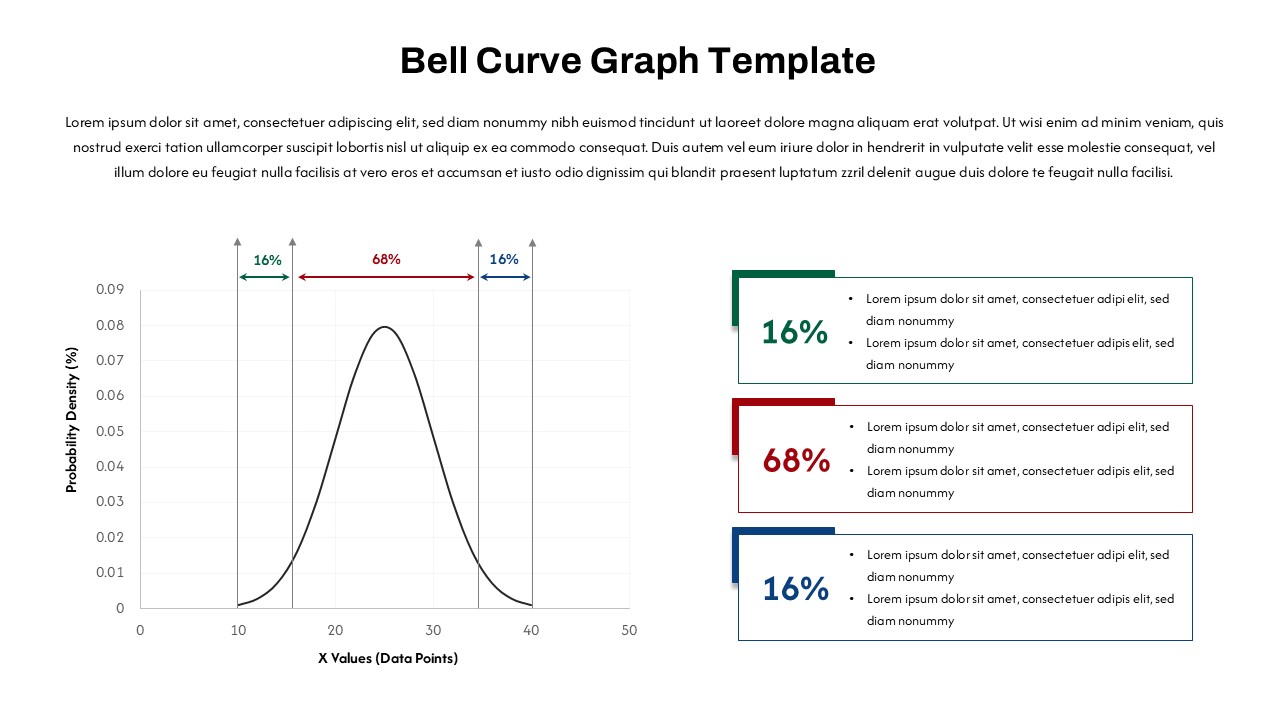
Visualize how customers adopt new products over time with this clear and engaging Product Adoption Curve PowerPoint Template designed for PowerPoint and Google Slides. This template breaks down the market into distinct segments—Innovators, Early Adopters, Early Majority, Late Majority, and Laggards—each representing different customer behaviors and adoption rates.
Perfect for marketers, product managers, and business strategists, the template highlights the percentage and characteristics of each adopter group. It clearly communicates the diffusion of innovation theory, helping teams understand where to focus marketing efforts and tailor messaging to each segment.
Key Features:
- Segmented Curve Design: Color-coded and labeled adopter categories for intuitive understanding
- Percentage Breakdown: Displays the size of each group (from 2.5% Innovators to 16% Laggards)
- Customer Profiles: Descriptions of behavioral traits for each segment enhance strategic insights
- Fully Editable: Customize colors, text, and layout to match your brand or presentation needs
- Ideal for: Product launches, market analysis, customer segmentation, and innovation strategy sessions
Use this template to explain product lifecycle stages clearly, align your marketing and sales strategies with adoption patterns, and drive better business decisions based on customer behavior.
See more

Aspect Ratio
16:9Item ID
SKT03617
Features of this template
Other User Cases of the Template:
product lifecycle presentations, technology adoption analysis, market segmentation, customer behavior studies, innovation strategy meetings, marketing campaign planning, sales training sessions, business development strategies, new product launch briefings, customer education programs
FAQs
You May Also Like These Presentation Templates

- Free


- Free
- Free
- Free
- Free
- Free