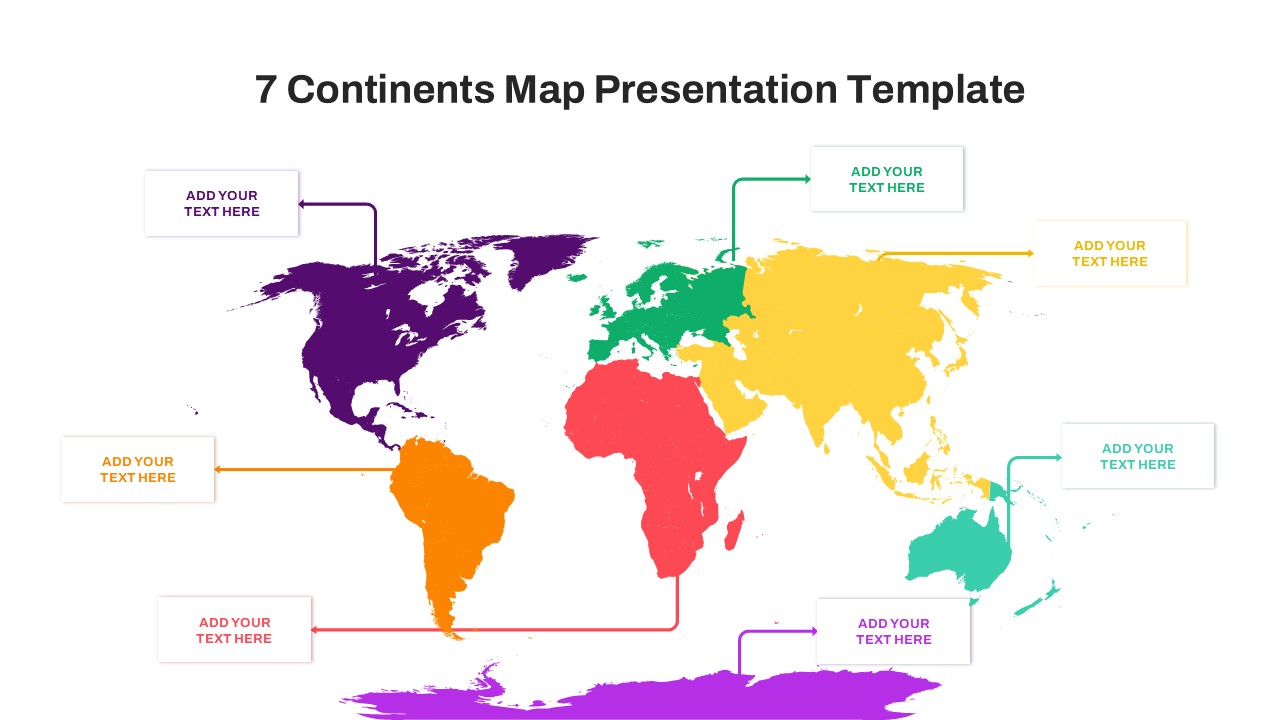
Malawi Map with District Rainfall Analysis Template for PowerPoint & Google Slides
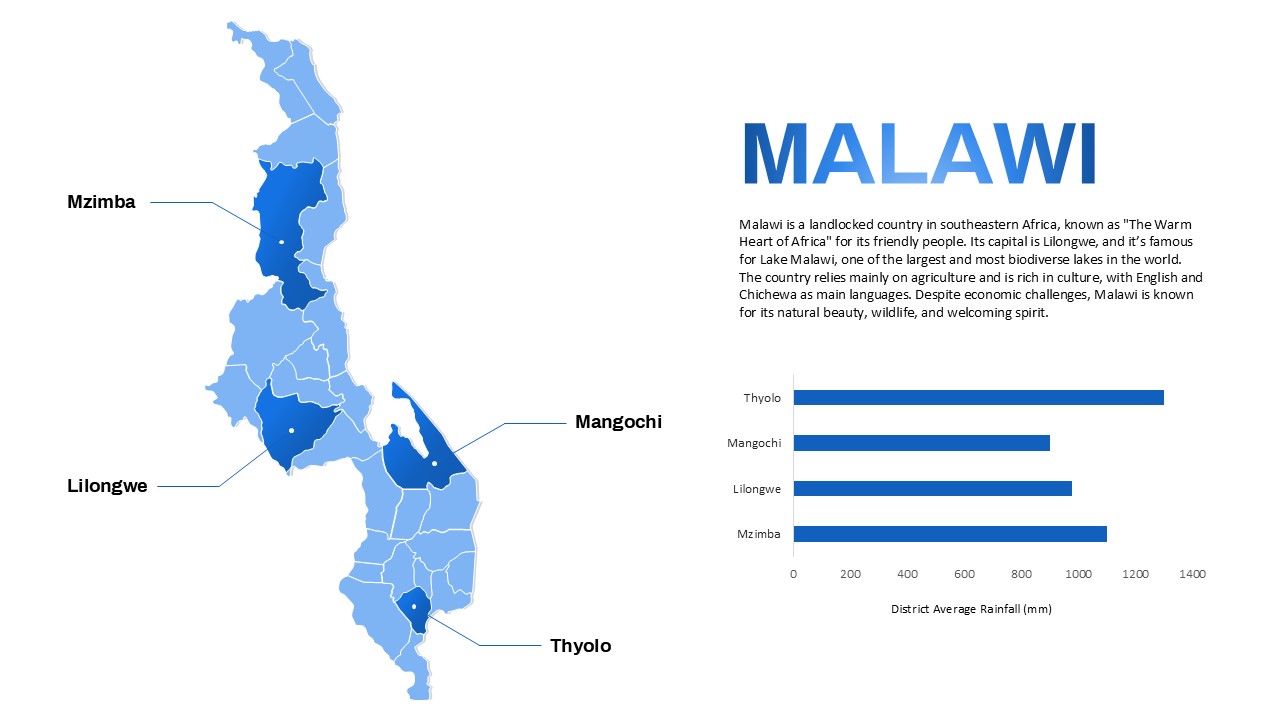
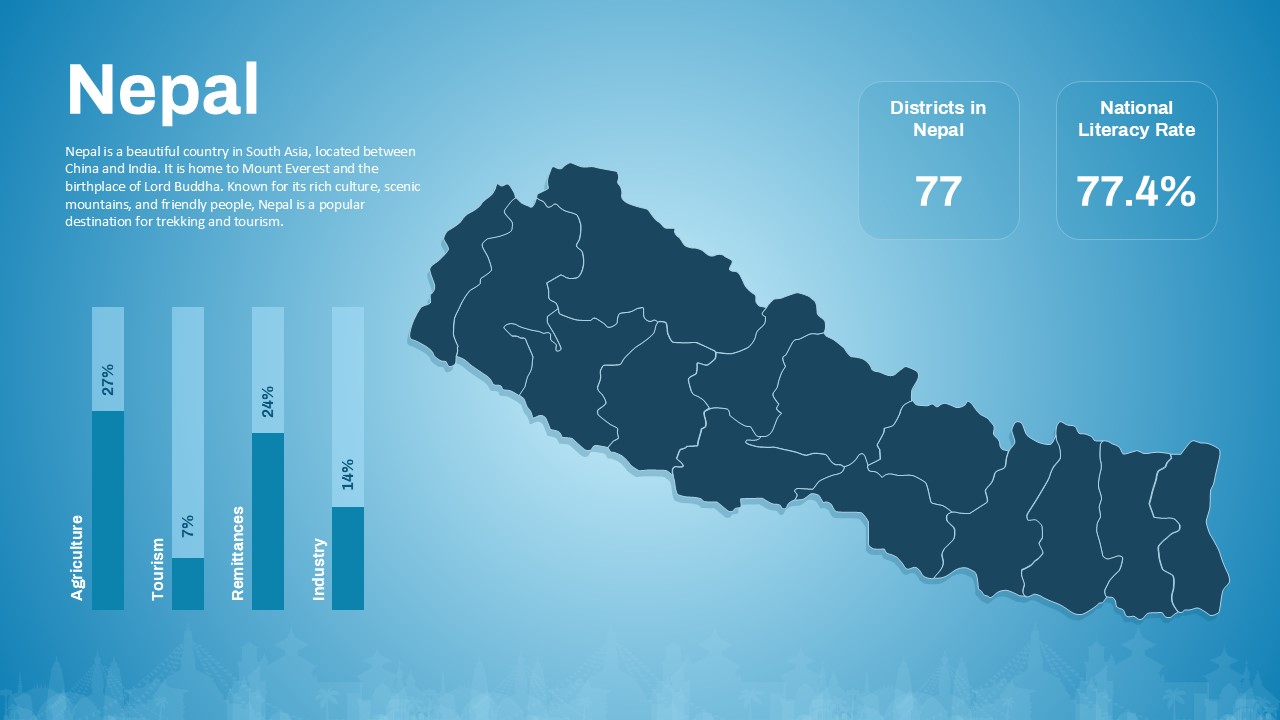
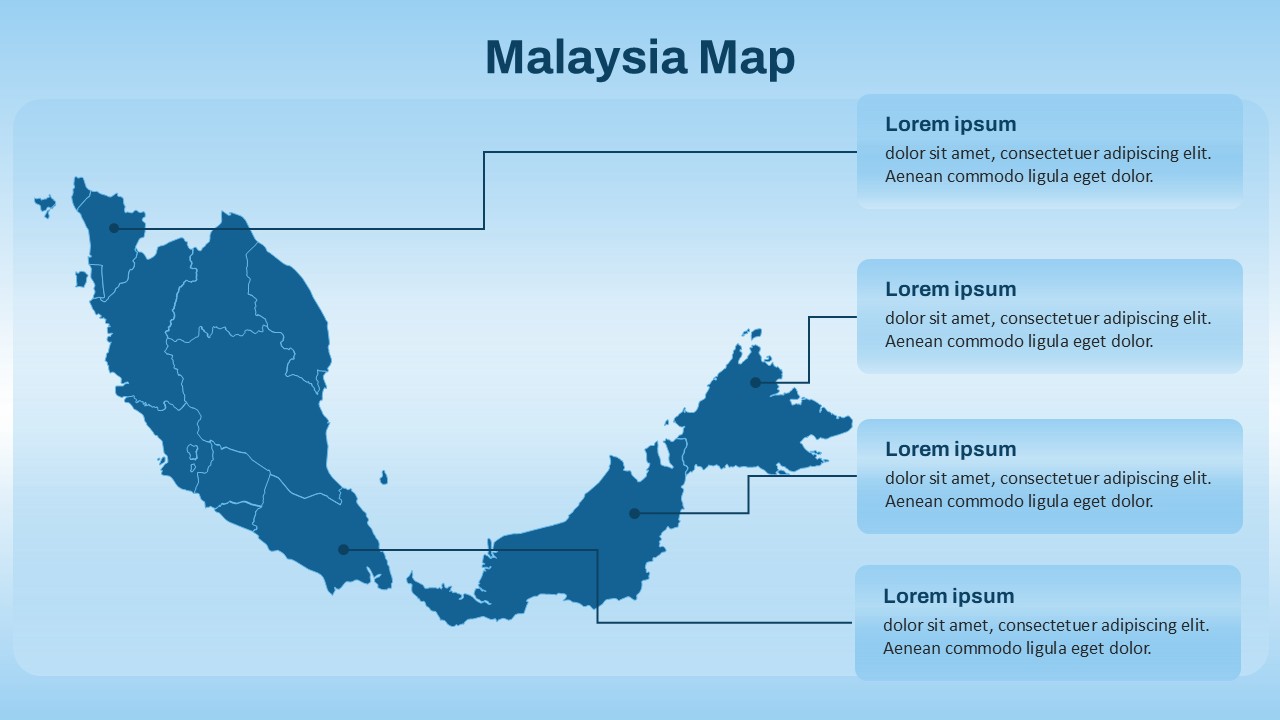
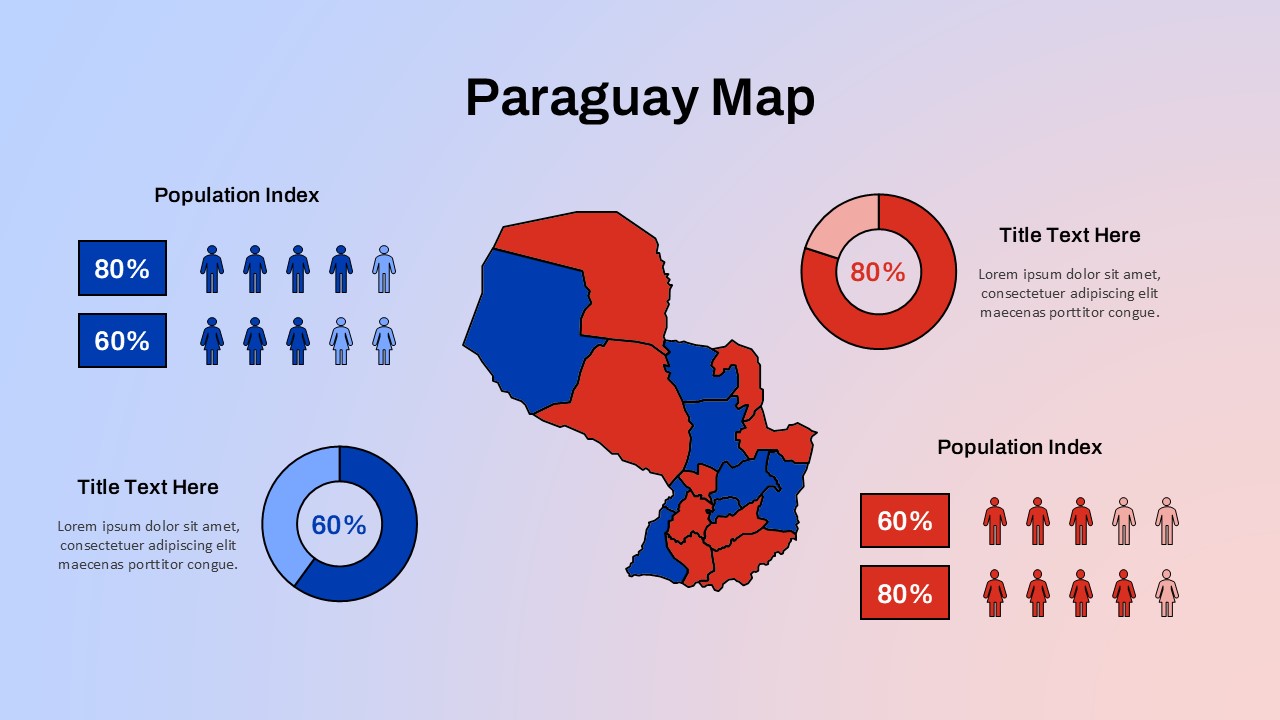
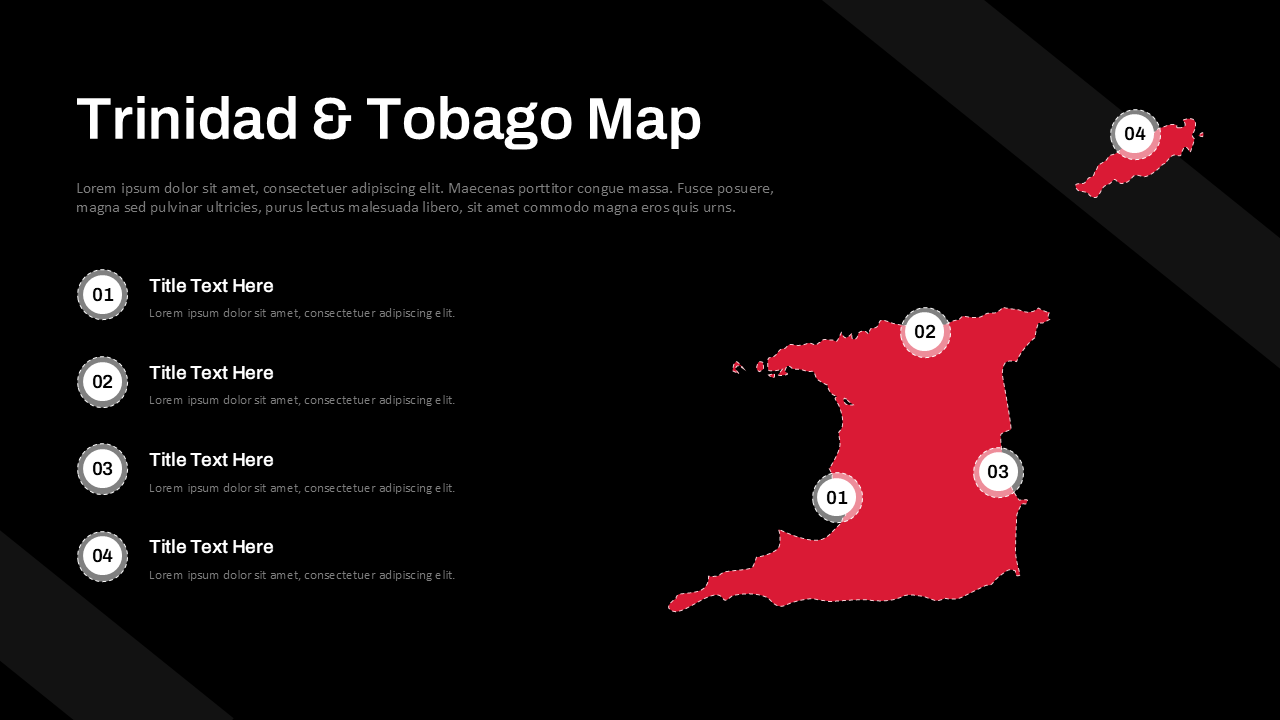
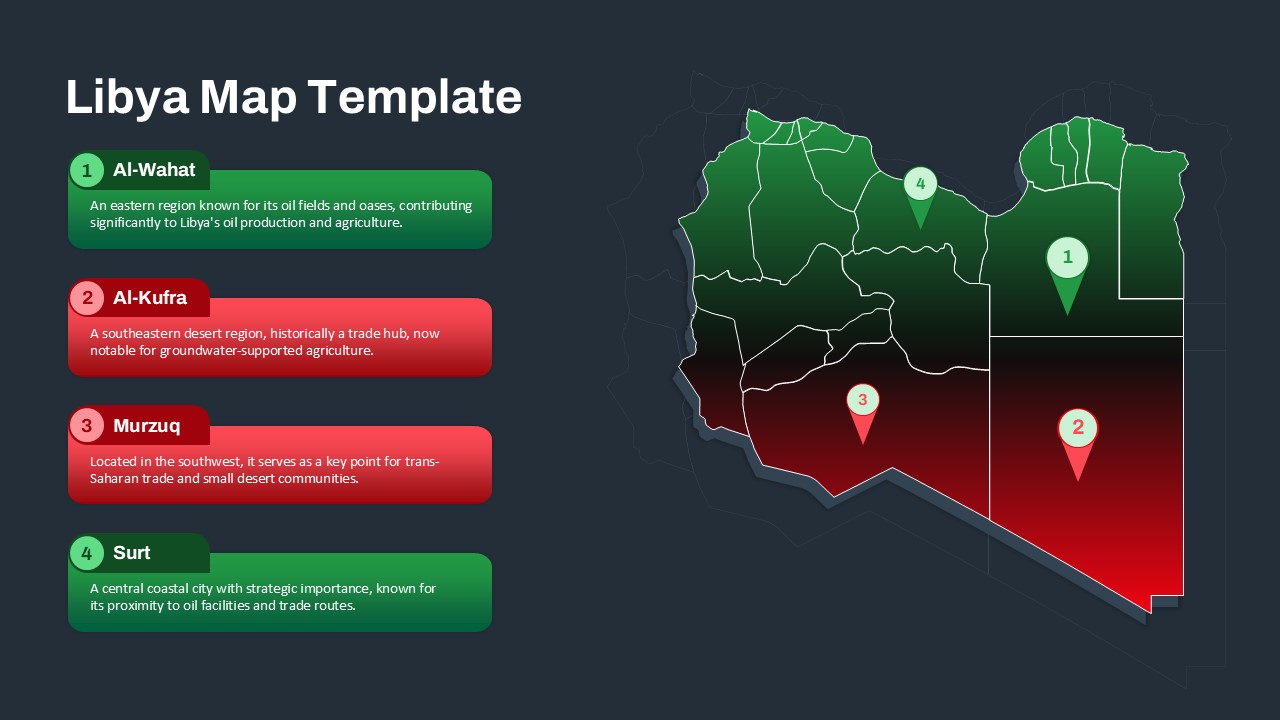
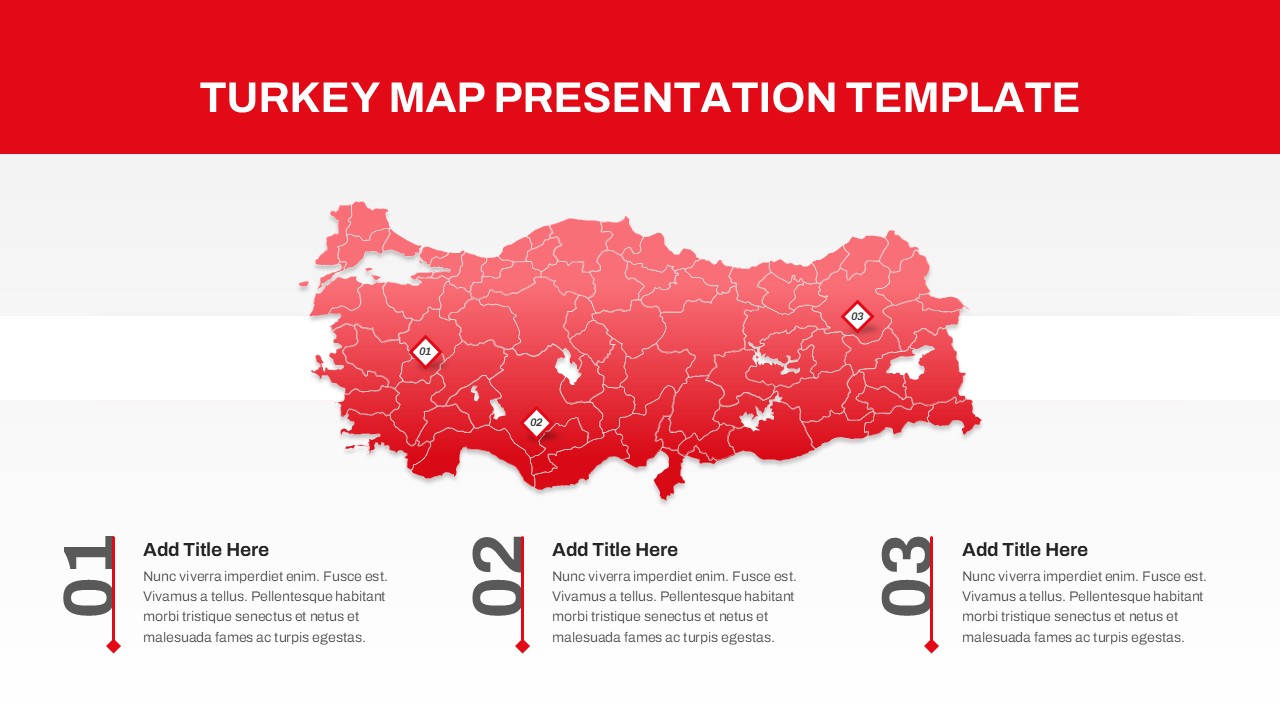
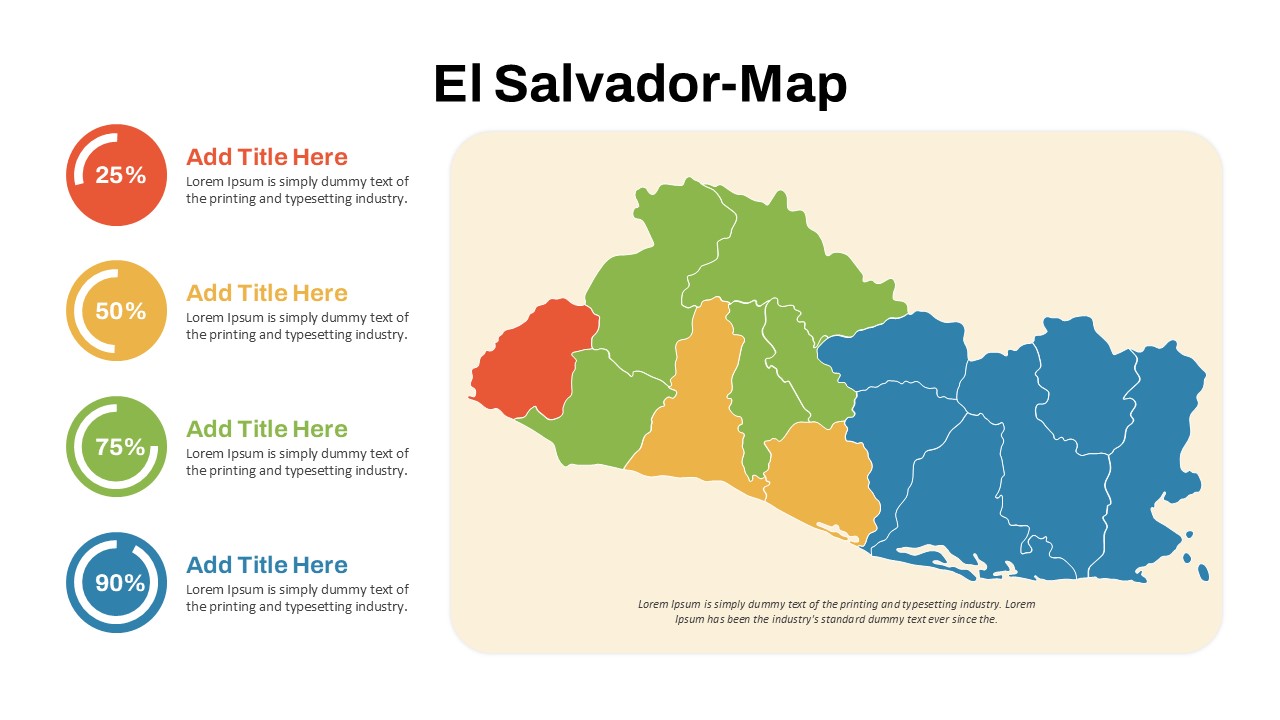
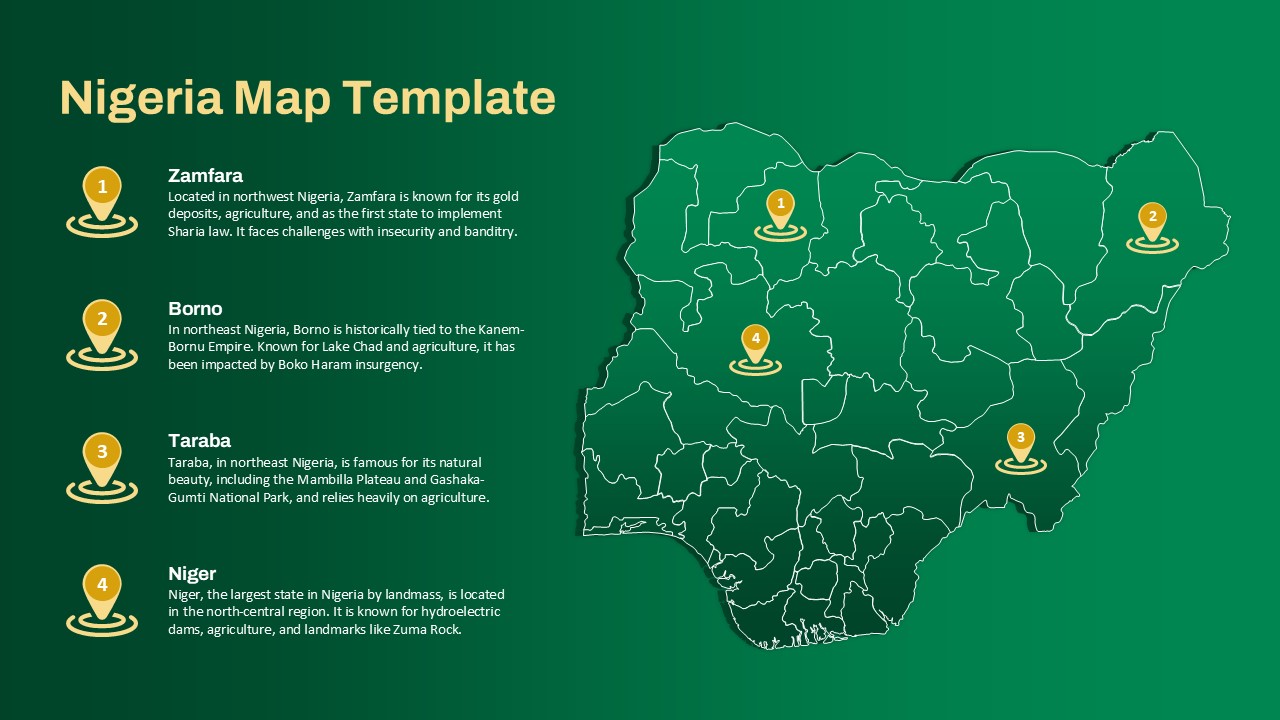
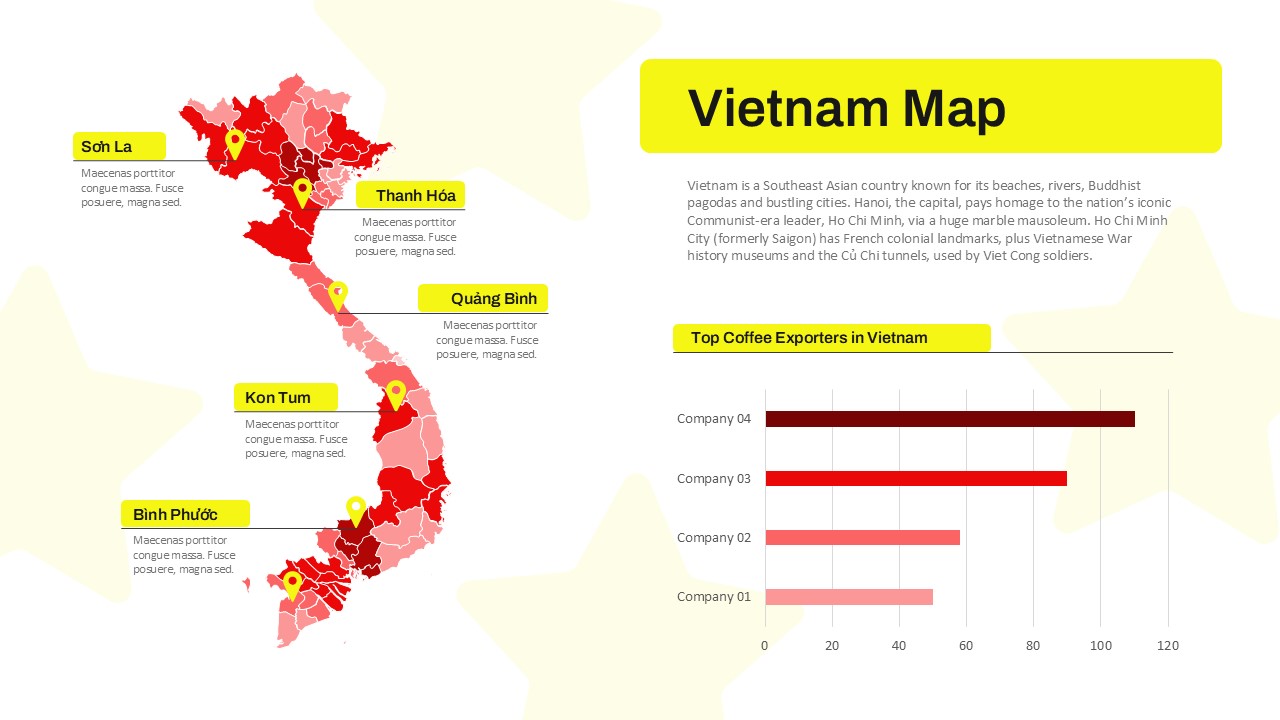
This Malawi map slide provides a clear geographical and statistical overview of key districts, blending cartographic visualization with rainfall data for impactful presentations. The left side features a clean, vector-based map of Malawi with district borders marked in white, and four key regions—Mzimba, Lilongwe, Mangochi, and Thyolo—highlighted in various shades of blue. Each district is pinpointed with a label and matched to a corresponding rainfall bar chart on the right, which shows average annual precipitation in millimeters. The inclusion of both visual map data and an adjacent horizontal bar graph allows for quick comparison and region-specific insights, making the slide ideal for agriculture, climate, or development-related presentations.
At the center, a concise descriptive block introduces Malawi’s geographic, cultural, and economic context. It highlights the country’s dependency on agriculture, multilingual population, and its nickname, “The Warm Heart of Africa.” The slide layout is clean and professional, balancing data with narrative while ensuring every element remains easy to edit.
Optimized for both PowerPoint and Google Slides, the template ensures seamless editing of map colors, text, or data bars. Whether used in academic, NGO, or corporate environments, this visual tool elevates audience understanding through spatial clarity and contextual detail.
See more

Aspect Ratio
16:9Item ID
SKT03708
Features of this template
Other Uses
Beyond rainfall data, repurpose the map and chart layout to present district-level metrics such as population density, health statistics, education rates, or economic indicators. Ideal for progress dashboards, regional comparisons, or demographic analyses.
FAQs
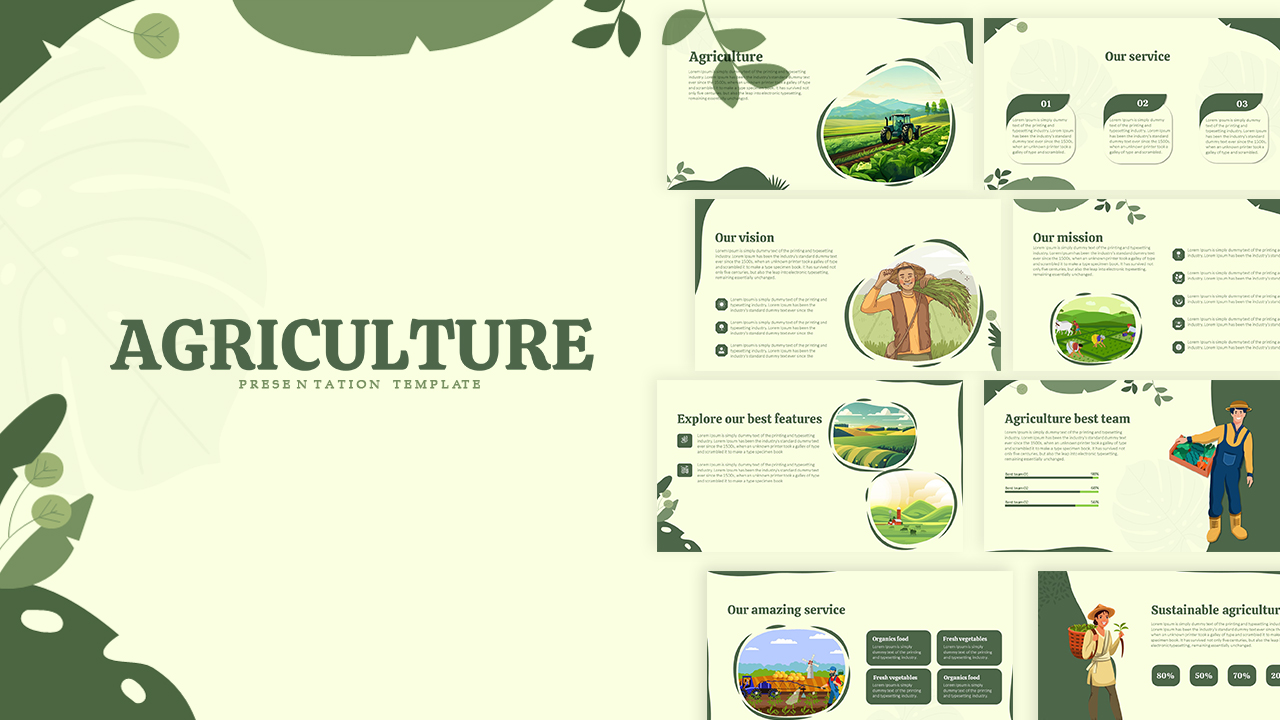
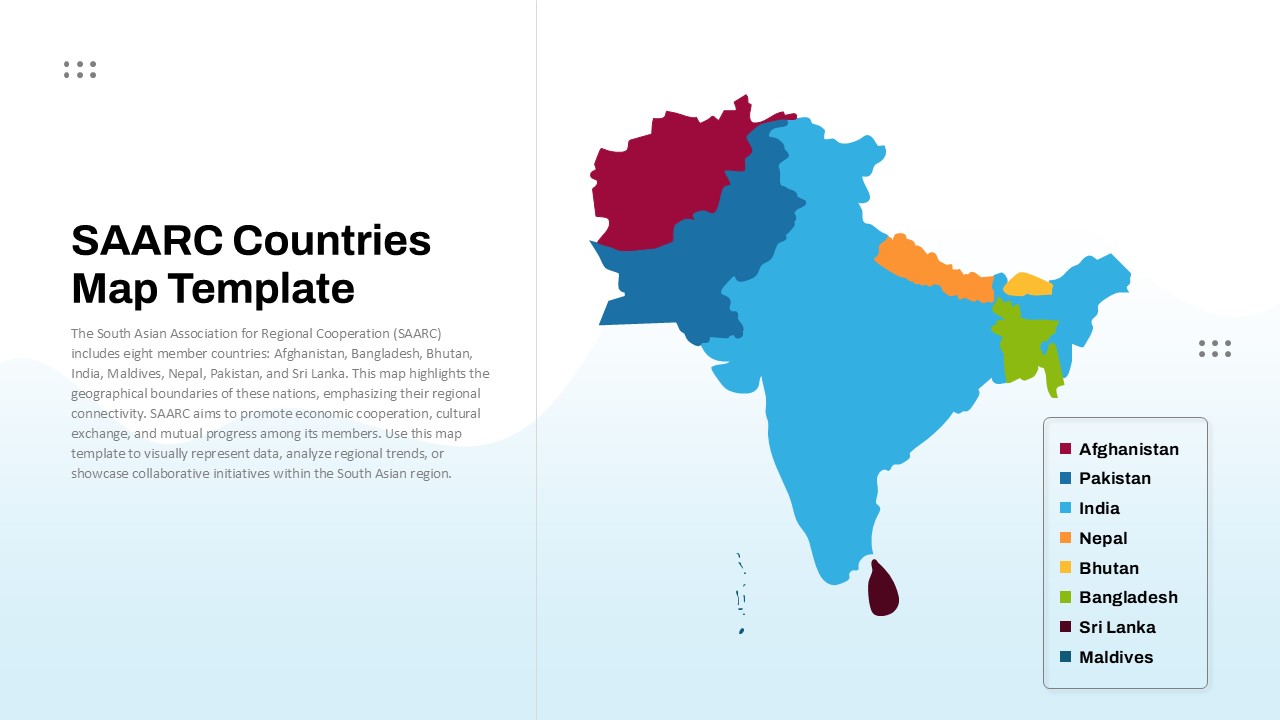
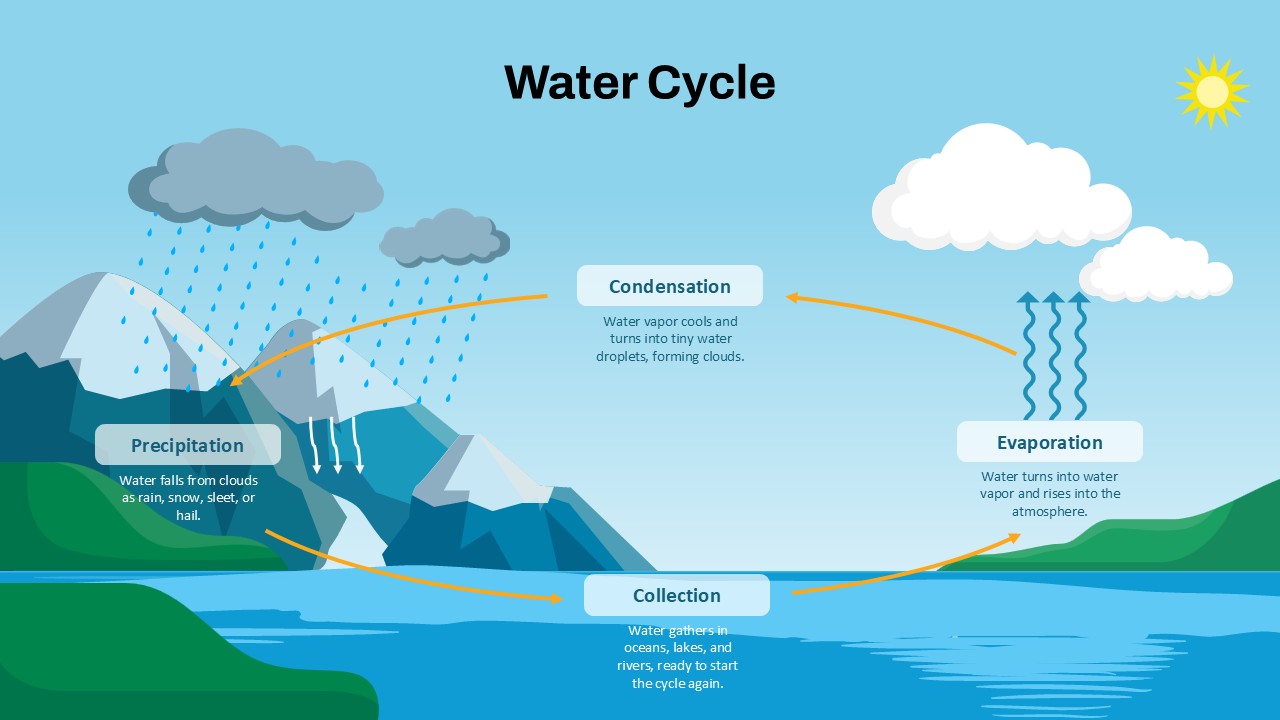
You May Also Like These Presentation Templates


- Free
- Free


- Free
- Free
- Free
- Free


- Free
- Free
- Free
- Free

- Free
- Free
- Free
- Free
- Free
- Free